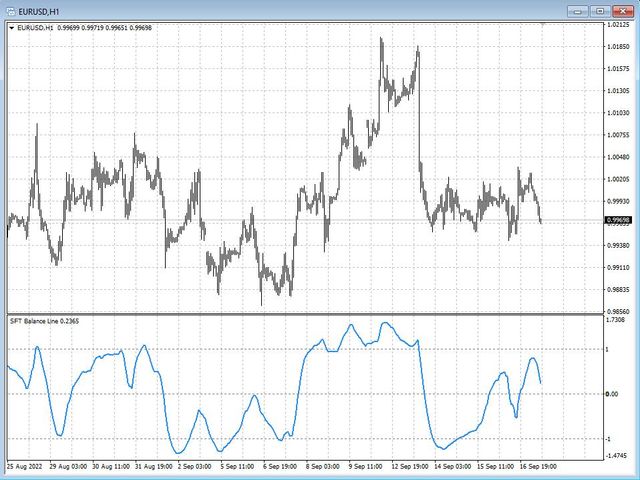
SFT Balance Line
- Indikatoren
-
Artem Kuzmin
 ALL PRODUCTS ▶️ https://www.mql5.com/ru/users/zombiezorrofx/seller
🔥 Maximum commission discounts:
💠 Binance 35% (trading bypassing sanctions) - Version: 1.0
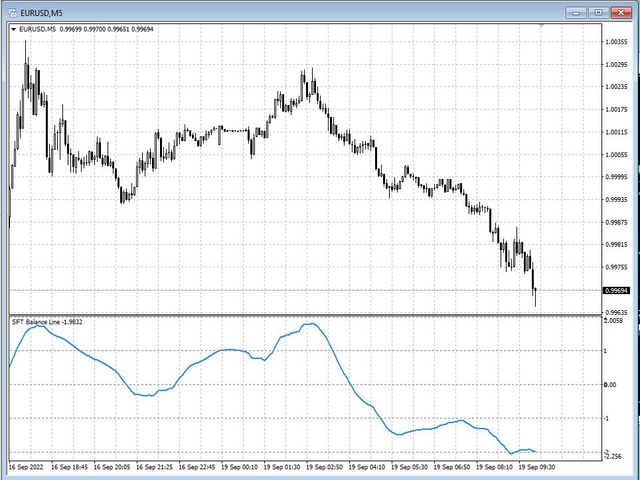
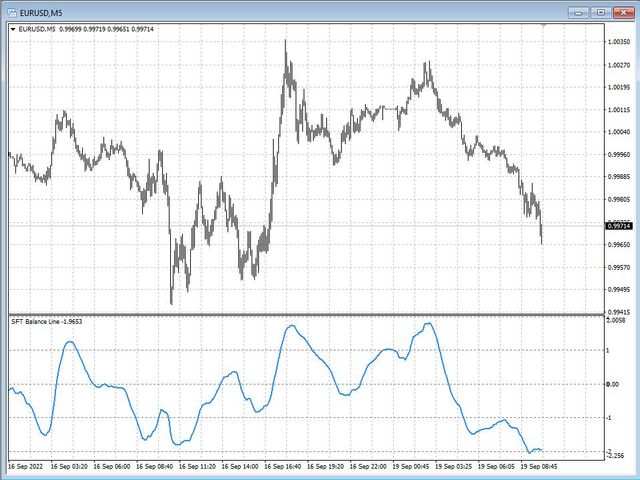
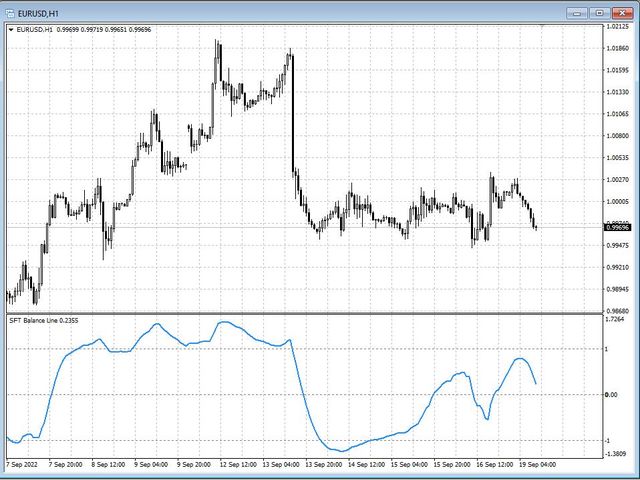
Der Indikator errechnet automatisch den ausgeglichenen Kurswert.
Er zeigt an, in welche Richtung und um wie viel der ausgeglichene Kurswert aktuell verschoben ist.
Funktioniert auf allen Zeitfenstern, für alle Währungspaare, Metalle und Kryptowährungen.
Kann bei der Arbeit mit binären Optionen verwendet werden.
Wesentliche Merkmale
- Nicht neu gezeichnet;
- Einfache und schnelle Einrichtung;
- Klare Interpretation der Messwerte;
- Funktioniert auf allen Zeitrahmen und für alle Symbole;
- Geeignet für den Handel mit Währungen, Metallen, Optionen und Kryptowährungen (Bitcoin, Litecoin, Ethereum, etc.);
- Geeignet für den manuellen Handel und für die Entwicklung von Expert Advisors;
Er kann sowohl separat als auch zusammen mit anderen Indikatoren verwendet werden.
Einstellungen des Indikators
- Balance Line Period - Berechnungszeitraum des Indikators;
Handelsempfehlungen
- Wenn der Indikator die Niveaus 1, 2 oder 3 erreicht, können Sie erwägen, kurze Verkaufs- oder Verkaufspositionen (für Optionen) zu eröffnen;
- Wenn der Indikator dieNiveaus -1 , -2 oder -3 erreicht, können Sie erwägen, Kauf- oder Call-Positionen zu eröffnen ( für Optionen);
- Die Richtung des Handels muss mit der Richtung des Trends auf dem höheren Zeitrahmen übereinstimmen.
- Funktioniert gut in Zusammenarbeit mit dem kostenlosen IndikatorSFTBullet Arrow
Es gibt noch weitere Optionen, im Laufe des Handels werden Sie in der Lage sein, die für Sie günstigste Taktik zu entwickeln.
Weitere Informationen und einen detaillierten Überblick über die Handelsmethoden finden Sie hier:
Handelsstrategie mit dem SFT Balance Line Indikator
Wir wünschen Ihnen einen stabilen und profitablen Handel.
Vielen Dank, dass Sie unsere Software nutzen.
Wenn es Ihnen gefallen hat, dann tun Sie eine gute Tat und teilen Sie den Link mit Ihren Freunden.
Um die Veröffentlichung von neuen nützlichen Handelsprogrammen nicht zu verpassen, fügen Sie mich als Freund hinzu:SURE FOREX TRADING

Der Benutzer hat keinen Kommentar hinterlassen