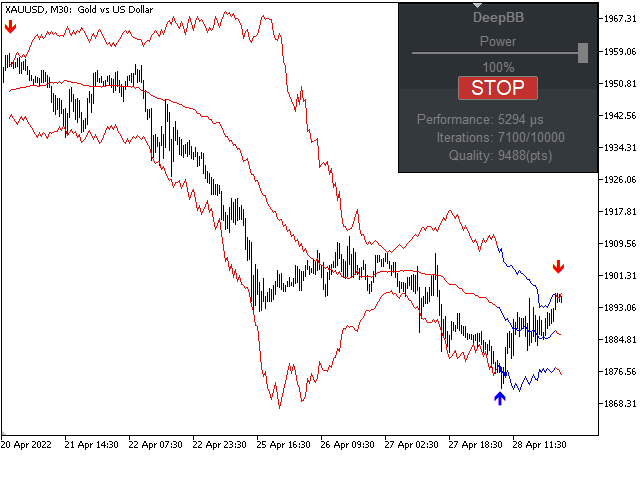
Deep Bollinger Bands
- Indikatoren
- Version: 6.19
- Aktualisiert: 5 Juli 2023
- Aktivierungen: 20
Jeder Indikator hat seine Vor- und Nachteile. Trendindikatoren zeigen gute Signale während eines Trends, hinken aber während eines Tiefs hinterher. Flache Indikatoren gedeihen in der Flaute, sterben aber ab, sobald ein Trend einsetzt. All dies wäre kein Problem, wenn es einfach wäre, vorherzusagen, wann eine Flaute in einen Trend und wann ein Trend in eine Flaute übergeht, aber in der Praxis ist dies eine äußerst schwierige Aufgabe.
Was wäre, wenn man einen solchen Algorithmus entwickeln würde, der die Schwächen eines Indikators beseitigt und seine Stärken verstärkt? Was wäre, wenn ein solcher Algorithmus die Funktionsweise eines Trendindikators während eines Flats verbessern, aber gleichzeitig die Effizienz während eines Trends erhöhen und die Signale eines Flat-Indikators während eines Trends fixieren und während eines Flats perfektionieren könnte?
Deep ist der Algorithmus, der die Vorteile eines Indikators verstärkt und seine Nachteile verringert. Dieser Algorithmus verbessert die Qualität des Indikators durch die Kombination von neuronalen Netzen mit dem Indikatoralgorithmus.
Über den Deep-Algorithmus
Die angegebene Aufgabe wird aufgrund ihrer Nicht-Reproduzierbarkeit und komplexen Regelmäßigkeit am besten durch nicht-lineare Algorithmen gelöst. Neuronale Netze sind ein sehr vielseitiges und leistungsfähiges Werkzeug, mit dem man viel erreichen kann, wenn die Aufgabe richtig gestellt und die Lösung sinnvoll gestaltet ist. Der Algorithmus basiert auf diesem Werkzeug.
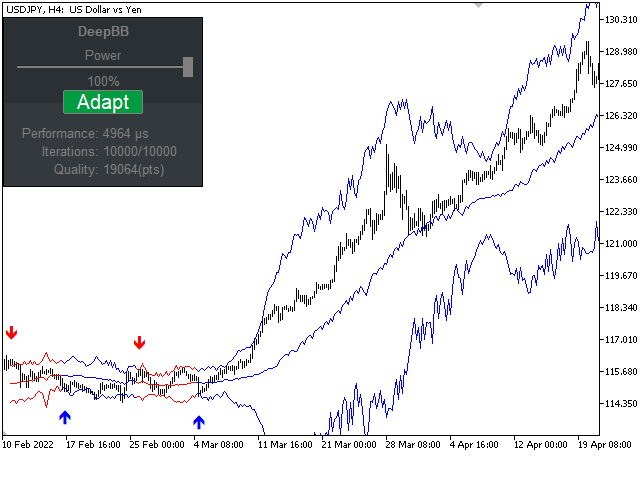
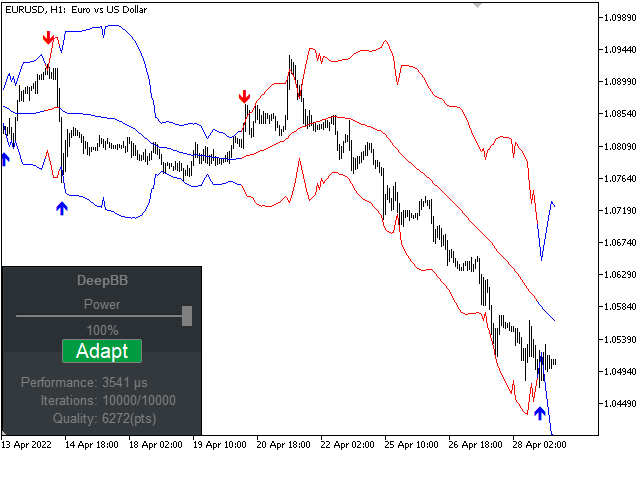
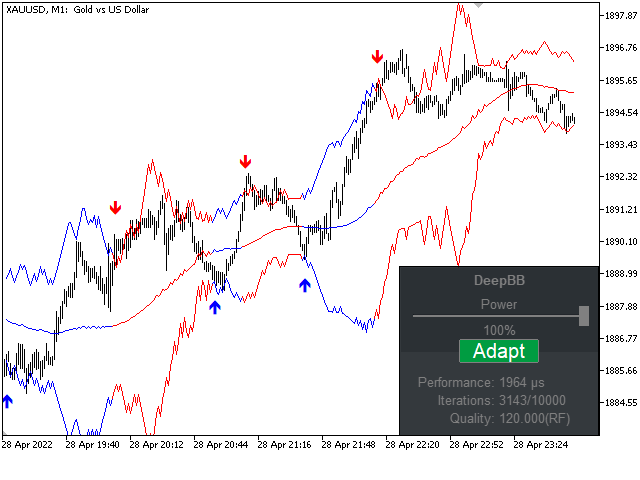
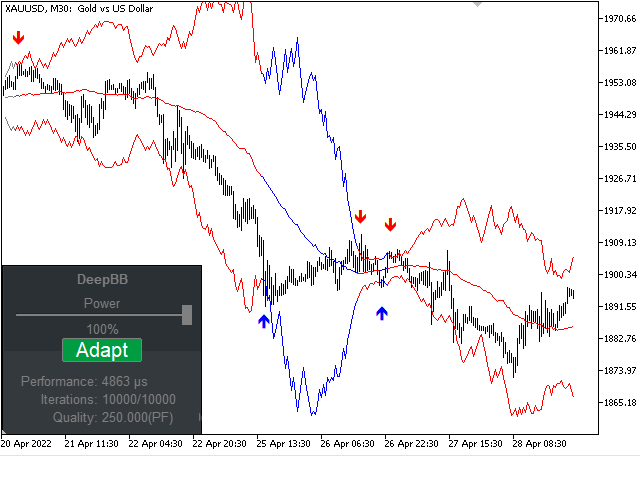
Dieser Algorithmus berechnet die optimalen Perioden und Abweichungen der Bollinger Bänder, abhängig vom Zustand des Trends und der Wohnung. Der Algorithmus trainiert das neuronale Netz, um die optimalen Bollinger-Bänder für jeden Marktzustand vorherzusagen, so dass sich der Indikator an die Flaute und den Trend anpasst und die Unzulänglichkeiten des Grundalgorithmus beseitigt. In der Flaute passt das neuronale Netz den Indikator in Richtung der Flaute an, in der Trendphase in Richtung des Trends.
Die Architektur des neuronalen Netzes und der heuristische Suchalgorithmus wurden speziell für die optimale Lösung der Aufgabe entwickelt. Der Einfachheit halber gibt es Voreinstellungen für die Struktur des neuronalen Netzes sowie alle notwendigen Parameter für die Feinabstimmung des neuronalen Netzes.
Vorteile
- Um die Berechnungen zu beschleunigen, können Sie eine Grafikkarte (GPU) verwenden, was die Leistung und die Ergebnisse erheblich verbessert. Darüber hinaus kann der Indikator asynchron berechnet werden, wobei alle Kerne Ihrer CPU und GPU genutzt werden.
- Der Algorithmus verfügt über ein selbstlernendes System. Dabei handelt es sich um ein adaptives System, das mit Hilfe eines neuronalen Netzes ständig flexibel lernt, so dass der Algorithmus stets mit allen Marktveränderungen Schritt hält.
- Grafisches Bedienfeld. Über das Panel direkt auf dem Chart können Sie das Lernsystem flexibel steuern und verwalten.
- Parameter für die Feinabstimmung aller Funktionen.