CloseLines
- Indikatoren
- Version: 1.0
- Aktivierungen: 10
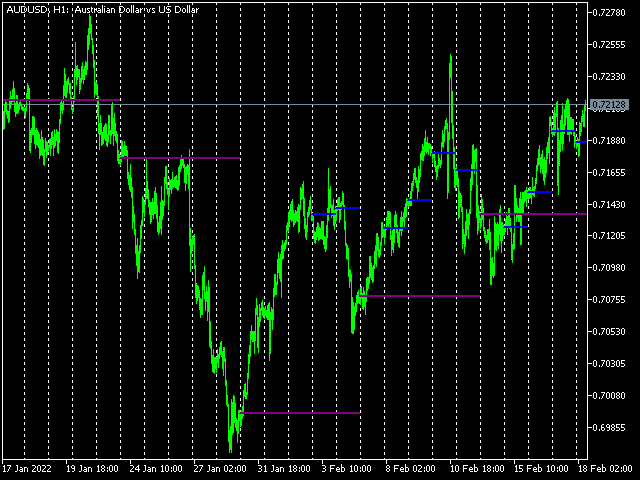
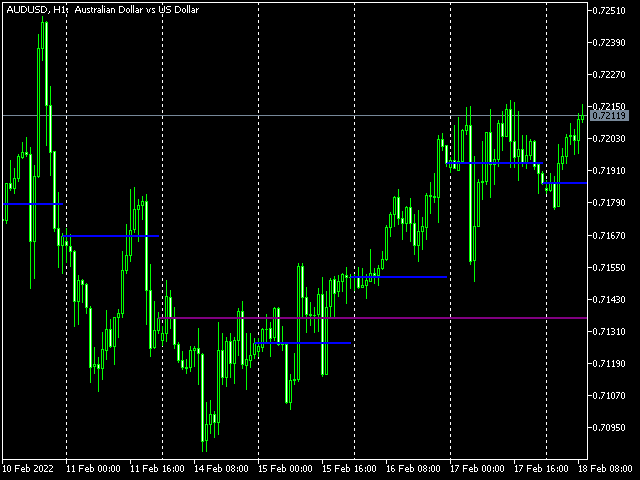
Der Indikator zeichnet Linien (mit Linienobjekten) zu den Schlusskursen der letzten geschlossenen Balken, auf ausgewählten Zeitfenstern.
Parameter
- Close line 1 close price timeframe - Zeitrahmen des ersten Schlusskurses
- Close line 1 color - Farbe des 1. Schlusskurses
- Close line 1 width - Breite des 1. Schlusskurses
- Close line 1 style - Stil des 1. Schlusskurses
- Close line 1 max count - die maximale Anzahl der Linien, die für den 1. Schlusskurs gezeichnet werden, unter Berücksichtigung des im Parameter Close line 1 timeframe ausgewählten Zeitrahmens. Wenn der ausgewählte Zeitrahmen D1 ist, bedeutet 12, dass die letzten 12 Schlusskurse der Tageskerzen geplottet werden.
- Close line 1 display timeframes - die Zeitrahmen für den ersten Schlusskurs, auf denen die Linien angezeigt werden sollen. Sie können die Standardnamen der Zeitrahmen (H1, H4 usw.) oder die Minutendarstellung davon (60, 240 usw.) verwenden. Das Trennzeichen ist ; (Semikolon).
Dasselbe gilt für Zeile 2 und Zeile 3.
- Auf Zeitrahmen basierende Linienbreiten - siehe den zusätzlichen Absatz.
Zeitrahmenbasierte Linienstärken
Die Linienstärken haben eine zusätzliche Funktion, die Ihnen helfen kann, sich leichter zurechtzufinden. Der Standardwert für die Linienstärke ist der, den Sie mit Ihren Parametern angeben, aber:
- Wenn die aktuelle Periode des Diagramms kleiner ist als die Periode der Linie, erhöht das Programm die Dicke um eins,
- wenn die aktuelle Periode des Diagramms größer ist als die Periode der angegebenen Linie, verringert das Programm die Dicke um eins,
- Andernfalls bleibt die Liniendicke immer so, wie Sie sie eingestellt haben.
Beispiel (Standardeinstellung, d.h. Linienstärke 2):
Im Diagramm W1:
- Die MN-Schlusskurslinien haben eine Stärke von 3,
- W1-Schlusskurslinien haben eine Dicke von 2,
- die D1-Schlusskurslinien haben eine Dicke von 1.