All TimeFrames RSI MT5
- Indikatoren
- Version: 1.9
- Aktualisiert: 18 November 2021
- Aktivierungen: 5

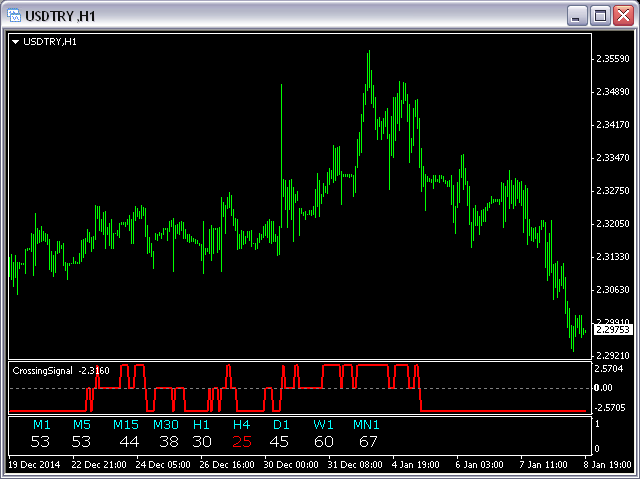
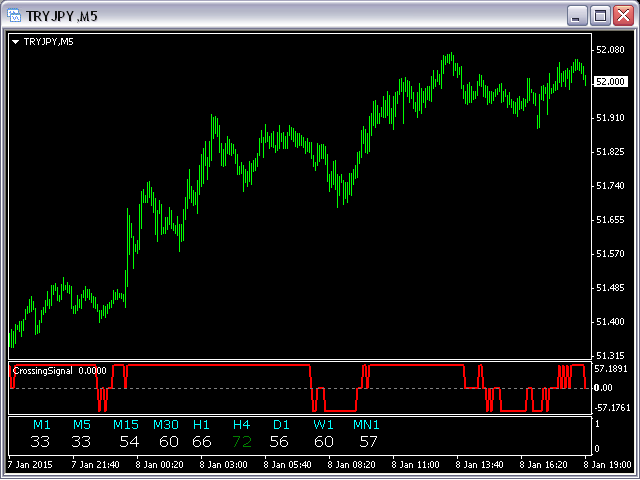
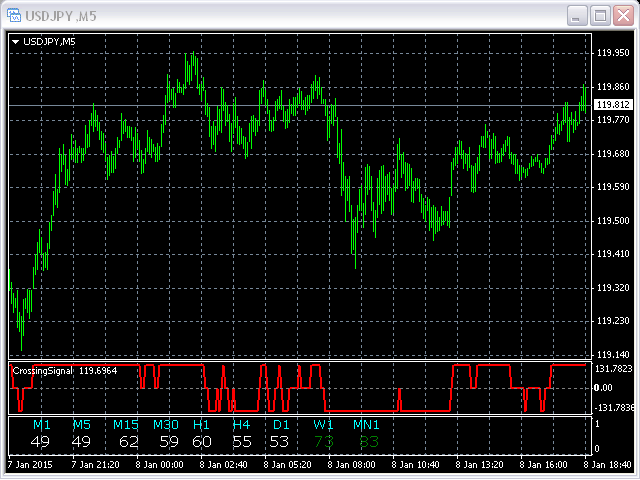
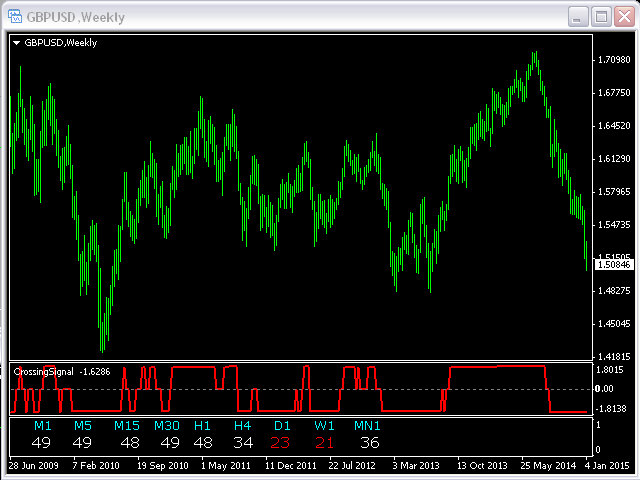
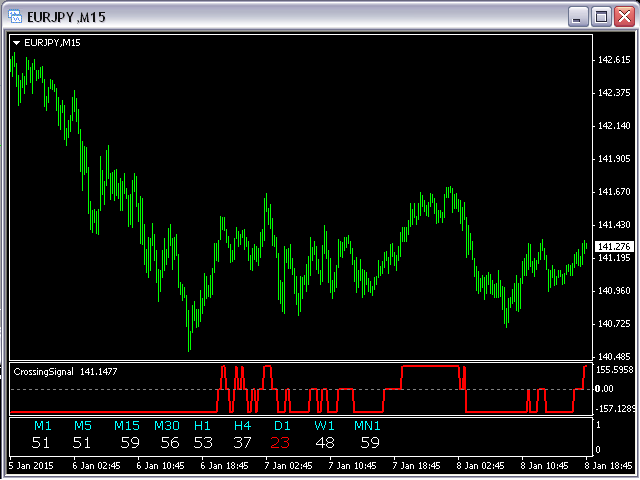
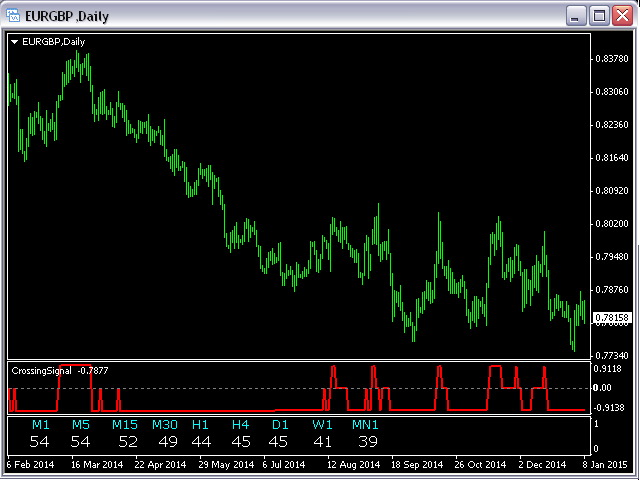
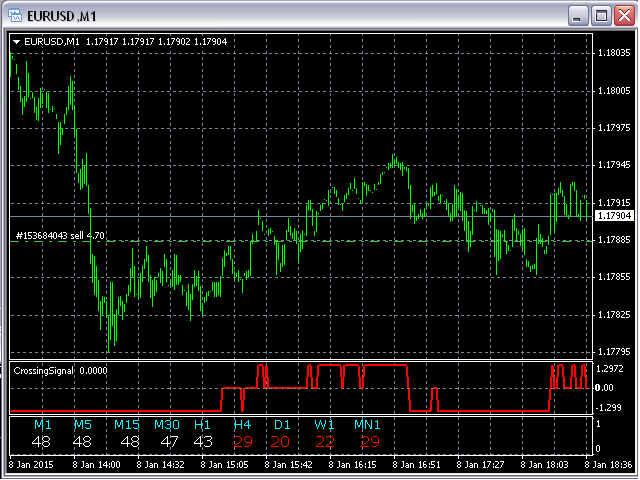
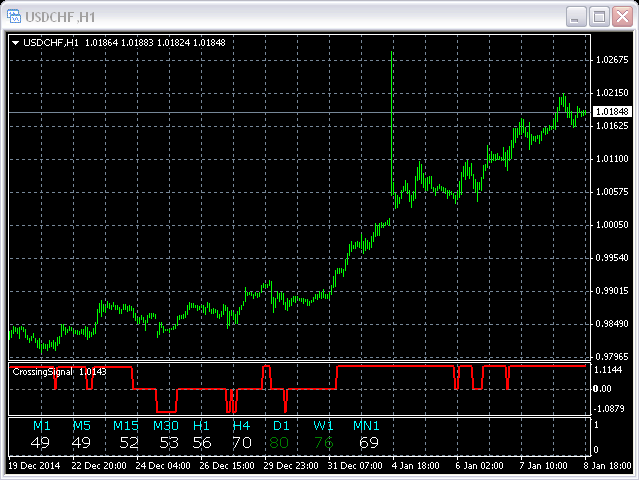
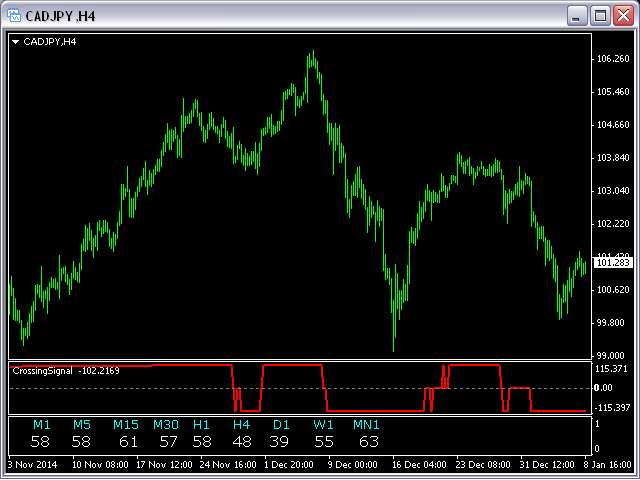
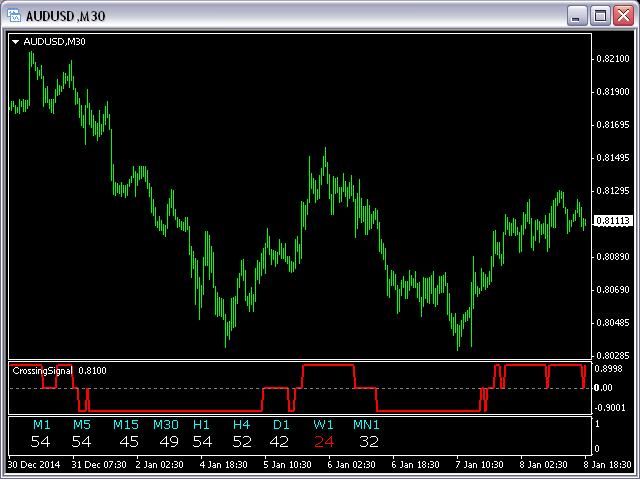
Dieser Indikator basiert auf dem klassischen Indikator RSI (Relative Strangth Index) und wird für diejenigen hilfreich sein, die nicht nur eine visuelle, sondern auch eine digitale Darstellung des Indikators lieben und zu nutzen wissen. Alle TimeFrames RSI MT5 Indikator zeigt Werte aus jedem Zeitrahmen.
Sie werden in der Lage sein, die wichtigsten Eingabeparameter für jeden RSI für jeden TF zu ändern.
Beispiel für M1:
- sTF1_____ - Bezeichnung (String) des M1 TF.
- Periode1 - Anzahl der für die Berechnung des Indikators verwendeten Balken.
- Preis1 - verwendeter Preis. Kann eine der Preiskonstanten sein.
Gemeinsame Eingabeparameter:
- OverboughtLevel - horizontale obere Levels im Indikatorfenster
- OversoldLevel - horizontale untere Niveaus im Indikatorfenster