Candle Analysis
- Indikatoren
-
Navdeep Singh
 The momentum of money is always more potent than the gravity of logic
Free or paid, All tools are coded with intention to help traders
My tools:- - Version: 1.0
- Aktivierungen: 10
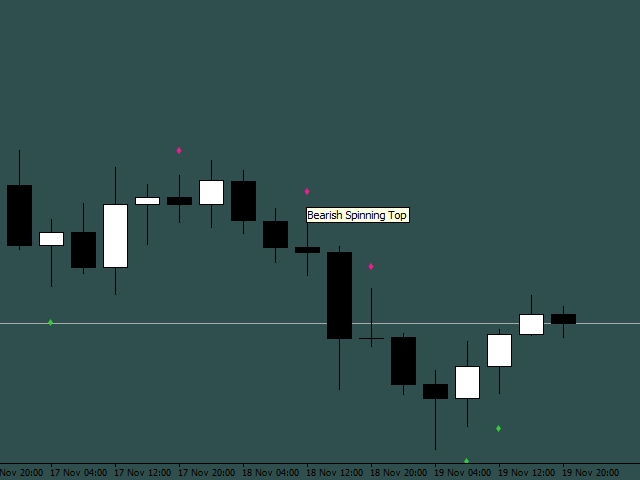
50+ Candlestick-Muster, simulierte Handelsergebnisse, Top Five Performer
Candle Analysis erweitert die Candlestick-Pattern-Analyse, indem es nicht nur Patterns identifiziert, sondern auch die vergangene Performance der Patterns aufzeichnet.
Was es tut:-
Identifiziert und stellt die Ergebnisse im Chart dar
Zeigt die Top-Muster für Bullish und Bearish an.
Das Protokoll kann auf der Registerkarte "Experten" ausgedruckt werden, um simulierte Handelsergebnisse zu sehen.
Zeigt alle oder ausgewählte Muster an
Warnungen bei der Bildung von Mustern
Ausführlichere Informationen im Blog