Liquidity level
- Indikatoren
-
Navdeep Singh
 The momentum of money is always more potent than the gravity of logic
Free or paid, All tools are coded with intention to help traders
My tools:- - Version: 1.3
- Aktualisiert: 19 Januar 2022
- Aktivierungen: 10
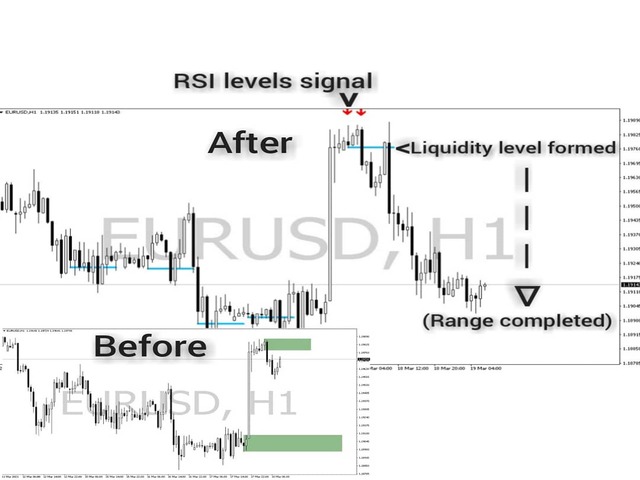
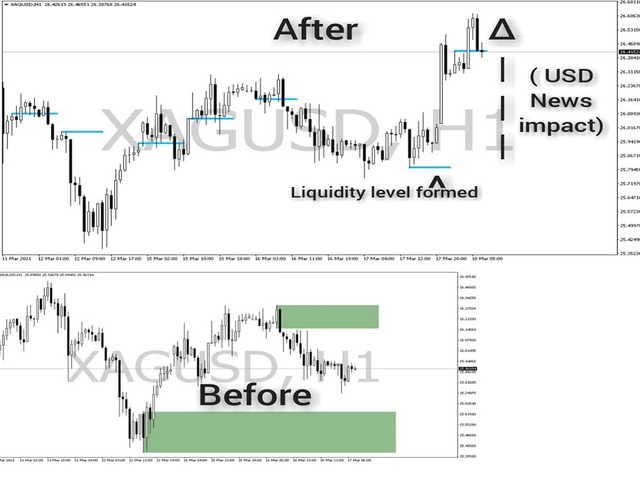
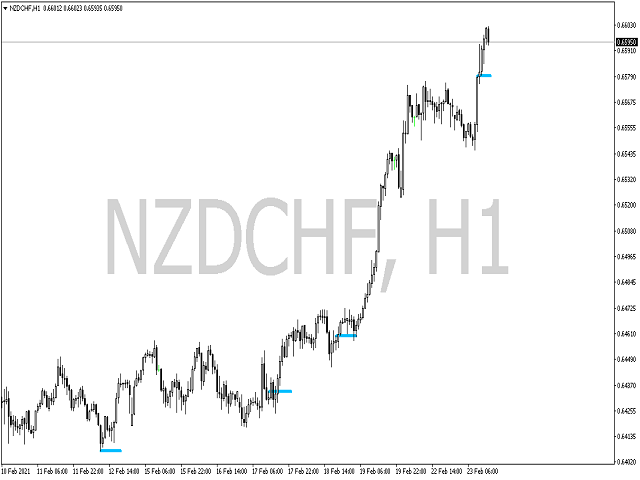
Der Indikator hilft dem Händler bei der Identifizierung potenzieller Liquiditätsniveaus. Der in diesem Indikator verwendete Algorithmus prüft das Verhalten des Vermögenswerts unter Berücksichtigung der Preisniveaus, des Momentums und der Volumenanalyse.
Merkmale:-
Parameter für Signaloptimierung und Warnungen.
Verwendung:-
Die vom Indikator gebildeten Niveaus können Händlern bei der Identifizierung potenzieller Einstiege, Ausbrüche oder Umkehrungen behilflich sein. Er kann Händlern mit technischem Handelshintergrund oder sogar reinem Preisaktionshandel helfen.
Beispiele für die Verwendung des Indikators in der technischen Analyse finden Sie in den folgenden Screenshots.