Stochastic Force
- Indikatoren
-
Navdeep Singh
 The momentum of money is always more potent than the gravity of logic
Free or paid, All tools are coded with intention to help traders
My tools:- - Version: 1.1
- Aktualisiert: 15 Februar 2021
- Aktivierungen: 10
Stochastic Force ist eine erweiterte Version des stochastischen Oszillators. Anstatt den regulären Preis zu verwenden, werden effizientere Preisdaten als Input für den Oszillator bereitgestellt, die die Preiseffizienz, das Volumen und das Marktrauschen berücksichtigen. Außerdem wird der Preis mit dem ausgewählten Durchschnittstyp vorgefiltert und dann durch einen gleitenden Rumpfdurchschnitt nachgefiltert, der einen sanften Übergang des Oszillators gewährleistet. Er eliminiert ein Maximum an Fehlsignalen und hat das Potenzial, ein integraler Bestandteil jedes technischen Handelssystems zu werden.
Wichtigste Merkmale
- Multi-Timeframe-Fähigkeit
- Eine breite Palette von Parametern zur Optimierung der Signale
- Alarme, E-Mails und Push-Benachrichtigungen für Mobiltelefone
Vorteile
- Einfach zu verstehender Indikator für Anfänger
- Zuverlässige Signale
- Funktioniert auf allen Instrumenten und Zeitfenstern
- Nicht nachmalendes Werkzeug
- Erzeugt ein Minimum an falschen Signalen
Empfohlene Anwendung
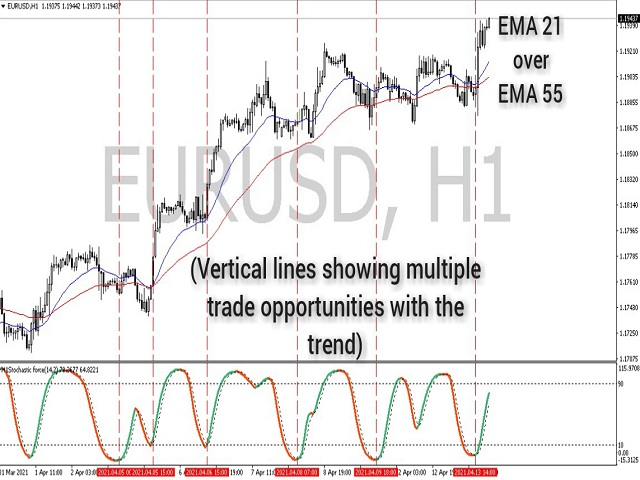
Händler können ihr eigenes Fachwissen bei der Implementierung dieses Tools in ihre technischen Systeme nutzen. Dieüberkauften und überverkauften Niveaus können für das Timing potenzieller Handelseinstiege verwendet werden. Nachfolgend finden Sie einige Beispiele für zuverlässige Methoden, die die Leistungsfähigkeit dieses Tools zeigen.
- Beispiel eins zeigt die Verwendung von zwei EMAs zur Identifizierung von Trend- und überverkauften Niveaus des Indikators für Kaufsignale. Siehe Screenshot 1
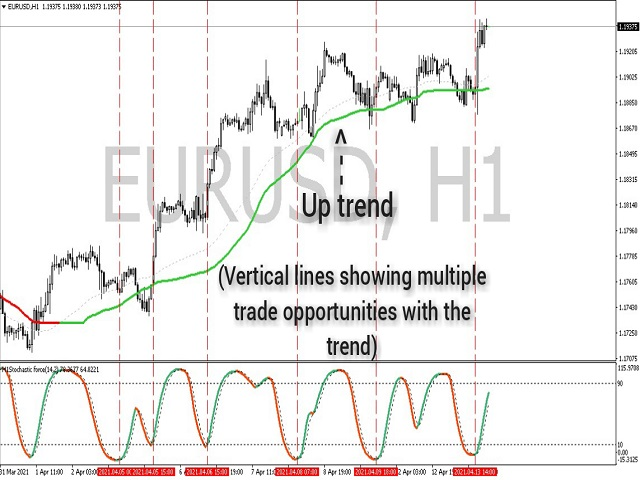
- Beispiel zwei zeigt das Zusammenspiel von CMA und Stochastic Force, um potenzielle Handelseinstiege zu finden. Siehe Screenshot 2
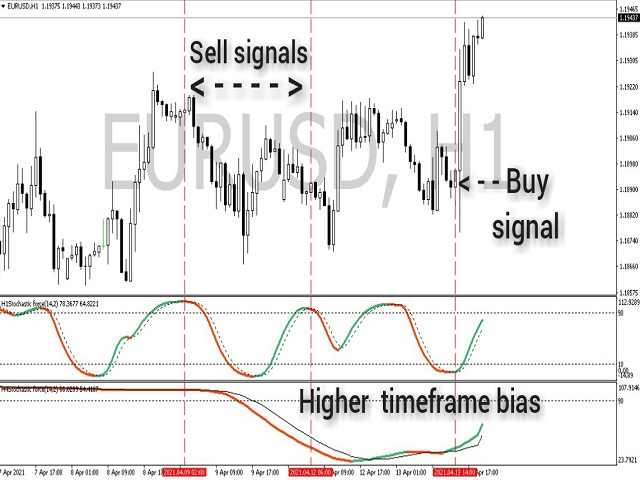
- Beispiel drei zeigt, wie die Verzerrung eines höheren Zeitrahmens genutzt werden kann, um sichere Entscheidungen zu treffen. Siehe Screenshot 3