Candle Analysis
- インディケータ
- バージョン: 1.0
- アクティベーション: 10

50+ Candlestick Patterns, Simulated Trading Results, Top Five Performers
Candle Analysis extends Candlesticks Pattern Analysis by not only identifying Patterns but also recording the Past Performance of the Patterns.
What it Does:-
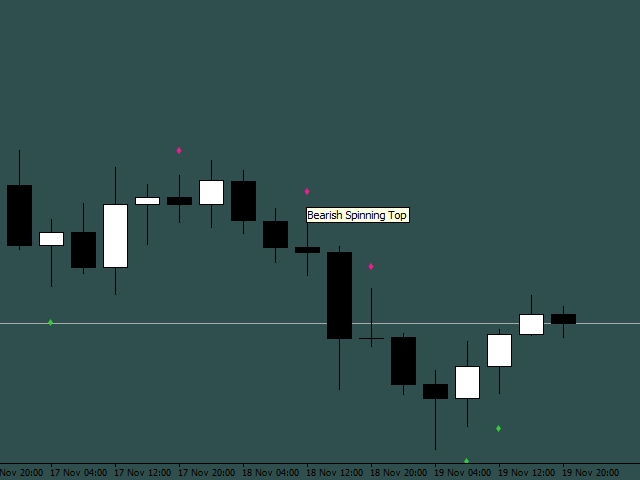
Identifies and plots results on chart
Displays Top Patterns for both Bullish and Bearish type.
Log can be printed in experts tab to see Simulated Trading results
Displays All or Selected Patterns
Alerts on Pattern formation
More detailed information in Blog