Volume Bands Chart
- Indicadores
- Versión: 1.0
- Activaciones: 5

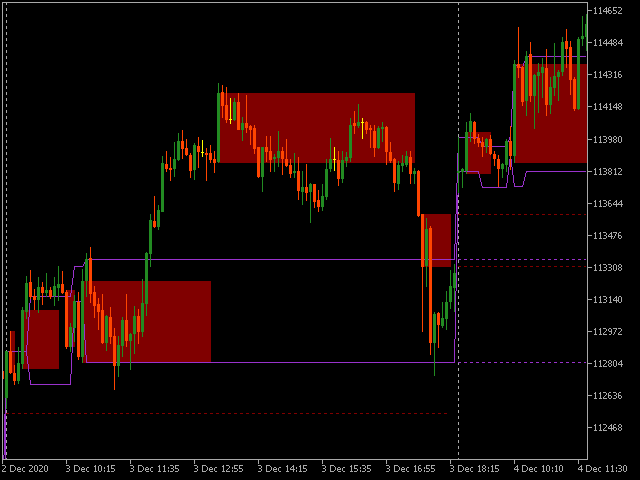
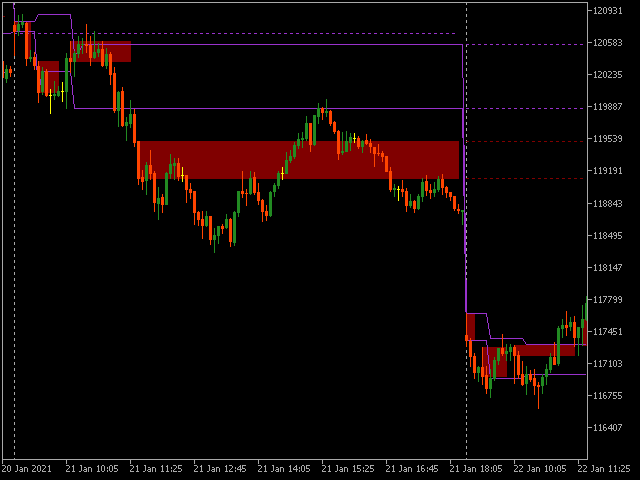
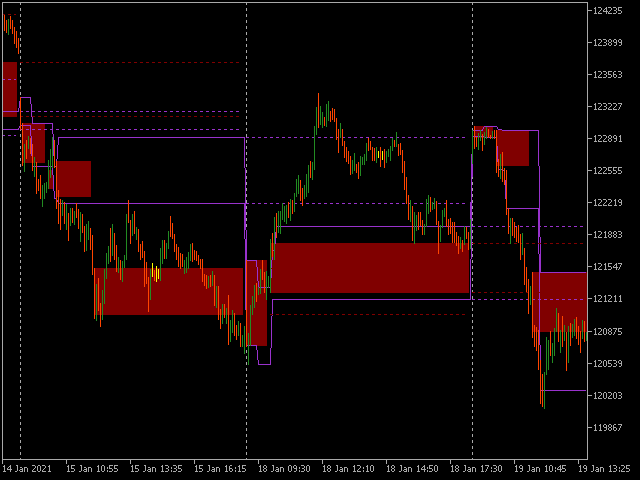
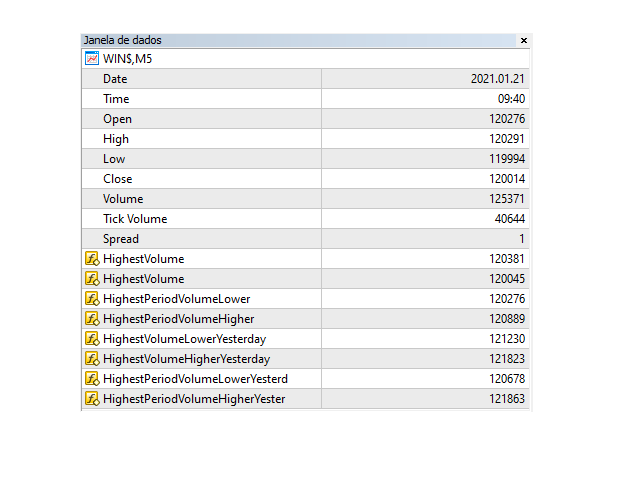
Este indicador marca los niveles de volumen relevantes a lo largo del día. Los dos niveles relevantes son la vela con más volumen y el periodo con más volumen de lotes negociados.
El fondo rojo relleno es el rango de precio con el volumen más relevante del día (probablemente el gran jugador que está comandando el juego). Las líneas púrpuras muestran el rango de precios con más volumen (probablemente una zona donde algún gran jugador está acumulando antes de forzar una dirección del mercado). También están las líneas de puntos que marcan los rangos de volumen del día anterior.
Se puede observar que los niveles de volumen marcados por el indicador se convierten en zonas de soporte/resistencia incluso sin los picos/valles que suele utilizar el análisis gráfico.
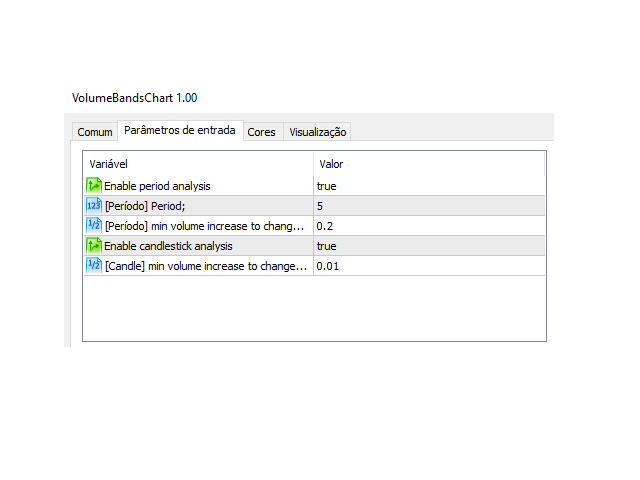
Para los programadores de EA: Este indicador no se redibuja. Es seguro de usar con EAs.