RaptorT Cumulative and Cumulative Volume Delta
- Indikatoren
- Version: 1.1
- Aktualisiert: 12 November 2020
- Aktivierungen: 5
RaptorT: Kumulatives Volumen und kumulatives Volumen-Delta (Kauf-Verkaufsdruck)
Einführung
RaptorT CV & CVD (CVD ist auch bekannt als Buying/Selling Pressure oder Book Pressure) bietet zwei grundlegende und aussagekräftige Indikatoren für den Handel mit Volumen als Hauptindex und Gewicht des Marktinteresses. In Kombination mit der VWAP-Linie und ihren vier oberen und unteren Standardabweichungen, der Entwicklung des PVP (Peak Volume Price, das Äquivalent des POC für das alte Marktprofil), des Volumenprofils und des Volumenprofil-Deltas sowie des Standard-RSI und MACD für die Identifizierung von Divergenzen, überverkauften/überverkauften Bereichen und anderen Analysen liefert er gute Erkenntnisse. RaptorT CV & CVD werden aus jedem einzelnen Tick des festgelegten Zeitraums berechnet.
ACHTUNG: Da RaptorT CV & CVD grobe Daten verwendet und die Berechnung auf der Erkennung und Pufferung jedes einzelnen Ticks und der zugehörigen Daten basiert, muss der Benutzer VOR dem Herunterladen und der Installation des Indikators auf eigene Verantwortung sicherstellen, dass der Broker und der Datenlieferant, an den er/sie angeschlossen ist, Tick-Daten, die Richtung (Ask/Bid) des Ticks und die Volumina des Ticks bereitstellt. Falls keine realen Volumina verfügbar sind, kann der Indikator mit Volumina arbeiten, die auf der Basis von Ticks berechnet werden, was ein typischer Nachteil ist. Wenn der Benutzer den Indikator auf einer vergangenen Zeitspanne in Bezug auf den Zeitpunkt, an dem er die MT5-Anwendung gestartet hat, z.B. die letzten 24 Stunden, anzeigen möchte, muss er sicherstellen, dass der Broker und der Datenfeeder das Herunterladen des vollständigen Datensatzes der vergangenen Ticks erlauben.
Merkmale des RaptorT CV & CVD Indikators
- Kumulatives Volumen: Die Linie besteht aus Punkten, die die Summe der ausgetauschten realen oder Tick-Volumina in den letzten N Sekunden darstellen, wobei N ein Parameter ist, den der Benutzer frei einstellen kann. Die mobile Summe ist nützlich, um lokale Schwankungen in der Zeitdimension zu reduzieren und den Anstieg oder Rückgang der ausgetauschten Volumina anzuzeigen. Der CV-Indikator ermöglicht auch die Anzeige des Durchschnitts über M Perioden, wobei eine Periode dem ausgewählten Candlestick-Zeitrahmen entspricht. Bei einem Zeitrahmen von M.1 beispielsweise zeigt ein CV mit N=180s und aktivierter Durchschnittslinie auf M=8 die Summe der gehandelten Volumina über die letzten 180s, d.h. 3 Kerzen, und den Durchschnitt dieser Linie, berechnet über die letzten 8 Linienpunkte, die den letzten 8 Minuten entsprechen. CV ist immer nicht negativ; das niedrigste gehandelte Volumen ist 0.
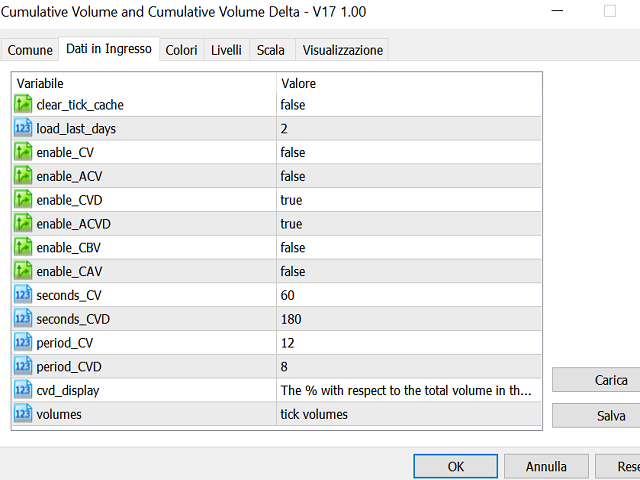
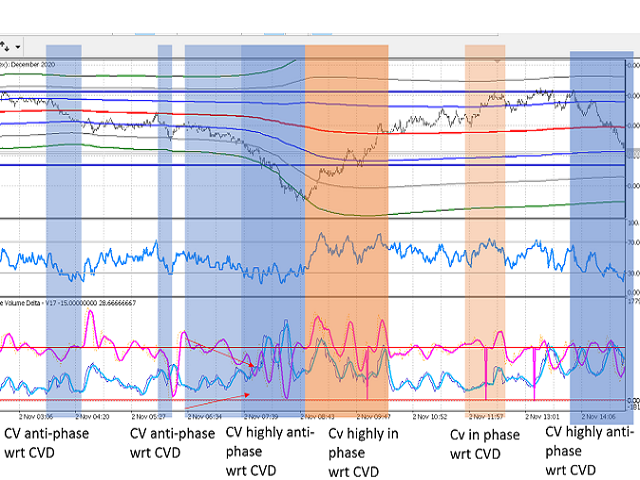
- Kumulatives Volumen-Delta: Die Linie setzt sich aus der Differenz zwischen Kauf- und Verkaufsvolumen im betrachteten Zeitraum zusammen. Dieser Indikator hat ein Vorzeichen, da er negativ oder positiv sein kann. Da bei der Berechnung die Summe der letzten N Sekunden berücksichtigt wird, die nicht unbedingt gleich dem CV ist, ist die Richtung des CVD-Indikators (steigend oder fallend) wichtiger als sein Vorzeichen (negativ oder positiv). Natürlich ist ein positives Vorzeichen bei einem steigenden CVD-Trend eine weitere Bestätigung für einen möglichen steigenden Preistrend, da es viel mehr Verkäufer als Käufer auf dem Markt gibt. Unidirektionale Trades (nicht Buy, nicht Ask, sondern Ask/Buy) werden zu den Ask- und Bid-Volumina addiert, so dass sie als Differenz vernachlässigt werden. Der Benutzer kann die Durchschnittslinie aktivieren, die auf die gleiche Weise wie der CV-Indikator berechnet wird. Der Benutzer kann zwischen drei Arten der Berechnung des CVD-Indikators wählen
o Tatsächlicher Wert: einfach die Differenz zwischen Kauf- und Verkaufsvolumen im betrachteten Zeitraum.
o Prozentual: Die Differenz wird durch das Gesamtvolumen von geteilt und mit 100 multipliziert. Dadurch wird der CVD-Trend trotz des gesamten gehandelten Volumens verstärkt. CVD-Kurven werden vergrößert.
o Actual x Volume: Diese innovative Art der Visualisierung hebt starke Trends in Richtung Ask- oder Bid-Richtung hervor, wenn sie in Kombination mit einem aussagekräftigen Gesamthandelsvolumen auftreten. Ist das gehandelte Gesamtvolumen gering, wird die Linie Actual x Volume um den Nullpunkt herum komprimiert. Die Berechnung des CVD Actual ist ein wenig anders, auf Candlestick-Zeitschlitz und dann summiert, um falsche Richtungen zu vermeiden, die bei sehr hohen gehandelten Volumina auftreten können.
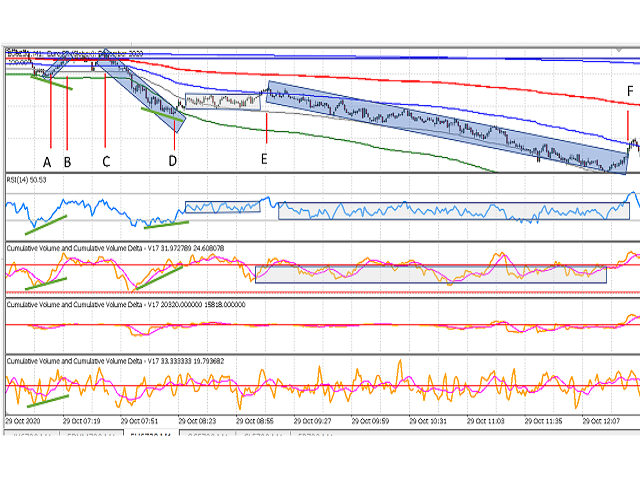
Wichtiger Hinweis:Der Händler verwendet diese Indikatoren auf eigene Verantwortung, da er weiß, dass die folgenden Beobachtungen nicht immer wahr sein können. Die folgenden Beobachtungen sollen lediglich als Anregung für jeden Händler dienen, seine eigene Art der Nutzung von CV & CVD zu erforschen. Die Händler sind eingeladen, ihre Erfahrungen bei der Verwendung dieser Indikatoren mitzuteilen, um das Wissen der gesamten Händlergemeinschaft zu erweitern.