RaptorT Cumulative and Cumulative Volume Delta
- Indicadores
- Versión: 1.1
- Actualizado: 12 noviembre 2020
- Activaciones: 5
RaptorT: Volumen Acumulado y Delta de Volumen Acumulado (Presión de Compra Venta)
Introducción
RaptorT CV & CVD (CVD es también conocido como Presión de Compra/Venta o Presión de Libro) ofrece dos indicadores básicos y significativos para el trading teniendo los volúmenes como índice principal y peso del interés del mercado. Ofrece buenas perspectivas en combinación con la línea VWAP y sus cuatro desviaciones estándar superior e inferior, desarrollando el PVP (Peak Volume Price, el equivalente al POC para el antiguo Market Profile), Volume Profile y Volume Profile Delta así como el RSI y MACD estándar para la identificación de divergencias, áreas de sobreventa/sobreventa y otros análisis. RaptorT CV & CVD se calculan a partir de cada tick del periodo de tiempo establecido.
ADVERTENCIA: dado que RaptorT CV & CVD utiliza datos aproximados y el cálculo se basa en la detección y bufferización de cada tick individual y los datos relacionados, el usuario ANTES de descargar e instalar el indicador deberá asegurarse bajo su responsabilidad de que el broker y el alimentador de datos al que está conectado proporciona datos de ticks, dirección (ask/bid) del tick y volúmenes del tick. En caso de no disponer de volúmenes reales el indicador puede trabajar con volúmenes calculados sobre ticks contando como inconveniente típico. Además, si el usuario desea visualizar el indicador en un rango de tiempo pasado con respecto al momento en el que inició la aplicación MT5, por ejemplo las últimas 24 horas, debe asegurarse de que el broker y el alimentador de datos permiten descargar el conjunto completo de datos de ticks pasados.
Características del indicador RaptorT CV & CVD
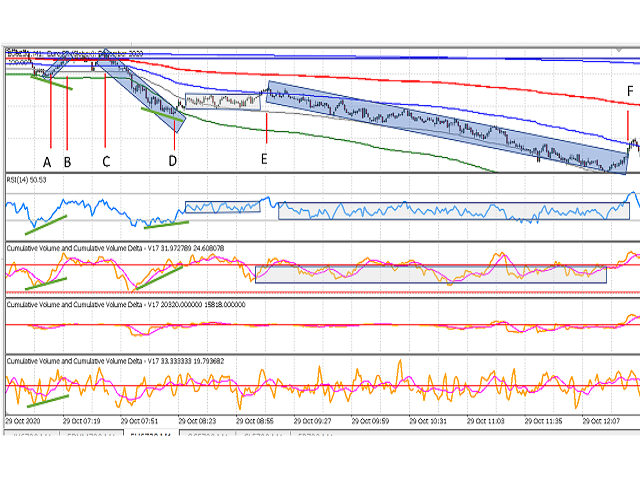
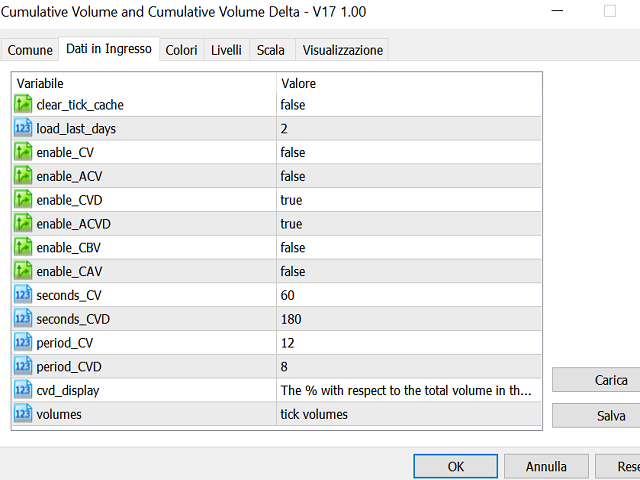
- Volumen Acumulado: la línea está compuesta por puntos que representan la suma de los volúmenes reales o de ticks intercambiados en los últimos N segundos, donde N es un parámetro que el usuario puede establecer libremente. La suma móvil es útil para reducir las variaciones locales en la dimensión temporal y mostrar la tendencia creciente y decreciente de los volúmenes intercambiados. El indicador CV permite también mostrar la media sobre M periodos, donde un periodo es igual al timeframe de la vela seleccionada. Por ejemplo, en M.1 timeframe, un CV con N=180s y con la línea media activada en M=8 mostrará la suma de los volúmenes intercambiados durante los últimos 180s, es decir, 3 velas, y la media de esta línea calculada sobre los últimos 8 puntos de línea igual a los últimos 8 minutos. CV siempre es no negativo; el menor volumen intercambiado es 0.
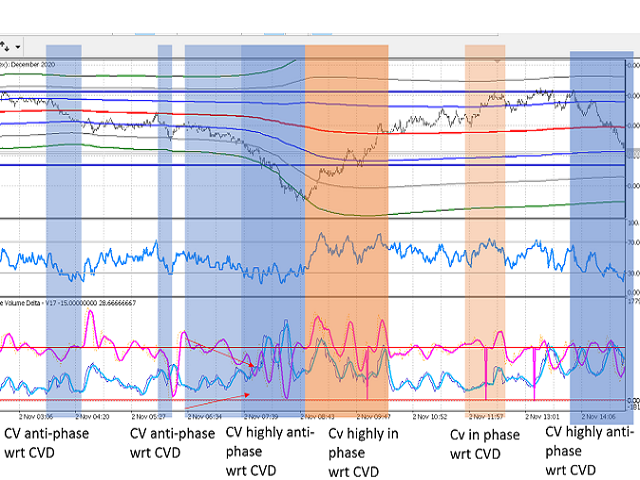
- Delta del Volumen Acumulado: la línea está compuesta por la diferencia de los volúmenes de compra y venta en el periodo considerado. Este indicador tiene signo ya que puede ser negativo o positivo. Como el cálculo considera la suma de los últimos N segundos, no necesariamente igual al CV, lo que importa es la dirección del indicador CVD (creciente o decreciente) más que su signo (negativo o positivo). Obviamente, un signo positivo sobre una tendencia creciente del CVD es una confirmación más de una posible tendencia creciente de los precios, ya que en el mercado hay muchos más vendedores que compradores. Las operaciones unidireccionales (no de compra, no de venta, sino de venta/compra) se helan y se suman a los volúmenes de venta y de compra, de modo que haciendo la diferencia se desprecian. El usuario puede activar la línea media que se calcula de la misma forma que el indicador CV. El usuario puede elegir tres formas de cálculo del indicador CVD
o Real: simplemente la diferencia de volúmenes de compra y venta en el periodo de tiempo considerado.
o Porcentual: la diferencia se divide por el volumen total de y se multiplica por 100. Esto amplifica la tendencia CVD a pesar de los volúmenes totales intercambiados. Las curvas CVD se amplifican.
o Real x Volumen: esta innovadora forma de visualización pone de relieve las tendencias fuertes hacia la dirección de compra o venta cuando se producen en combinación con volúmenes totales negociados significativos. Si el volumen total negociado es bajo, la línea Actual x Volumen se comprime en torno al cero. El cálculo del CVD Actual es un poco diferente, en franja horaria de velas y luego sumado, para superar falsas direcciones que podrían ocurrir con volúmenes negociados muy altos.
Nota importante:el trader utiliza estos indicadores bajo su total responsabilidad sabiendo que las siguientes observaciones podrían no ser siempre ciertas. Las siguientes observaciones sólo pretenden dar un incipit para que cada trader explore su propia forma de uso de CV & CVD. Los traders están invitados a compartir su experiencia en el uso de este indicador para el crecimiento del conocimiento de toda la comunidad de traders.