Setup da Onda
- Indikatoren
- Version: 1.0
- Aktivierungen: 5

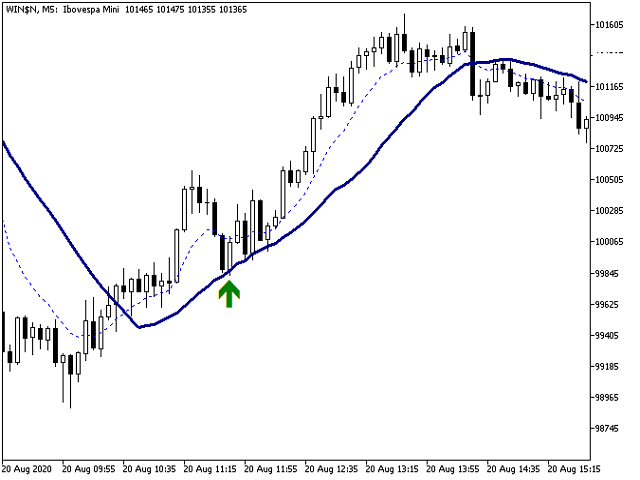
Kauf- und Verkaufssignale auf der Grundlage der Wave Setup-Strategie für den Einstieg in den Handel bei einem Pullback nach einer Umkehrung.
Wie funktioniert der Indikator?
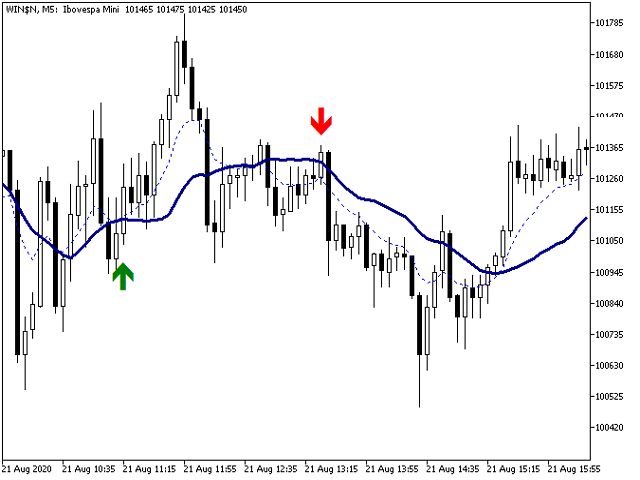
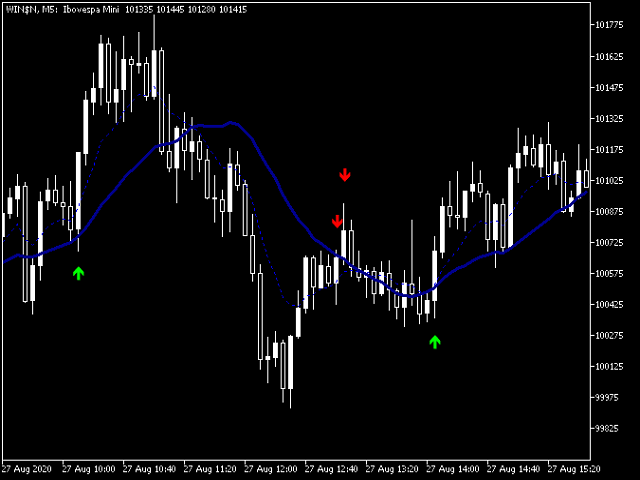
Der Indikator aktiviert das Kauf- und Verkaufssignal, wenn die jeweiligen Bedingungen erfüllt sind.
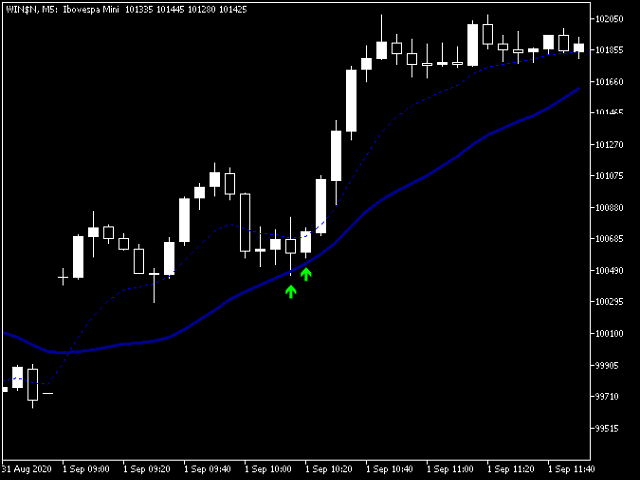
Für einen Aufwärtstrend benötigen wir eine Umkehrung nach oben am EMA9, gefolgt von Kursen über dem aufsteigenden SMA21, die einen Pullback bilden und diesen berühren.
Für einen Abwärtstrend ist eine Umkehrung des EMA9 nach unten erforderlich, gefolgt von einem Pullback der Kurse unter den absteigenden SMA21 und einer Berührung des EMA21.
Wie wird er eingesetzt?
Eröffnen Sie den Handel mit einer Stop-Order, die einen Tick über dem Höchststand der Kerze mit dem Kaufsignal liegt, und platzieren Sie die Stop-Loss-Order einen Tick unter dem Tiefststand der Kerze. Liegt stattdessen ein Verkaufssignal vor, platzieren Sie eine Verkaufs-Stop-Order einen Tick unter dem Tiefpunkt der Kerze mit dem Verkaufssignal und eine Stop-Loss-Order einen Tick über dem Hochpunkt der Kerze.
Wenn die Einstiegs-Stopp-Order bei der nächsten Kerze nicht ausgeführt wird, aber der 21-Perioden-SMA seine Richtung beibehält, ist das Signal weiterhin gültig und der Indikator bestätigt es. Man sollte dann die Einstiegs-Stopp-Order zum Kauf einen Tick über dem neuen Hoch und zum Verkauf einen Tick unter dem neuen Tief positionieren.
Wenn der 21-Perioden-SMA dreht, wird das Einstiegssignal aufgehoben.
Wenn das Signal erfüllt wird, ist das vorgeschlagene Ziel die Amplitude des Einstiegsbalkens, projiziert nach oben für den Kaufhandel und nach unten für den Verkaufshandel.
Tipps:
- Der ideale Pullback wird durch gleichfarbige, starke Balken gebildet.
- Am besten ist es, wenn es keinen Pullback innerhalb des Pullbacks gibt, eine schnelle und direktionale Bewegung.
- Das Signal ist großartig, wenn der Balken, der den SMA berührt, ein Umkehrsignal ist (Hammer/Shooting Star) oder unmittelbar von einem Umkehrmuster gefolgt wird (Engulfing-Muster/Dunkle Wolkendecke/Piercing-Muster).
Hinweis: Das Signal wird während der Bildung der Kerze angezeigt, um Sie auf eine Operation vorzubereiten. Betrachten Sie es jedoch erst als gültig, nachdem die Kerze geschlossen wurde.
Funktionen, die Sie nach Belieben bearbeiten können:
- Perioden des schnellen gleitenden Durchschnitts
- Art des schnellen gleitenden Durchschnitts
- Art des Preises für den schnellen gleitenden Durchschnitt
- Perioden des langsamen gleitenden Durchschnitts
- Art des langsam gleitenden Durchschnitts
- Art des Preises für den langsamen gleitenden Durchschnitt
- Art der Kauf- und Verkaufssignalpfeile, basierend auf der Schriftart Wingdings
- Abstand zwischen den Signalpfeilen und dem Hoch/Tief der Kerze
- Farbe und Größe der Kauf- und Verkaufssignalpfeile
- Farbe, Dicke und Stil des schnellen gleitenden Durchschnitts
- Farbe, Dicke und Stil des langsamen gleitenden Durchschnitts