HiLo Points
- Indikatoren
- Version: 1.3
- Aktualisiert: 14 August 2024
- Aktivierungen: 5

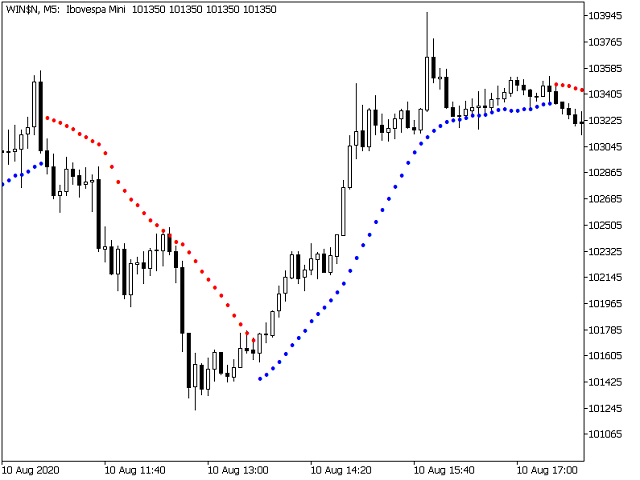
Dieser Indikator basiert auf dem gleitenden Durchschnitt des Hochs und dem gleitenden Durchschnitt des Tiefs zur Trendverfolgung und/oder für Trailing-Stops.
Wie funktioniert der Indikator?
Der Indikator zeichnet die Punkte des Aufwärtstrends ein, bis ein Schlusskurs unter dem gleitenden Durchschnitt der Tiefststände erreicht wird. Ist dies der Fall, beginnt ein Abwärtstrend, der so lange eingezeichnet wird, bis ein Schlusskurs über dem gleitenden Durchschnitt der Höchststände erreicht wird. Ist dies der Fall, beginnt ein neuer Aufwärtstrend. Und so geht es weiter.
Wie wird es angewendet?
- Trendfolge: Sie können es als Kaufsignal verwenden, wenn die Punkte von einem Abwärtstrend in einen Aufwärtstrend übergehen. Und auch als Verkaufssignal, wenn die Punkte von einem Aufwärtstrend zu einem Abwärtstrend wechseln.
- Trailing-Stop: Sie können ihn verwenden, um Ihren Stop-Loss-Auftrag nachzuziehen und Gewinne zu sichern.
Hinweis:
- Verschiedene Perioden des HiLo funktionieren besser bei verschiedenen Paaren/Aktien und Zeitrahmen. Experimentieren Sie und finden Sie heraus, was am besten zu Ihnen passt!
- Der Punkt kann zwischen Aufwärts- und Abwärtstrend wechseln, während der Balken noch offen ist. Ein Signal ist also gültig, sobald der aktuelle Balken schließt und ein neuer Balken geöffnet wird. Damit Trailing-Stops, die auf dem HiLo-Indikator basieren, erst dann ausgelöst werden, wenn sich der Trend ändert, und damit Ihre Gewinne maximiert werden, können Sie den Handel beenden oder Ihre Stop-Loss-Order erst dann nachziehen, wenn ein Balken schließt und die Punkte umkehrt.
Funktionen, die Sie nach Belieben bearbeiten können:
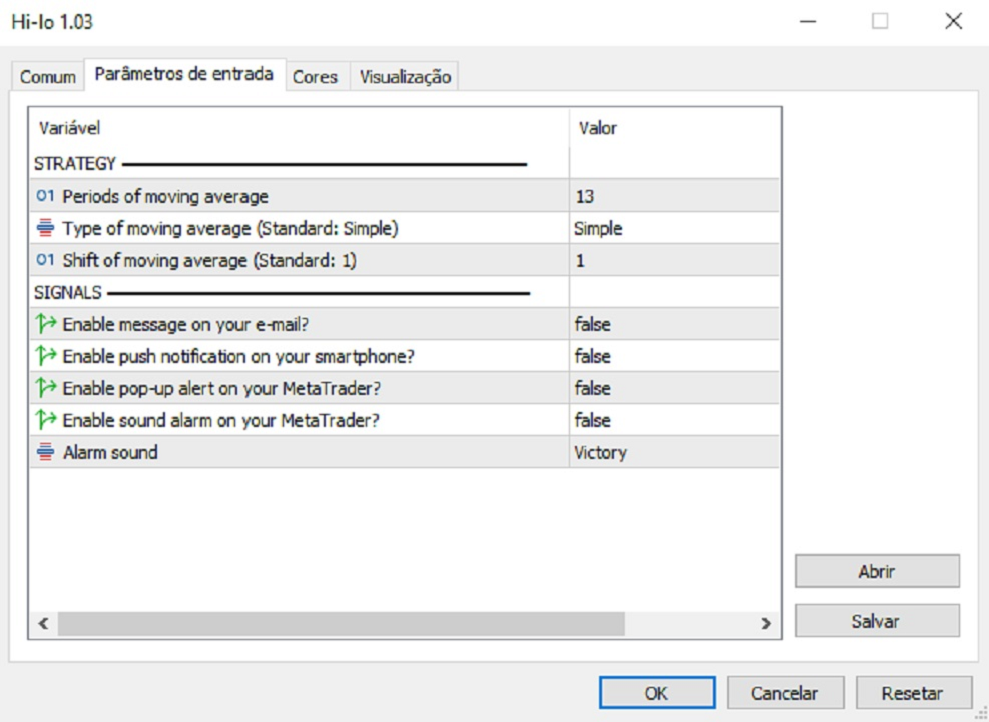
- Zeitraum des gleitenden Durchschnitts für die Höchst- und Tiefstwerte.
- Art des gleitenden Durchschnitts.
- Verschiebung des gleitenden Durchschnitts.
- Farbe und Größe der Punkte für den Aufwärtstrend. - Farbe und Größe der Punkte für den Abwärtstrend.
> NEUE FUNKTIONEN HINZUGEFÜGT:
Sie können jetzt benachrichtigt werden, wenn die Punkte ihre Richtung ändern. Ideal, wenn Sie nicht auf den Chart schauen!
- Aktivieren Sie Push-Benachrichtigungen auf Ihrem Smartphone
- Aktivieren Sie den Pop-up-Alarm auf Ihrem MetaTrader
- Aktivieren Sie den akustischen Alarm auf Ihrem MetaTrader