Setup da Onda
- Indicatori
- Versione: 1.0
- Attivazioni: 5

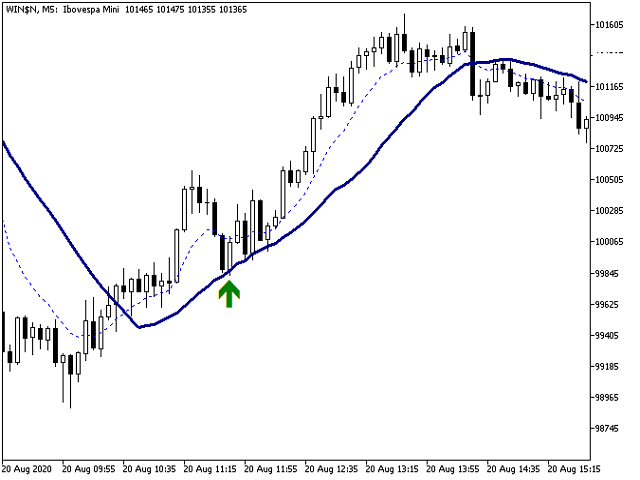
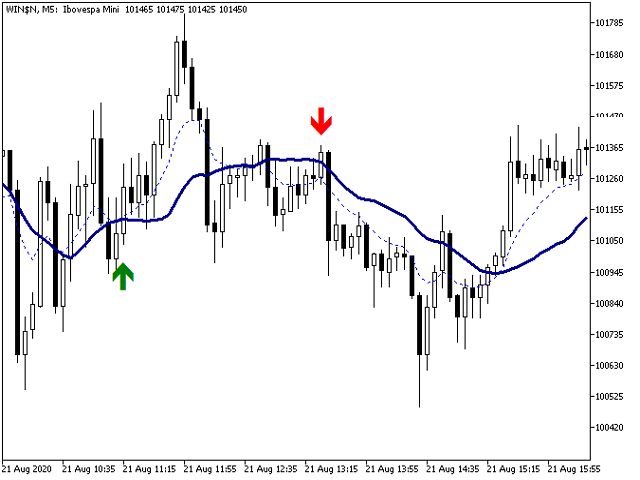
Buy and sell signals based on the Wave Setup strategy for entering a trade on the pullback after a reversal.
How does the indicator work?
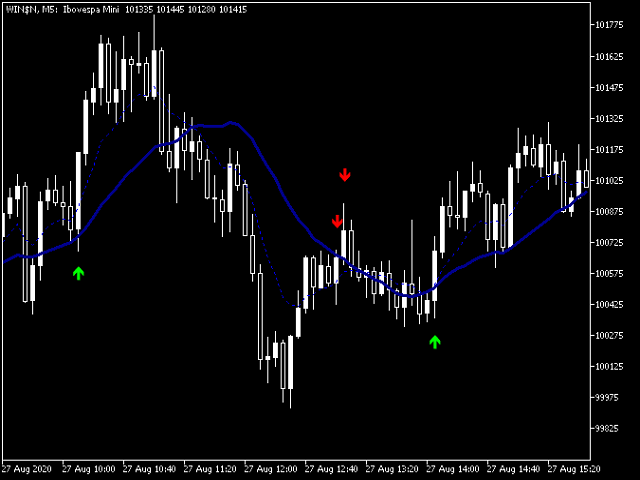
The indicator activates the buy and sell signal when their respective conditions are met.
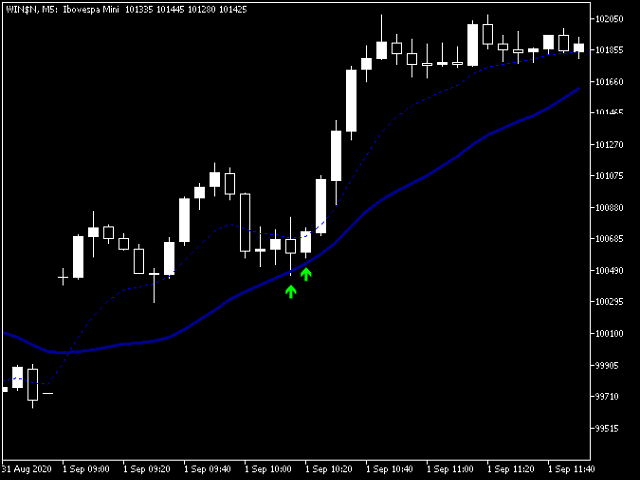
For an uptrend, we need a reversal up on the EMA9 followed by prices above the ascending SMA21 making a pullback and a touch on it.
For a downtrend, we need a reversal down on the EMA9 followed by prices below the descending SMA21 making a pullback and a touch on it.
How to use it?
Enter the trade with a buy stop order one tick above the high of the candle with the buy signal, placing the stop loss order one tick below the candle's low. When there's a sell signal instead, place a sell stop order one tick below the low of the candle with the sell signal, and a stop loss one tick above the candle's high.
If the entry stop order is not filled on the next candle but the 21 period SMA maintained its direction, the signal is still valid and the indicator will confirm it. One should then reposition the entry stop order one tick above the new high for buying and one tick below the new low for selling.
If the 21 period SMA turns, the entry signal is cancelled.
If filled, the suggested target is the entry bar's amplitude projected up for the buying trade and projected down for the selling trade.
Tips:
- The ideal pullback is made by same color strong bars.
- It is best if there is no pullback inside the pullback, a fast and directional movement.
- The signal is great when the bar that touches the SMA is a reversal one (hammer/shooting star) or immediatelly followed by a reversal pattern (engulfing pattern/dark cloud cover/piercing pattern).
Notice: the signal is shown during the candle's formation to prepare you for an operation. But consider it valid only after the candle has closed.
Features you can edit to your preference:
- Periods of the fast moving average
- Type of the fast moving average
- Type of price for the fast moving average
- Periods of the slow moving average
- Type of the slow moving average
- Type of price for the slow moving average
- Type of the Buy and Sell signal arrows, based on the Wingdings font
- Distance between the arrow signals and the candle's high/low
- Color and size of the Buy and Sell signal arrows
- Color, thickness and style of the fast moving average
- Color, thickness and style of the slow moving average