Setup da Onda
- Indicadores
- Versión: 1.0
- Activaciones: 5

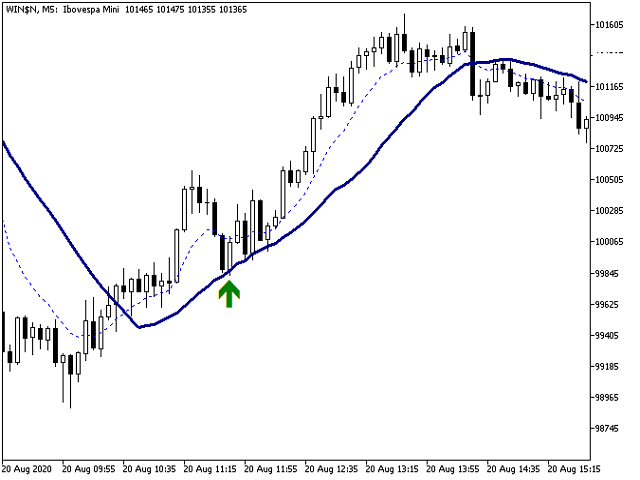
Señales de compra y venta basadas en la estrategia Wave Setup para entrar en una operación en el retroceso tras una inversión.
¿Cómo funciona el indicador?
El indicador activa la señal de compra y venta cuando se cumplen sus respectivas condiciones.
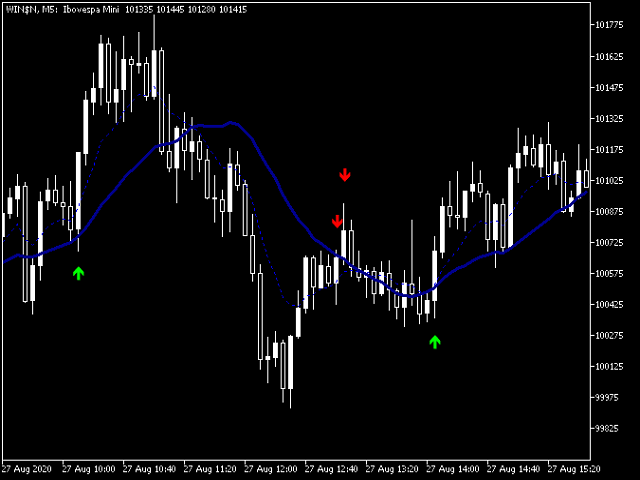
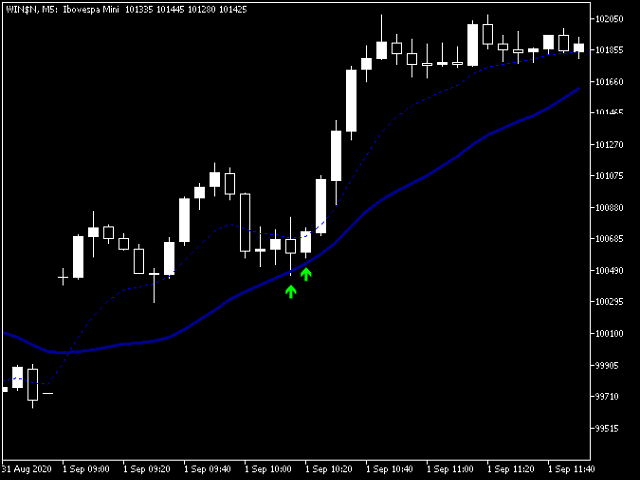
Para una tendencia alcista, necesitamos una reversión al alza en la EMA9 seguida de precios por encima de la SMA21 ascendente haciendo un pullback y un toque en ella.
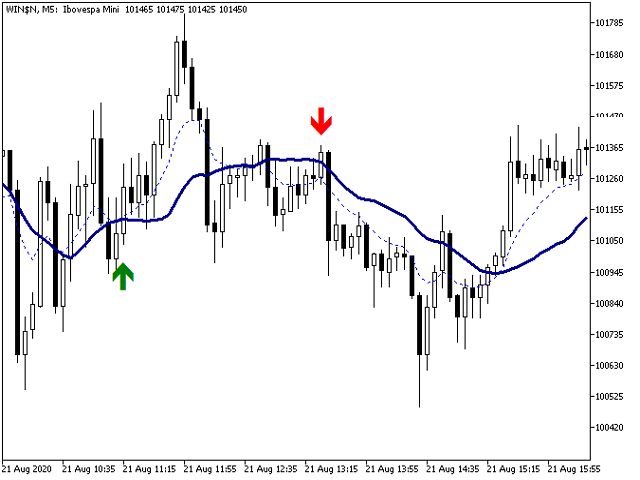
Para una tendencia bajista, necesitamos una reversión a la baja en la EMA9 seguida de precios por debajo de la SMA21 descendente haciendo un pullback y un toque en ella.
¿Cómo utilizarlo?
Entre en la operación con una orden stop de compra un tick por encima del máximo de la vela con señal de compra, colocando la orden stop de pérdida un tick por debajo del mínimo de la vela. Cuando haya una señal de venta, coloque una orden stop de venta un tick por debajo del mínimo de la vela con señal de venta y una orden stop de pérdidas un tick por encima del máximo de la vela.
Si la orden de stop de entrada no se ejecuta en la vela siguiente pero la SMA de 21 periodos mantiene su dirección, la señal sigue siendo válida y el indicador la confirmará. A continuación, debe reposicionar la orden stop de entrada un tick por encima del nuevo máximo para comprar y un tick por debajo del nuevo mínimo para vender.
Si la SMA de 21 periodos gira, la señal de entrada se cancela.
Si se cumple, el objetivo sugerido es la amplitud de la barra de entrada proyectada al alza para la operación de compra y proyectada a la baja para la operación de venta.
Consejos:
- El pullback ideal se hace con barras fuertes del mismo color.
- Es mejor si no hay pullback dentro del pullback, un movimiento rápido y direccional.
- La señal es buena cuando la barra que toca la SMA es de inversión (martillo/estrella fugaz) o seguida inmediatamente por un patrón de inversión (patrón envolvente/cubierta de nubes oscuras/piercing).
Aviso: la señal se muestra durante la formación de la vela para prepararle para una operación. Pero considérela válida sólo después del cierre de la vela.
Características que puede editar a su gusto:
- Periodos de la media móvil rápida
- Tipo de la media móvil rápida
- Tipo de precio para la media móvil rápida
- Periodos de la media móvil lenta
- Tipo de media móvil lenta
- Tipo de precio de la media móvil lenta
- Tipo de las flechas de señal de compra y venta, según la fuente Wingdings
- Distancia entre las señales de flecha y el máximo/mínimo de la vela
- Color y tamaño de las flechas de señal de Compra y Venta
- Color, grosor y estilo de la media móvil rápida
- Color, grosor y estilo de la media móvil lenta