Setup 92 Larry Williams
- Indikatoren
- Version: 1.1
- Aktualisiert: 12 Mai 2021
- Aktivierungen: 5

Kauf- und Verkaufssignale basierend auf der Strategie des exponentiellen gleitenden Durchschnitts von Larry Williams, Setup 9.2 für die Trendfortsetzung.
Wie funktioniert es?
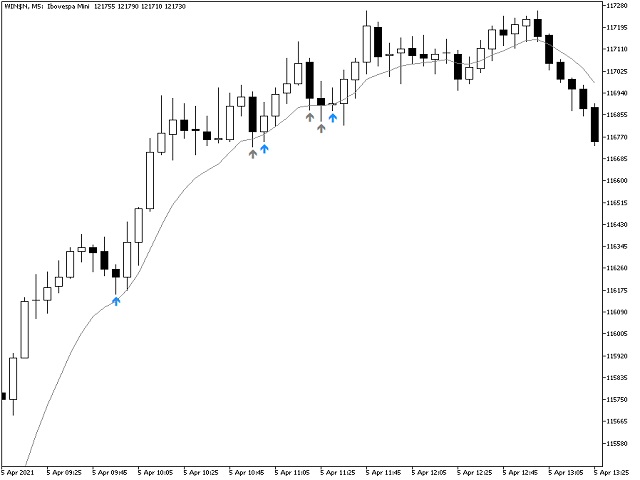
Der Indikator aktiviert das Kaufsignal, wenn eine Kerze unter dem vorherigen Tiefpunkt schließt und dabei die 9-Perioden-EMAs nach oben hält.
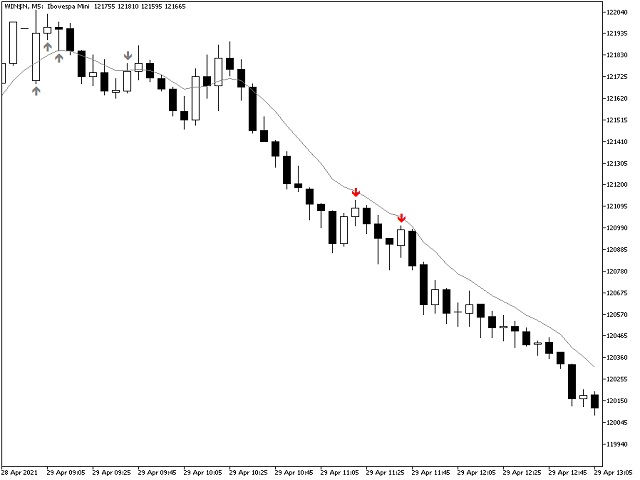
Für ein Verkaufssignal benötigen wir eine Kerze, die über dem vorherigen Hoch schließt, während die 9-Perioden-EMAs nach unten gerichtet bleiben.
Wie wird es verwendet?
Eine von Larry Williams vorgeschlagene Methode besteht darin, einen Handel mit einem Kauf-Stopp-Auftrag einzugehen, der einen Tick über dem Hoch der Kerze mit dem Kaufsignal liegt, und den Stop-Loss-Auftrag einen Tick unter dem Tief der Kerze zu platzieren. Liegt stattdessen ein Verkaufssignal vor, platzieren Sie eine Verkaufs-Stopp-Order einen Tick unter dem Tiefpunkt der Kerze mit dem Verkaufssignal und eine Stop-Loss-Order einen Tick über dem Hochpunkt der Kerze.
Wenn die Einstiegs-Stopp-Order bei der nächsten Kerze nicht ausgeführt wird, aber der 9-Perioden-EMA seine Richtung beibehält, ist das Signal weiterhin gültig und der Indikator bestätigt es. Man sollte dann die Einstiegs-Stopp-Order zum Kauf einen Tick über dem neuen Hoch und zum Verkauf einen Tick unter dem neuen Tief positionieren.
Wenn sich der 9-Perioden-EMA dreht, wird das Einstiegssignal aufgehoben.
Ist das Signal erfüllt, ändert der Pfeil seine Farbe, und es ist möglich, den Stop-Loss-Auftrag auf der Grundlage des 9-Perioden-EMA nachzuziehen und aus dem Handel auszusteigen, wenn er sich dreht.
Tipp:
Ideal für den Einstieg in einen Trend. Sie können einen Einstieg vermeiden, wenn ein gleitender Durchschnitt mit längerer Periode (z. B. 50) vor der Bewegung liegt oder Anzeichen einer Erschöpfung zeigt.
Vorteile:
- Wiederholt Einstiegssignale, solange sie gültig bleiben.
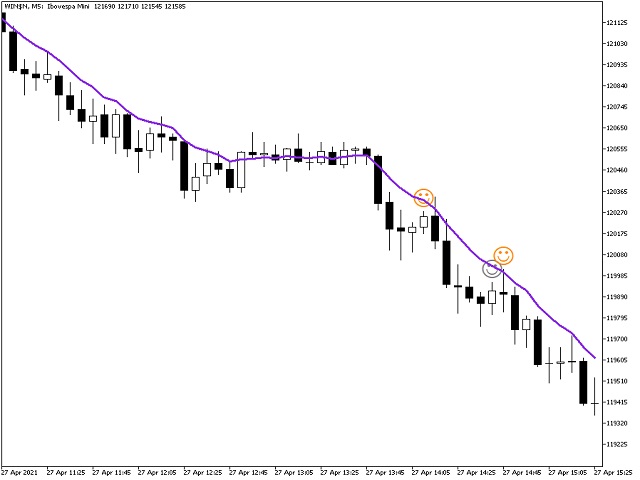
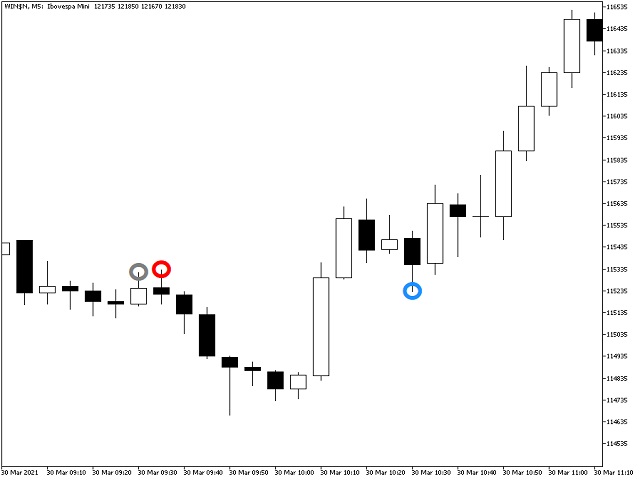
- Erlaubt verschiedene Farben für aktivierte Signale, so dass Sie die Strategie anhand vergangener Kurse visuell analysieren können.
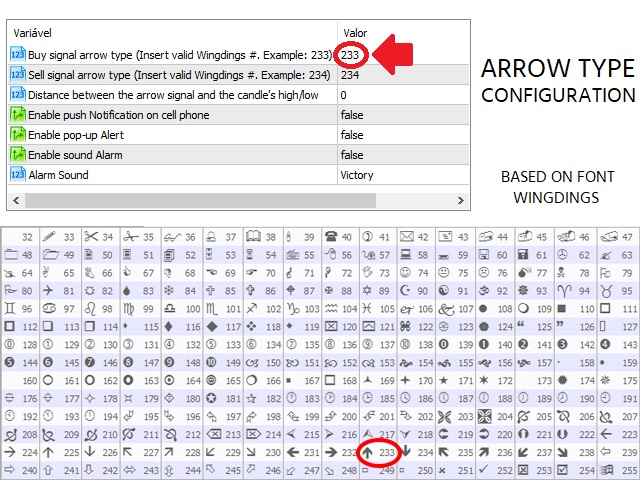
- Ermöglicht es Ihnen, die Art des Pfeils zu ändern, damit Sie ihn nicht mit anderen bereits verwendeten Indikatoren verwechseln.
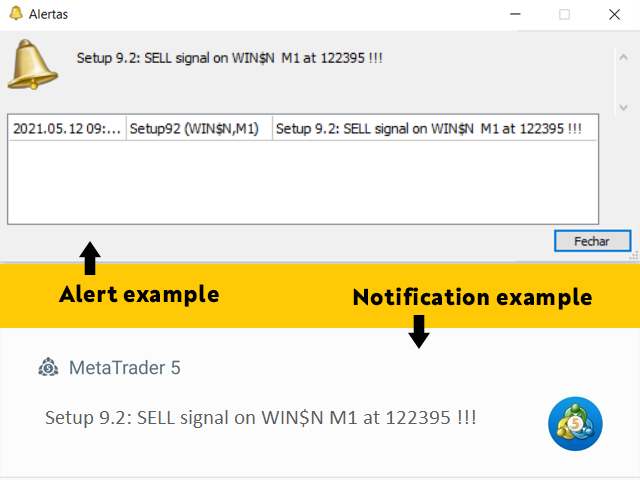
- Kann einen Alarm auslösen, um Sie darauf aufmerksam zu machen, wenn ein Einstiegssignal vorliegt.
- Kann einen Alarm auf der Plattform auslösen, um Sie zu informieren, wenn es ein Einstiegssignal gibt.
- Kann eine Push-Benachrichtigung an Ihr Smartphone senden, wenn es ein Einfahrtssignal gibt.
Funktionen, die Sie nach Ihren Wünschen bearbeiten können:
- Abstand zwischen den Pfeilsignalen und dem Hoch/Tief der Kerze
- Art der Kauf- und Verkaufssignalpfeile, basierend auf der Schriftart Wingdings
- Farbe und Größe der Kauf- und Verkaufssignalpfeile
- Farbe, Dicke und Stil des exponentiellen gleitenden Durchschnitts
- Aktivieren von Push-Benachrichtigungen
- Pop-up-Benachrichtigungen aktivieren
- Aktivieren von akustischen Alarmen
- Klang des Alarms
Wer ist der Schöpfer?
Larry Williams ist ein amerikanischer Aktien- und Rohstoffhändler, Autor von 11 Büchern und Schöpfer von Indikatoren wie dem "Williams%R" und dem "Ultimate Oscillator", mit über 60 Jahren Handelserfahrung.
Er gewann 1987 die Weltmeisterschaft im Futures-Handel, indem er innerhalb von 12 Monaten mit echtem Geld 10.000 Dollar in über 1.100.000 Dollar verwandelte. Zehn Jahre später gewann seine Tochter Michelle Williams denselben Wettbewerb.
Stichworte: Setup 9.2, Setup Larry Williams, Palex, MOL, Lorenz, Ogro, RM.