Round levels scanner MT5
- Indikatoren
-
Jan Flodin
 Hello, my name is Jan and I have been developing automated trading tools for the last 9 years. I am originally from Sweden but have lived in the Czech Republic since 2003.
PRODUCTS - Version: 1.3
- Aktualisiert: 10 November 2020
- Aktivierungen: 10
Dieser Multi-Symbol-Indikator wurde entwickelt, um automatisch zu erkennen, wann der Preis wichtige psychologische Niveaus erreicht. Auch bekannt als runde Zahlen, ganze Zahlen oder Schlüsselniveaus. Als Bonus kann er auch nach Pivot-Punkt-Niveaus auf einem ausgewählten Zeitrahmen suchen. In Kombination mit Ihren eigenen Regeln und Techniken können Sie mit diesem Indikator Ihr eigenes leistungsstarkes System erstellen (oder verbessern).
Merkmale
- Kann die Signale in eine Datei schreiben, die von einem Expert Advisor für den automatischen Handel verwendet werden kann.
- Sie können alle Symbole, die in Ihrem Market Watch-Fenster sichtbar sind, zur gleichen Zeit überwachen. Wenden Sie den Indikator auf nur ein Diagramm an und überwachen Sie sofort den gesamten Markt.
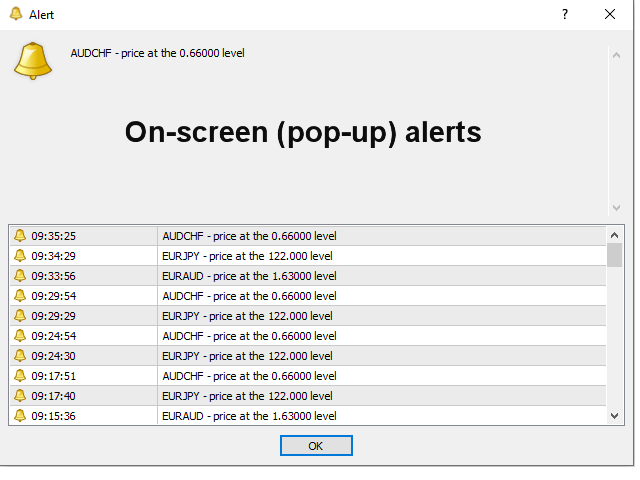
- Sendet Ihnen einen Echtzeit-Alarm, wenn der Preis ein rundes Niveau erreicht hat. Alle Metatrader-eigenen Alarmtypen werden unterstützt.
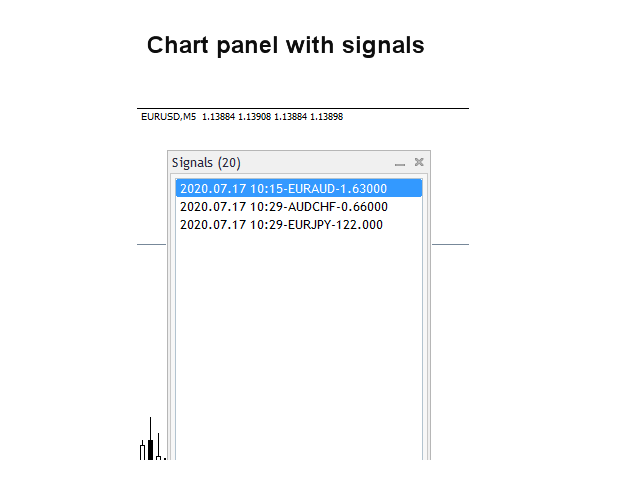
- Der Indikator enthält ein Chart-Panel zum Speichern der Signale.
Eingabe-Parameter
Die Beschreibung und Erklärung der Eingabeparameter finden Sie hier.
Wichtig
Es ist sehr ratsam, den Indikator auf einen sauberen Chart zu legen, auf dem sich keine anderen Indikatoren oder Expert Advisors befinden, die den Scanner stören könnten. Bitte beachten Sie, dass aufgrund der Multifunktionalität weder Kauf-/Verkaufsempfehlungen noch Linien und Pfeile auf dem Chart eingezeichnet werden, auf dem der Indikator installiert ist. Die runde, waagerechte Linie wird auf dem Chart gezeichnet, der geöffnet wird, wenn Sie auf ein Signal im Panel klicken.