Fourteen plus nine TD Sequential
- Indicadores
- Versión: 1.0
- Activaciones: 20
Catorce más nueve
¿Para qué sirve?
Aplicar el TD Secuencial de Tom DeMark sirve para identificar un punto de precio en el que una tendencia alcista o bajista se agota y se invierte.
.
¿Cuáles son los principales componentes del TD Sequential?
TD Sequential tiene dos partes - TD Setup y TD Countdown. La primera fase de TD Sequential comienza con un TD Setup y se completa con un 9 count. Cuando la cuenta de 9 se completa, es en ese punto, una pausa de precios, retroceso de precios, o inversión es probable. También es en ese punto donde TD Sequential comienza la segunda fase con TD Countdown y se completa con un recuento 13. Cuando se registra la cuenta de 13, es probable que se produzca una pausa en el precio, un retroceso o una inversión.
.
Sólo 9 y 13. ¿Es realmente tan simple?
En absoluto. Otros indicadores DeMark y otros indicadores de análisis técnico deben alinearse con la capacidad de TD Sequential para señalar posibles retrocesos. Por ejemplo, si un indicador líder identifica una condición para una reversión del mercado es probable en un futuro próximo, el trabajo de TD Secuencial es proporcionar el "cuándo" para la reversión es probable que tenga lugar .
.
¿Qué es TD Buy Setup, TD Sell Setup, TD Buy Countdown y TD Sell Countdown?
TD Buy Setup es el nombre para un TD Setup cuando los recuentos DeMark se registran cuando los precios están tendiendo a la baja. Por el contrario, TD Sell Setup es el nombre para un TD Setup cuando los recuentos DeMark se registran cuando los precios tienden a subir. Lo mismo ocurre con TD Countdown. Una cuenta regresiva de compra de TD es el nombre de una cuenta regresiva de TD cuando los recuentos de DeMark se registran cuando los precios tienden a la baja y una cuenta regresiva de venta de TD es el nombre de una cuenta regresiva de TD cuando los recuentos de DeMark tienden al alza.
.
¿Son flexibles las reglas del TD Secuencial?
Sí. Hay muchas variaciones flotando por ahí y se puede experimentar con modificaciones y filtros.
.
A continuación se presentan cuatro ejemplos visuales en la descripción de los componentes de TD Secuencial.
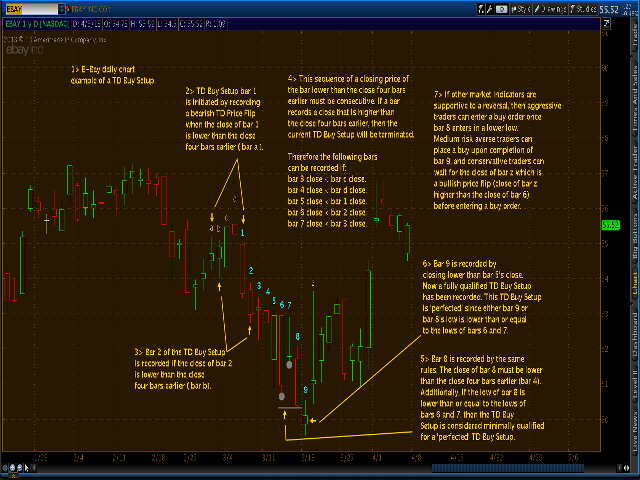
TD Buy Setup para Ebay (EBAY )
TD Cuenta atrás de compra para Zynga (ZNGA )
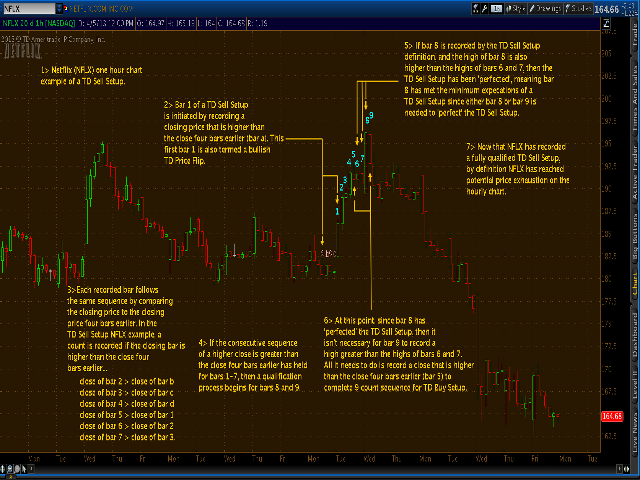
TD Sell Setup para Netflix (NFLX )
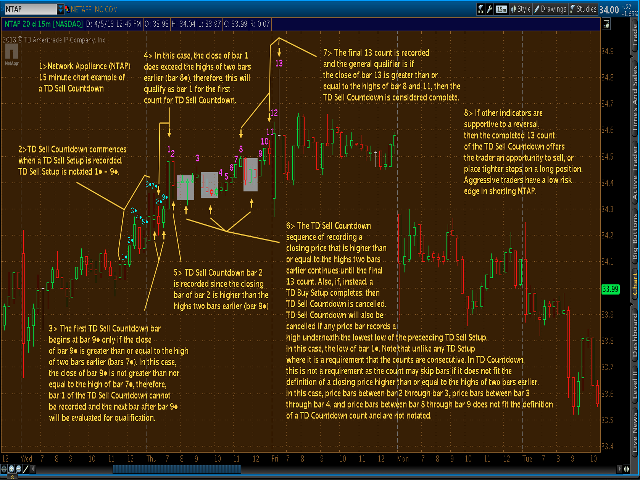
TD Sell Countdown para Network Appliance (NTAP )
La explicación escrita de cada ejemplo está numerada por orden.