TRIXe
- Indikatoren
- Version: 1.0

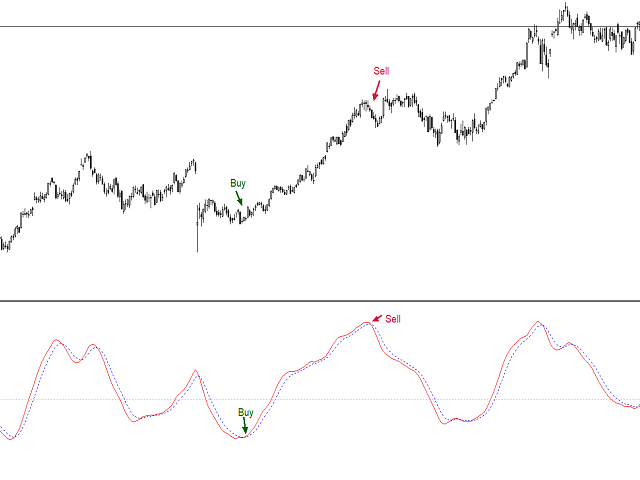
Der TRIXe-Indikator ist die Kombination des TRIX-Indikators (Triple Exponential Moving Average) mit einem zusätzlichen EMA-Signal (Exponential Moving Average). Er liefert Anzeichen für Trendkontinuität und den Beginn eines neuen Trends.
Die Ein- und Ausstiegspunkte der Operationen ergeben sich, wenn sich die Kurven des Indikators kreuzen.
Die Leistung des Indikators ist besser, wenn er mit anderen Indikatoren kombiniert wird.


Gostei muito! Estou usando e dando certo! Parabéns e mais sucesso ao desenvolvedor!