VWAP Stdev Bands
- Indikatoren
- Version: 2.30
- Aktualisiert: 10 März 2020
- Aktivierungen: 5

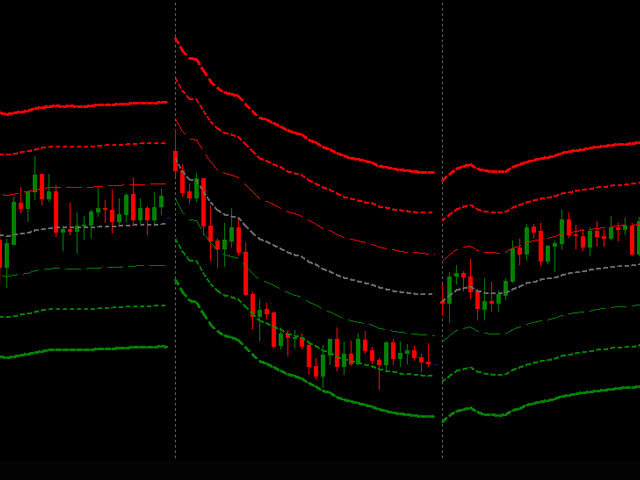
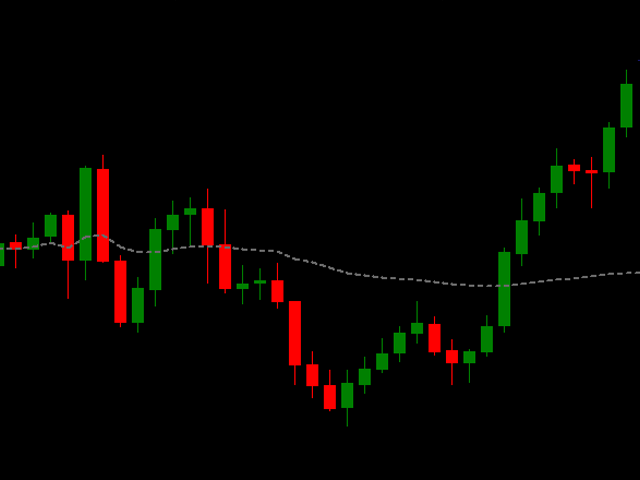
Dieser Indikator stellt den VWAP mit 4 Standardabweichungsbändern dar .
Im Finanzwesen ist der volumengewichtete Durchschnittspreis (VWAP) das Verhältnis zwischen dem gehandelten Wert und dem Gesamtvolumen, das über einen bestimmten Zeithorizont (in der Regel ein Tag) gehandelt wird. Er ist ein Maß für den Durchschnittspreis, zu dem eine Aktie über den Handelshorizont gehandelt wird.
Der VWAP wird häufig von Anlegern, die bei der Ausführung ihrer Aufträge möglichst passiv sein wollen, als Benchmark verwendet. Viele Pensionsfonds und einige Investmentfonds fallen in diese Kategorie. Mit der Verwendung eines VWAP-Handelsziels soll sichergestellt werden, dass der Händler den Auftrag im Einklang mit dem Marktvolumen ausführt. Manchmal wird argumentiert, dass eine solche Ausführung die Transaktionskosten senkt, indem sie die Marktbeeinflussungskosten (die zusätzlichen Kosten aufgrund der Marktbeeinflussung, d. h. die negativen Auswirkungen der Aktivitäten eines Händlers auf den Preis eines Wertpapiers) minimiert.
VWAP wird häufig im algorithmischen Handel verwendet. Handelsalgorithmen, die VWAP als Ziel verwenden, gehören zu einer Klasse von Algorithmen, die als Volumenbeteiligungsalgorithmen bekannt sind.
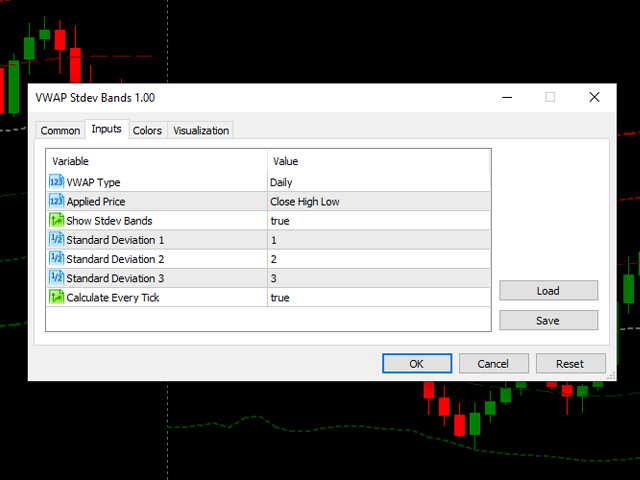
Parameter:
- VWAP Typ:
- Täglich
- Wöchentlich
- Monatlich
- Angewandter Preis:
- Eröffnet
- Schließen
- Hoch
- Tief
- Öffnen Schließen
- Hoch Tief
- Schließen Hoch Niedrig
- Öffnen Schließen Hoch Tief
- Stdev-Bänder anzeigen
- Standardabweichung 1
- Standardabweichung 2
- Standardabweichung 3
- Standardabweichung 4
- Berechnen jedes Ticks
ACHTUNG! Für die Verwendung in Expert Advisors:
Puffer Index:
- VWAP = 0
- Oberes Band 4 = 2
- Oberes Band 3 = 4
- Oberes Band 2 = 6
- Oberes Band 1 = 8
- Unteres Band 1 = 10
- Unteres Band 2 = 12
- Unteres Band 3 = 14
- Unteres Band 4 = 16


Doesn't show deviation of bands as it describes. Dont buy