Price Channel and Bollinger Bands
- Indikatoren
- Version: 1.0
- Aktivierungen: 5

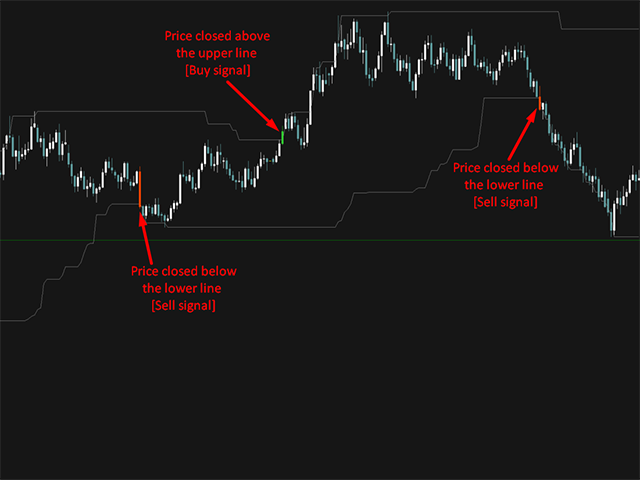
Preiskanal
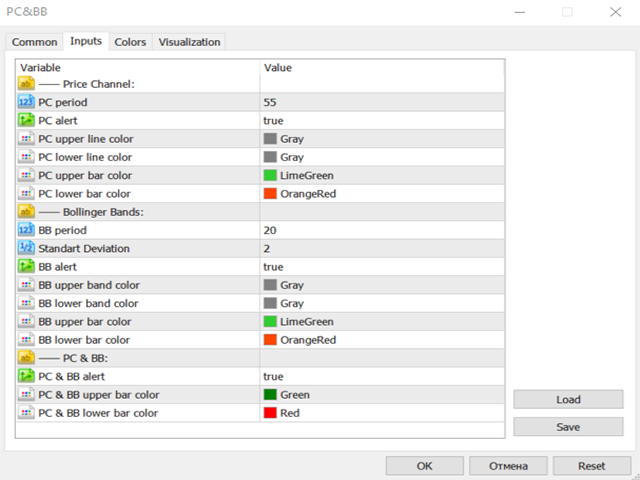
Dieser Indikator ist den Lesern und Anhängern der "Schildkröten"-Strategie weithin bekannt. Er wird durch eine Linie auf dem unteren/oberen Preispunkt für ein bestimmtes Zeitintervall angezeigt. Der Preiskanalwert wird auch zur Bestimmung von Unterstützungs- und Widerstandszonen verwendet. Wenn die Kurse eines Vermögenswerts den Kanal durchbrechen und unter/über ihm schließen, ist dies ein Signal, auf den Zusammenbruch hinzuarbeiten.
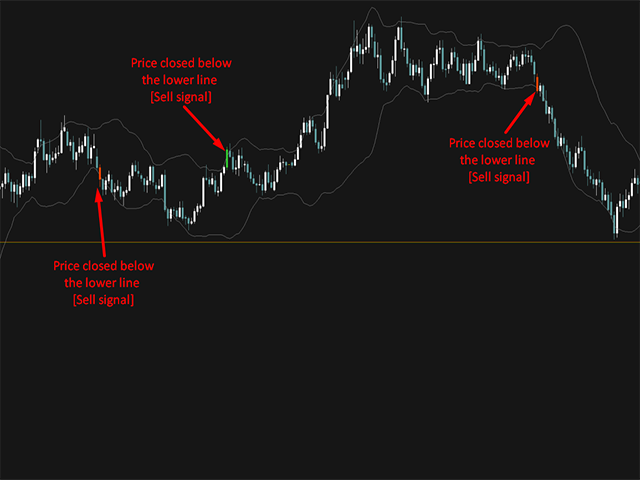
Bollinger-Bänder
Die Bollinger-Bänder werden klassischerweise durch zwei Linien dargestellt, die die Abweichung der Notierungen vom MA 20 anzeigen. Zu diesem Zweck wird die Standardabweichung verwendet, deren Parameter die Dynamik der beiden Bänder bestimmt. Da der Indikator den Moment erhöhter Volatilität auf dem Markt anzeigt, deutet das Schließen der Notierungen hinter den Bändern auf die impulsive Marktrichtung oder den Ausstieg aus der Long-Pro-Trading-Zone hin. Die Arbeit mit dem Breakout ermöglicht es Ihnen also, im Moment der Abweichung der Kursdynamik von der normativen Bewegung einzusteigen, was darauf hindeuten kann, dass Sie eine Position gleich zu Beginn eines neuen Trends eingehen.
Preiskanal und Bollinger Bänder
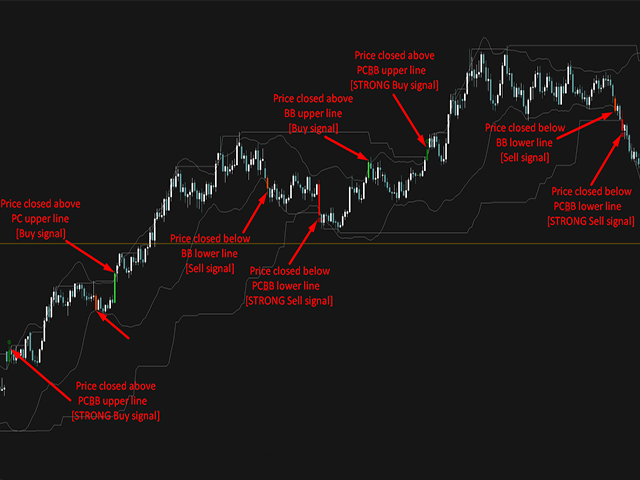
Die Kombination dieser beiden Techniken ermöglicht es, die Qualität der Vorhersage zu erhöhen, denn wenn die Kurse oberhalb des Preiskanals und der Bollinger-Bänder schließen, deutet dies auf den Durchbruch des lokalen Schlüsselniveaus zum Zeitpunkt erhöhter Volatilität hin, was zusätzlich die impulsive Bewegung in Richtung des Durchbruchs bestätigt. Somit ist die Bildung des PC&BB-Signals der günstigste Zeitpunkt, um eine Position einzugehen.
Handelssignale des Indikators:
(1) Der Indikator berücksichtigt alle klassischen Signale dieser technischen Systeme;
2. das Preiskanalsignal: zeigt ein Handelssignal für einen Durchbruch des Preiskanals mit einer bestimmten Periode an. Der Durchbruch des Kanals zeigt eine Trendänderung an.
3. das Bollinger-Bänder-Signal: Dieses Handelssignal zeigt einen Durchbruch der Bänder an. Ein Durchbruch der Bänder deutet auf eine große Preisabweichung und eine impulsive Trendrichtung hin.
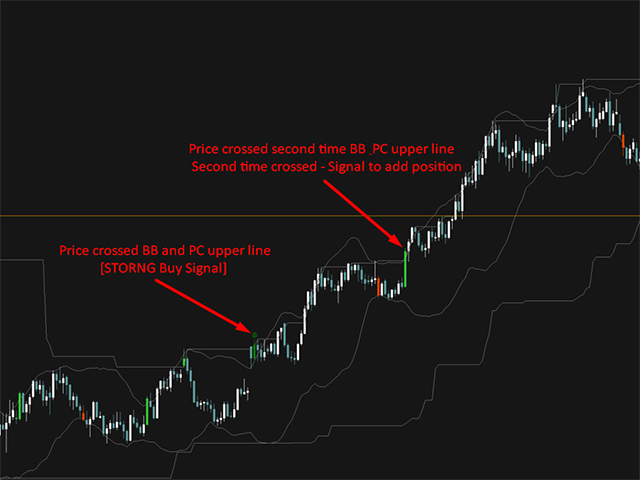
4. PC&BB-Signal: zeigt den gleichzeitigen Zusammenbruch sowohl des Preiskanals als auch der Bänder an. Wenn die Kerze oberhalb der PC- und BB-Linien geschlossen hat, wird ein spezielles Signal gebildet, das mit einer bestimmten Farbe und einem grafischen Marker hervorgehoben wird. Dieses Signal zeigt eine Trendänderung im Moment der impulsiven Abweichung an, die die Fortsetzung der Bewegung in Richtung des Durchbruchs anzeigt.
Möglichkeiten der Anwendung:
Der Indikator ist autark und benötigt keine zusätzlichen Filter, um seine Arbeit aufzunehmen. Ich empfehle die Eröffnung von Handelspositionen bei der nächsten Kerze nach dem Zusammenbruch (nachdem das Signal gebildet wurde). Das Stop-Loss-Niveau ist das umgekehrte Signal des Indikators. Das heißt, das Signal gehört zu der Kategorie der umgekehrten Signale.
Tipp: