Price Channel and Bollinger Bands
- Indicadores
- Versión: 1.0
- Activaciones: 5

Canal de precios
Este indicador es ampliamente conocido por los lectores y aficionados a la estrategia "tortuga". Se muestra mediante una línea en el punto inferior/superior del precio para un intervalo de tiempo determinado. El valor del canal de precios también se utiliza para determinar las zonas de soporte y resistencia. Si las cotizaciones de los activos rompen y cierran por debajo/por encima del canal, es una señal para trabajar hacia la ruptura.
Bandas de Bollinger
Se visualiza clásicamente mediante dos líneas que muestran la desviación de las cotizaciones respecto a la MA 20. Para ello se utiliza la desviación estándar, cuyo parámetro establece realmente la dinámica de las dos bandas. Dado que el indicador muestra el momento de mayor volatilidad en el mercado, el cierre de las cotizaciones por detrás de las bandas indica el impulso de dirección del mercado o la salida de la zona de pro-operaciones largas. Por lo tanto, el trabajo en la ruptura le permite entrar en el momento de la desviación de la dinámica de las cotizaciones del movimiento normativo, lo que puede indicar entrar en una posición en el comienzo de una nueva tendencia.
Canal de Precios y Bandas de Bollinger
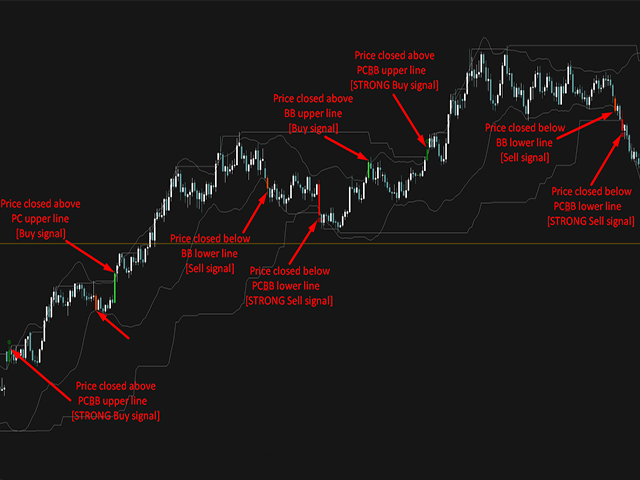
La combinación de estas dos técnicas permite aumentar la calidad de la previsión, ya que si las cotizaciones cierran por encima del canal de precios y las Bandas de Bollinger, indicará la ruptura del nivel local clave en el momento de aumento de la volatilidad, lo que además confirma el movimiento impulsivo en la dirección de la ruptura. Por lo tanto, la formación de la señal PC&BB es el momento más favorable para entrar en una posición.
Señales de trading del indicador:
1. El indicador tiene en cuenta todas las señales clásicas de estos sistemas técnicos;
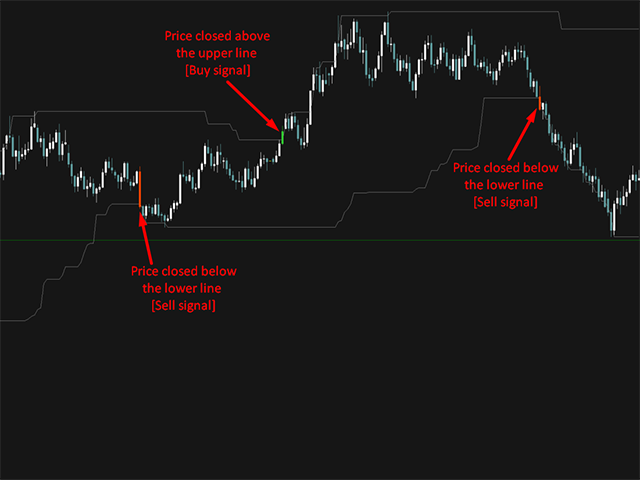
2. Señal del canal de precios: muestra una señal de negociación para una ruptura del canal de precios con un período especificado. La ruptura del canal indica un cambio de tendencia.
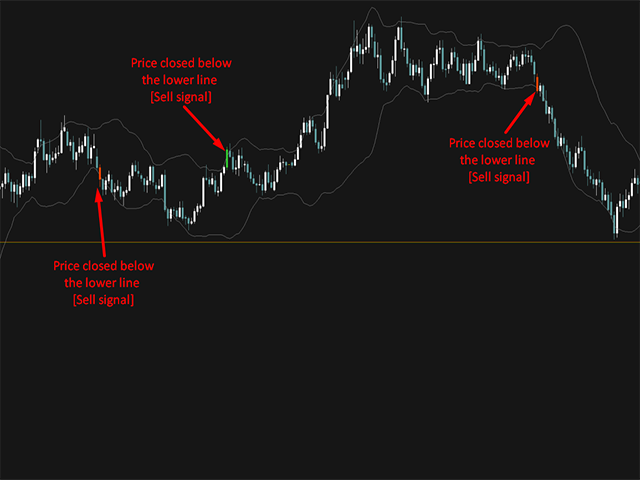
3. Señal de las Bandas de Bollinger: esta señal de negociación indica una ruptura de las bandas. Una ruptura de las bandas indica una gran desviación del precio y una dirección impulsiva de la tendencia.
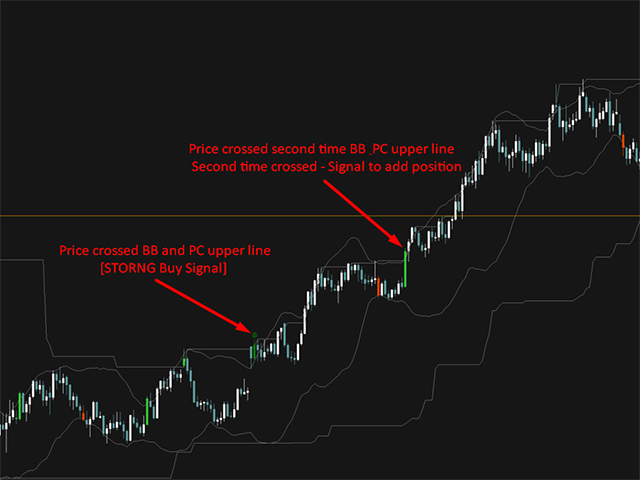
4. Señal PC&BB: muestra la ruptura simultánea del canal de precios y de las bandas. Si la vela cierra por encima de las líneas PC y BB - se forma una señal especial, que se resalta con un color específico y un marcador gráfico. Esta señal indica un cambio de tendencia en el momento de la desviación impulsiva, que muestra la continuación del movimiento en la dirección de la ruptura.
Formas de aplicación:
El indicador es autosuficiente y no requiere filtros adicionales para empezar a funcionar. Recomiendo la apertura de posiciones comerciales en la siguiente vela después de la ruptura (después de la formación de la señal). El nivel de Stop Loss es la señal inversa del indicador. Es decir, la señal pertenece a la categoría de señales inversas.
Consejo: