PD Reversal Patterns
- Indikatoren
- Version: 3.0
- Aktualisiert: 13 Juli 2019
- Aktivierungen: 5

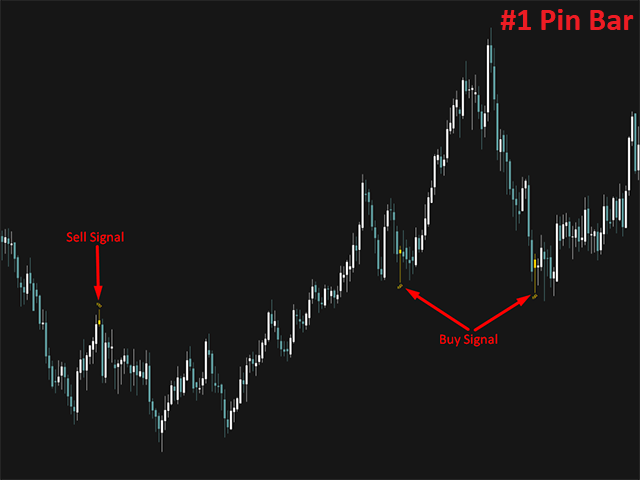
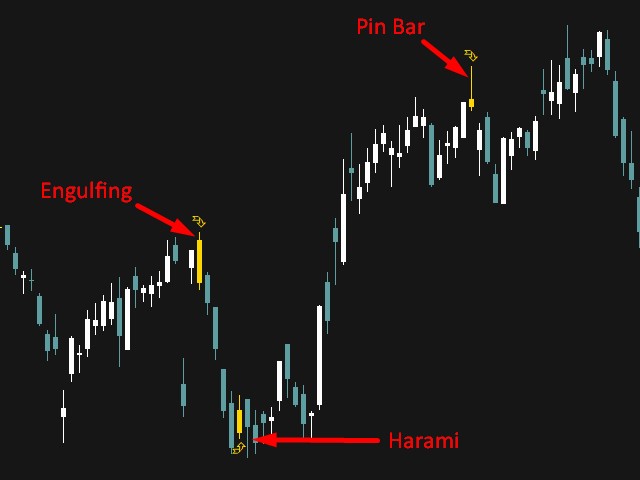
Der technische Indikator "Umkehrmuster" ist eine mathematische Interpretation der klassischen Umkehrmuster: Pin Bar, Harami und Engulfing. Das heißt, "Pivot Bar", "Harami" und "Engulfing". Dieser Indikator ermöglicht es Ihnen, den Zeitpunkt der Kursumkehr auf der Grundlage der Marktdynamik und des Gewinners zwischen "Bullen" und "Bären" zu bestimmen.
Der Indikator zeigt den Zeitpunkt der Umkehrung auf den lokalen Höchst- und Tiefstständen des Charts eines beliebigen Zeitrahmens an, was es Ihnen ermöglicht, die Genauigkeit des Signals zu erhöhen. Außerdem verfügt der Indikator über eine umfangreiche Liste von Parametern, die es ermöglicht, die Umkehrmuster an alle Bedingungen und Handelssysteme anzupassen. Der eingebaute Alarm und die akustische Benachrichtigung ermöglichen es Ihnen, eine Position sofort nach der Bildung eines Umkehrsignals zu eröffnen.
Methode der Anwendung:
Wenn die Kurse ein lokales Maximum/Minimum erreichen und ein Signal durch den Reversal Patterns Indikator gebildet wird, sowie eine überkaufte/überverkaufte Zone durch den Oszillator gebildet wird, können Sie eine Position unter dem Low/High Wert der Signalkerze eröffnen. Der Stop Loss ist in diesem Fall der umgekehrte Wert des lokalen Hochs/Tiefs.
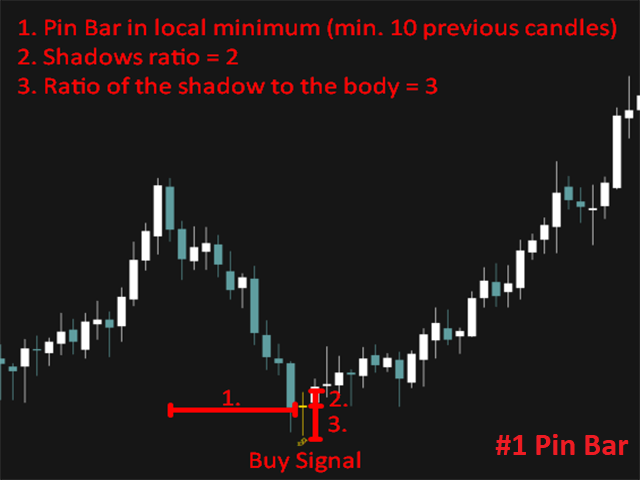
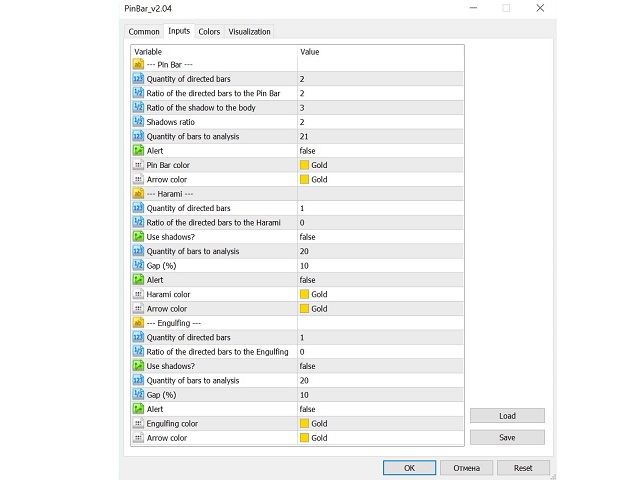
Pin Bar-Parameter:
- Anzahl der gerichteten Balken: zeigt die Anzahl der gerichteten Balken für die zusätzliche Analyse an.
- Verhältnis der gerichteten Balken zum Pin Bar: Zeigt das Verhältnis der Körpergröße zwischen den gerichteten Balken (Trendbalken) und dem Körper des Umkehrbalkens (Pin Bar) an.
- Ratio of the shadow to the body: Verhältnis des Körpers zum Schatten.
- Verhältnis der Schatten: Das Verhältnis der Schatten mit niedrigem und hohem Wert.
- Anzahl der Balken für die Analyse: Ermöglicht es Ihnen, die Anzahl der Balken zu berechnen, um das lokale Maximum oder Minimum zu bestimmen.
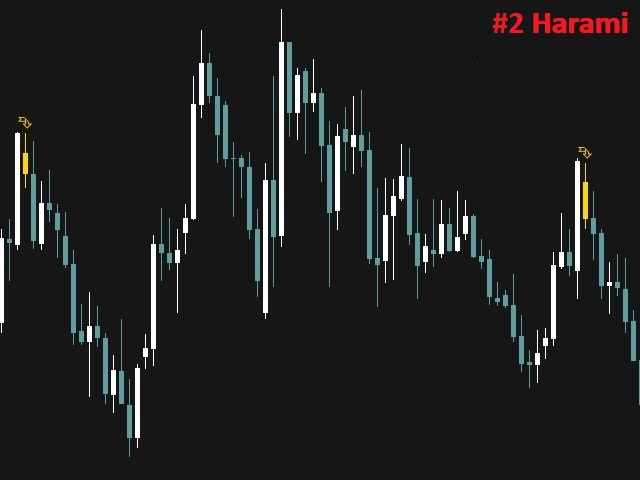
Harami-Parameter:
- Anzahl der gerichteten Balken: Zeigt die Anzahl der gerichteten Balken für die zusätzliche Analyse an.
- Verhältnis der gerichteten Balken zum Harami: Gibt das Verhältnis des Umkehrkerzenkörpers zur Trendkerze an. Voreinstellung = 0. Wenn 0, wird dieser Parameter nicht berücksichtigt. Wenn 1, sollte die Umkehrkerze einfach kleiner als die Trendkerze sein. Wenn 2, sollte die Umkehrkerze 2 mal kleiner als die Trendkerze sein (usw.).
- Schatten verwenden? - false/true. Schalter. Voreinstellung = false. Was bedeutet das? Dieser Parameter ist für das Prinzip der Musterberechnung. Standardmäßig sollte ein Trendbalken die Parameter eines Umkehrbalkens mit seinem Körper vollständig abdecken. Das heißt, der Körper des Trendbalkens ist größer als der Körper des Umkehrbalkens + Schatten. Wenn die Einstellung "Schatten verwenden?" aktiviert ist = true, dann sollte der Körper+Schatten der Signalkerze den Körper+Schatten der Trendkerze nicht überschreiten und gleichzeitig eine Lücke zum Schluss der vorherigen Kerze aufweisen (Parameter unter "Lücke (%)").
- Anzahl der Balken für die Analyse: ermöglicht die Berechnung der Anzahl der Balken, um das lokale Maximum oder Minimum zu bestimmen.
- Lücke (%): Berechnet den Prozentsatz, bei dem eine Umkehrkerze oberhalb/unterhalb der Trendkerze öffnen sollte. Das heißt, der Prozentsatz in Pips von der vorherigen Kerze.
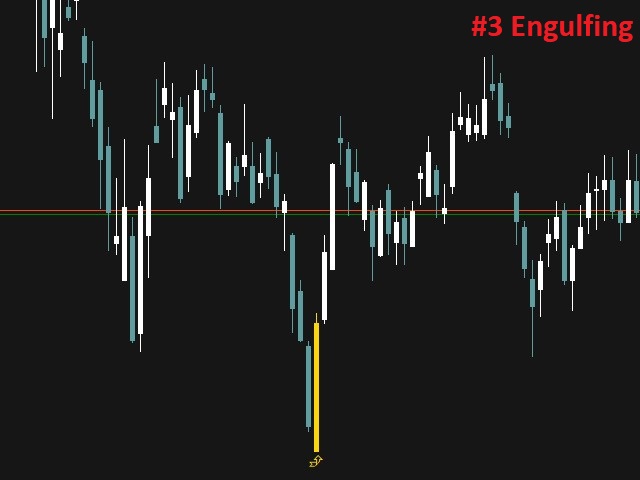
Engulfing-Parameter:
- Anzahl der gerichteten Balken: Zeigt die Anzahl der gerichteten Balken für zusätzliche Analysen an.
- Verhältnis der gerichteten Balken zum Engulfing: Zeigt das Verhältnis zwischen dem Körper der Umkehrkerze und der Trendkerze an.
- Schatten verwenden? - false/true. Schalter. Voreinstellung = false. Was bedeutet das? Dieser Parameter ist für das Prinzip der Musterberechnung. Standardmäßig sollte der Trendbalken vollständig vom Körper des Umkehrbalkens "absorbiert" werden. Das heißt, der Körper + Schatten des Trendbalkens ist kleiner als der Körper des Umkehrbalkens. Wenn der Parameter = true ist, können die Körper der beiden Figuren gleich sein, aber dann wird die Priorität auf den Schatten liegen.
- Anzahl der Balken für die Analyse: Ermöglicht die Berechnung der Anzahl der Balken, um das lokale Maximum oder Minimum zu bestimmen.
- Lücke (%): Berechnet den Prozentsatz, bei dem die Umkehrkerze oberhalb/unterhalb der Trendkerze öffnen sollte. Das heißt, der Prozentsatz in Pips von der vorherigen Kerze.
Der Indikator zeigt ein Signal und eine Warnung an, wenn die Kerze geschlossen wird.
Tipp:
Ich empfehle die Verwendung zusätzlicher Indikatoren aus der Gruppe der Oszillatoren, um das Handelssignal zu bestätigen. Das Signal dieses Indikators funktioniert auch gut bei Divergenzen im AO oder MACD.