CrossCorrelation
- Indikatoren
- Version: 1.1
- Aktivierungen: 5
Der Gedanke dahinter ist, dass starke Divergenzen von Hauptpaaren zu einem Ausstieg aus dem "Gleichgewicht" der entsprechenden Kreuzpaare führen. Bei ausreichend großen Divergenzen, die der Indikator anzeigt, wird das Cross-Paar in der Regel korrigiert, indem es ins "Gleichgewicht" eintritt. Beispiel: Bei der Arbeit mit dem Paar EURAUD wird die Differenz für den in den Einstellungen für die Paare EURUSD und AUDUSD angegebenen Zeitraum berechnet, und wenn die Differenz den festgelegten Schwellenwert überschreitet, wird das entsprechende Label auf dem Chart angezeigt. Bei den Hauptpaaren werden die Labels angezeigt, wenn sich der Preis um den eingestellten Schwellenwert ändert.
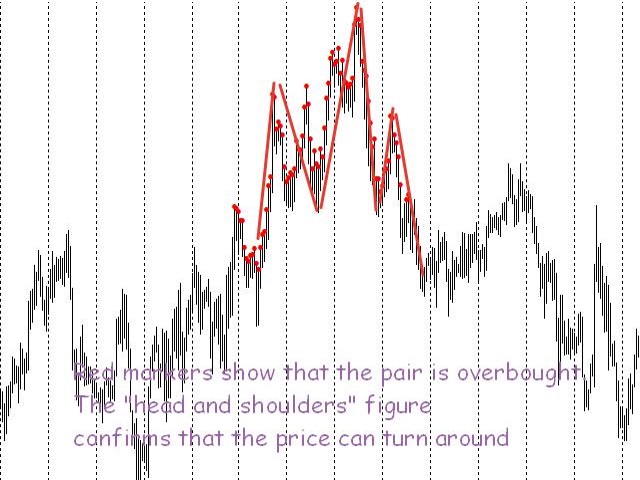
Rote Markierungen werden für die überkaufte Zone und blaue Markierungen für die überverkaufte Zone angezeigt.
Der Indikator zeigt nicht (nicht immer) unmittelbare Änderungen in der Richtung der Kursbewegung an, die durch andere Methoden bestätigt werden sollten (z.B.: Umkehrzahlen, Margin Levels).
Parameter
- Bars to Calc - Anzahl der Bars zur Berechnung der Korrelation (Standardwert ist 240)
- Levels (%) - Prozentsatz der Divergenz der wichtigsten Paare, bei deren Überschreitung die entsprechenden Labels auf dem Chart angezeigt werden (Standardwert ist 2).

не работает