Visual comparison of history and current patterns
- Indikatoren
-
Vladimir Kähri
 Professional trader,. I'm using automated strategies developed by myself. The strategy is proved as very good at long term period: profit is positive and stable, controllable risks.
 - Version: 1.0
- Aktivierungen: 5
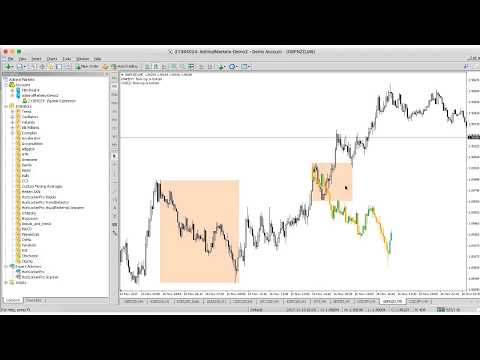
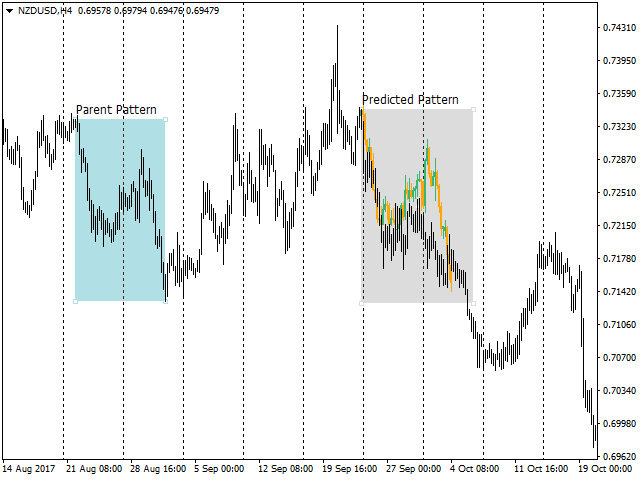
Der Indikator vergleicht das in der Chart-Historie gefundene Muster mit der aktuellen Kursbewegung. Da sich die Geschichte wiederholt, kann der Indikator durch den Vergleich der beiden Muster die weitere Bewegung des Preises vorhersagen. Der Indikator ermöglicht es Ihnen, das hervorgehobene historische Muster mit der aktuellen Bewegung zu überlagern, so dass Sie diese Bewegung visuell sehen und die Vergangenheit mit der Gegenwart vergleichen können.
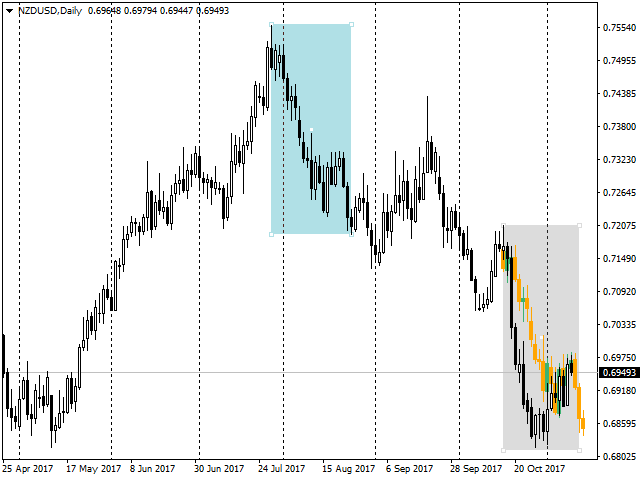
Um zwei Muster zu vergleichen, müssen Sie:
- Sie müssen ein Muster auf dem historischen Chart eines Währungspaares finden und markieren.
- Dann markieren Sie den Beginn der Kursbewegung, von dem aus das historische Muster überlagert wird.
Wie man mit dem Indikator arbeitet
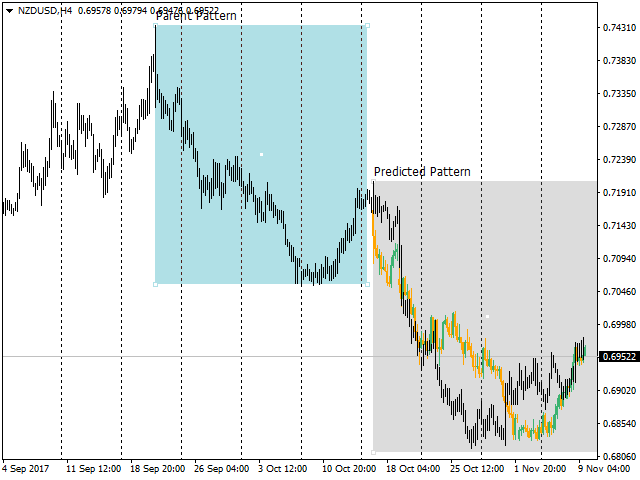
- Wenn Sie ein Muster gefunden haben, das Sie der aktuellen Kursbewegung überlagern möchten, wählen Sie dieses Muster mit dem Rechteckwerkzeug aus. Dieses Rechteck muss "übergeordnet" genannt werden. Öffnen Sie die Parameter des Rechteckinstruments und geben Sie "parent" in das Feld "Name" ein. Achtung! Alle Buchstaben sind klein!
- Als Nächstes müssen Sie den Beginn der Kursbewegung angeben, von dem aus das gefundene historische Muster überlagert werden soll. Hierfür können Sie auch das Rechteck-Werkzeug verwenden. Dieses Rechteck muss "Kind" genannt werden. Öffnen Sie die Parameter des Rechtecks und geben Sie "Kind" in das Feld "Name" ein (Achtung: alle Buchstaben sind klein!).
Es ist besser, einseitige Bewegungen oder Muster zu vergleichen. Wenn sich beispielsweise das "Eltern"-Muster mit einem Rollback nach unten bewegt, dann sollte es auf die aktuelle Abwärtsbewegung angewendet werden (möglicherweise mit einem Rollback). Umgekehrt gilt dies für eine Aufwärtsbewegung oder komplexere Muster.
So markieren Sie ein Muster
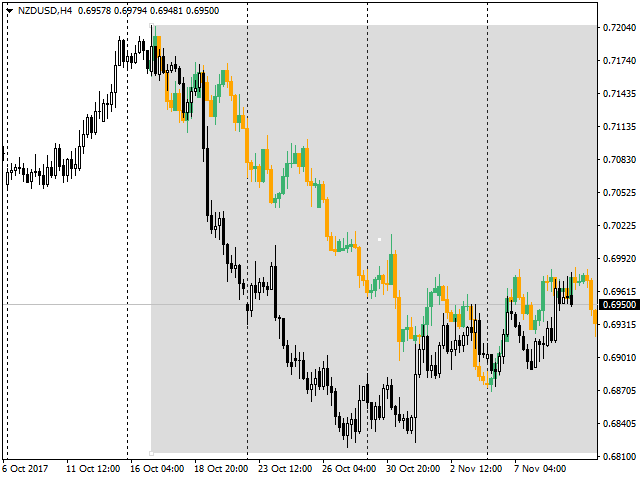
Um ein Muster in einem Verlaufsdiagramm zu markieren, verwenden Sie das Werkzeug Rechteck. Es kann in Länge und Breite gedehnt werden. Die Breite des Rechtecks bestimmt, wie viele Kerzen in dem Muster enthalten sein sollen. Die Höhe des Rechtecks bestimmt den Max/Min-Wert des ausgewählten Musters.
Wählen Sie das Muster z. B. wie folgt aus:
- Wenn es sich um ein Muster mit einer Abwärtsbewegung handelt, sollte das Rechteck von der obersten Kerze und vom Hoch dieser Kerze aus gezeichnet werden.
- Wenn es sich um ein Muster mit einer Aufwärtsbewegung handelt, dann sollte das Rechteck von der unteren Kerze und vom Tiefpunkt dieser Kerze aus gezeichnet werden.
Die Zeichnung der Rechtecke "Elternteil" und "Kind" muss übereinstimmen, d.h. wenn das "Elternteil" von oben nach unten (vom Hoch) gezeichnet wird, dann sollten Sie das "Kind" von oben nach unten vom Hoch der ersten Kerze zeichnen. Für die Aufwärtsbewegung gilt das Gegenteil der gleichen Regel. Die Rechtecke werden vom Tiefpunkt der Kerze aus gezeichnet.
Eigenschaften
- showComments - gibt an, ob zusätzliche Informationen angezeigt werden sollen oder nicht. Es werden Informationen über die Richtung der Rechtecke angezeigt. Diese Informationen helfen dabei, schnell zu bestimmen, wie ein Rechteck gezeichnet wird, denn es ist wichtig, das übergeordnete Muster korrekt über das analysierte Muster zu legen.
- showCandlesOnBackground - Gibt an, wie ein übergeordnetes Diagramm auf dem analysierten Diagramm gezeichnet werden soll. Zeichnen Sie hinter dem Hauptdiagramm (aktuelles Diagramm) oder im Hintergrund.
- BullBarColor - Bestimmt die Farbe einer bullischen Kerze
- BearBarColor - Legt die Farbe der bärischen Kerzen fest