Fractal Divergence Channel
- Indikatoren
- Version: 140.517

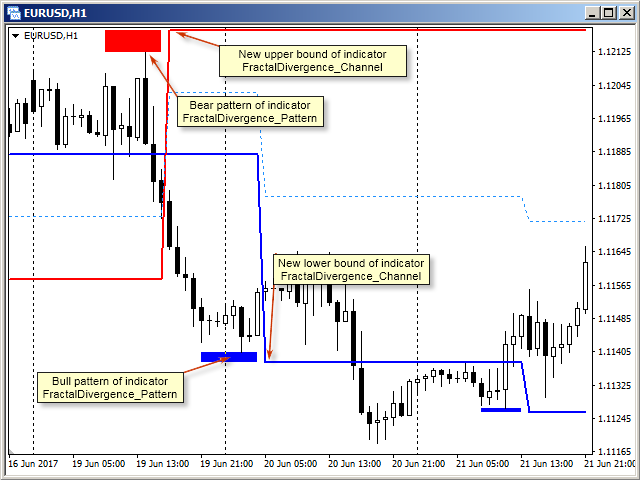
Der Fractal Divergence Channel basiert auf den fraktalen Divergenzmustern und stellt diese in Form eines Kanals dar, dessen Grenzen sich ändern, sobald das nächste Muster erscheint. Die obere Grenze des Kanals entspricht dem oberen Teil des zuletzt gefundenen bärischen fraktalen Divergenzmusters. Der untere Rand des Kanals ist der untere Teil des zuletzt gefundenen bullischen Musters (siehe Screenshot 1).
Im Vergleich zum FractalDivergence_Patterns-Indikator hat die Channel-Version die gleichen Parameter mit dem Zusatz von zwei:
- Warnung bei Durchbruch des Niveaus? - ein Alarmfenster erscheint, wenn der Preis die obere oder untere Grenze des Kanals durchbricht. Das nächste Fenster erscheint nur, wenn die gegenüberliegende Grenze durchbrochen wird.
- Benachrichtigung bei Level-Durchbruch? - sendet eine Benachrichtigung an mobile Geräte, wenn der Kurs die obere oder untere Grenze des Kanals durchbricht.
Die Darstellung der fraktalen Divergenz in Form eines Kanals hilft nicht nur, das Niveau der letzten beiden Muster (bullish und bearish) visuell zu markieren, sondern auch den aktuellen Markttrend zu bewerten:
- Der Markt befindet sich in einem Flat. Channel mit einer normalen relativen Position der Grenzen (das Widerstandsniveau liegt über dem Unterstützungsniveau), wobei sich die Grenzen sukzessive einander annähern (siehe Screenshot 2).
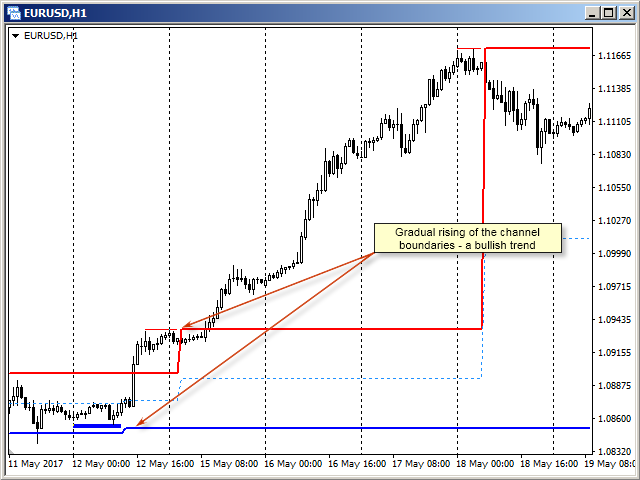
- Aufwärtstrend. Kanal mit einer relativen Position der Begrenzungen, bei der sie nacheinander angehoben werden (siehe Screenshot 3).
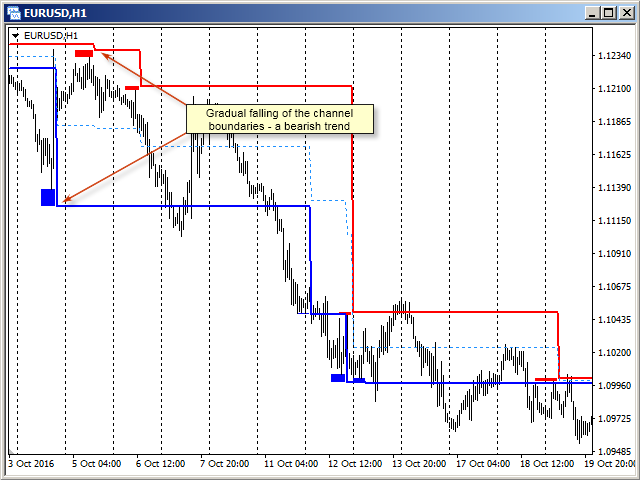
- Abwärtstrend. Kanal mit relativer Position der Begrenzungen, in dem sie nacheinander abgesenkt werden (siehe Abbildung 4).
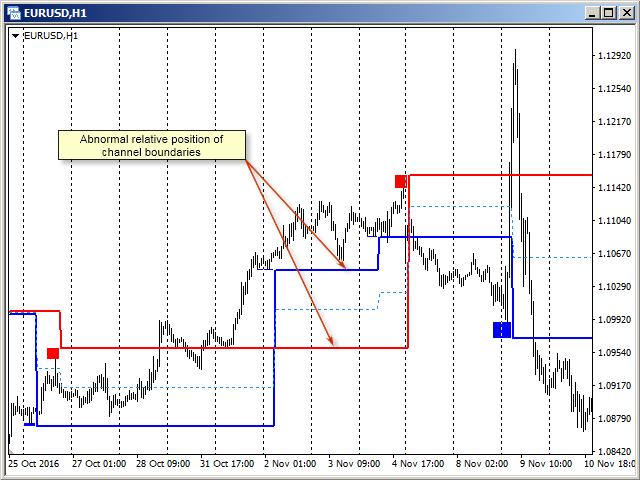
- Übergangszustand des Marktes. Kanal mit anormaler relativer Position der Grenzen (das Unterstützungsniveau liegt unter dem Widerstandsniveau). Es ist unmöglich, den Zustand des Marktes angemessen zu beschreiben. Solche Zustände gehen häufig einer Trendwende voraus, weshalb es besser ist, sich zu solchen Zeiten vom Markt fernzuhalten (siehe Abbildung 5).