Fractal Divergence Channel

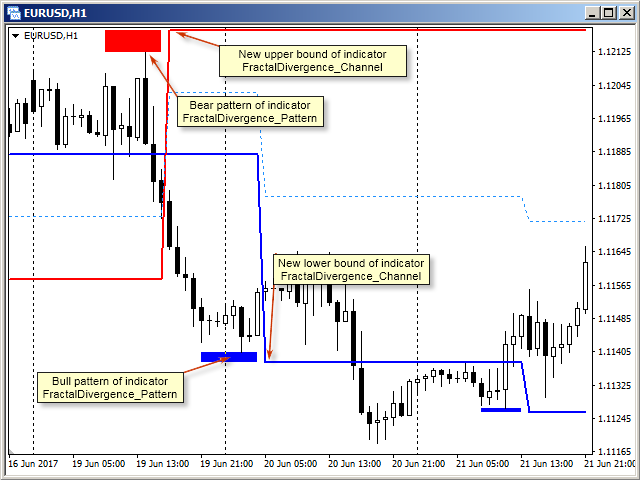
Fractal Divergence Channel is based on the fractal divergence patterns, representing them in the form of a channel with the borders changing the moment the next pattern appears. The upper border of the channel corresponds to the upper part of the last found bearish fractal divergence pattern. The lower border of the channel is the lower part of the last found bullish pattern (see screenshot 1).

Compared to the FractalDivergence_Patterns indicator, the channel version has the same parameters with addition of two:

  • Alert on level breakdown? - an Alert window appears when the price breaks the upper or lower border of the channel. The next window will appear only when the opposite border is broken.
  • Notification on level breakdown? - send notification to mobile devices when the price breaks the upper or lower border of the channel.

Representation of the fractal divergence in the form of a channel helps not only visually mark the level of the last two patterns (bullish and bearish), but also evaluate the current market trend:

  1. The market is in a flat. Channel with a normal relative position of the boundaries (the resistance level is above the support level), where the boundaries are successively approaching each other (see screenshot 2).
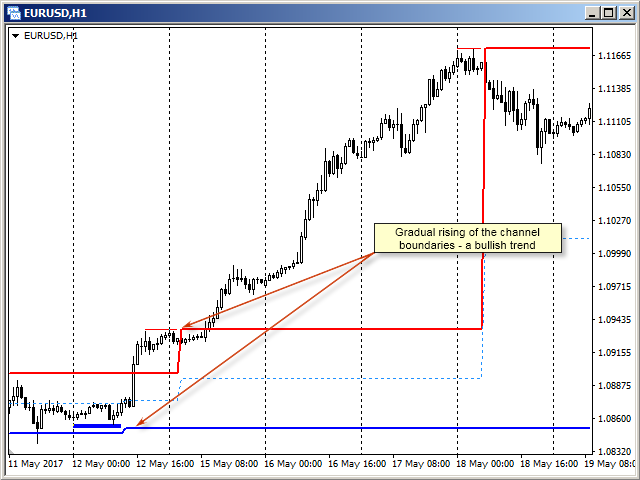
  2. Uptrend. Channel with relative position of the boundaries, where they are sequentially raised (see screenshot 3).
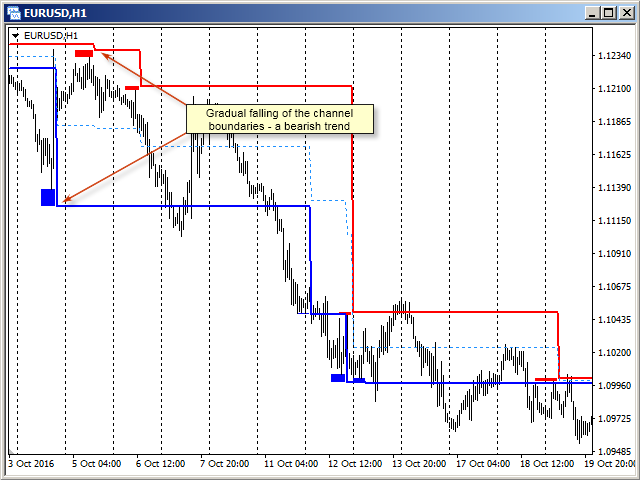
  3. Downtrend. Channel with relative position of the boundaries, where they are sequentially lowered (see screenshot 4).
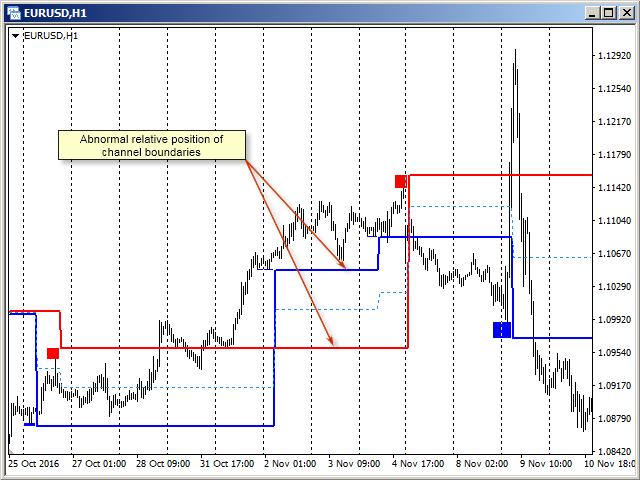
  4. Transitional state of the market. Channel with abnormal relative position of the boundaries (the support level is below the resistance level). It is impossible to say anything adequately about the state of the market. Such states often precede a change in the current trend, and therefore it is better to be out of the market at such times (see screenshot 5).
おすすめのプロダクト
This indicator has been created for finding the probable reversal points of the symbol price. A small candlestick reversal pattern is used it its operation in conjunction with a filter of extremums. The indicator is not redrawn! If the extremum filter is disabled, the indicator shows all points that have a pattern. If the extremum filter is enabled, the condition works – if the history Previous bars 1 candles back contains higher candles and they are farther than the Previous bars 2 candle, such
FREE
Auto Supply and Demand Oscillator is an indicator for MetaTrader 4 and MetaTrader 5 that detects supply and demand zones automatically and displays them as a single oscillator value at the bottom of the chart, instead of drawing rectangles directly on price. Concept Supply zones are price areas where strong selling created a sharp downward move away from a balance area. Demand zones are price areas where strong buying created a sharp upward move. Traditional implementations draw boxes on the
FREE
The indicator displays signals according to the strategy of Bill Williams on the chart. Demo version of the indicator has the same features as the paid, except that it can work only on a demo account . Signal "First Wise Man" is formed when there is a divergent bar with angulation.  Bullish divergent bar - with lower minimum and closing price in the upper half. Bearish divergent bar - higher maximum and the closing price at the bottom half. Angulation is formed when all three lines of Alligator
FREE
This indicator is very useful for day traders or short term traders. No need to calculate the number of pips manually, just look at the chart and you will see the Virtual Take Profit / Virtual Stop Loss target line and evaluate whether the entry point is feasible to reach the intended target or not. Enter the intended Take Profit / Stop Loss pips for your trade. The indicator will display Virtual Take Profit / Virtual Stop Loss lines for you to easily see if the target is feasible or not.
FREE
This is a multi-timeframe version of the popular Hull Moving Average (HMA). The Double HMA MTF Light indicator combines two timeframes on a single chart. The HMA of the higher timeframe defines the trend, and the HMA of the current timeframe defines short-term price movements. The indicator is freely distributed and hasn't audio signals or messages. Its main function is the visualization of price movements. If you need advanced functionality of the HMA multi-timeframe indicator (information ab
FREE
The free version of the Hi Low Last Day MT4 indicator . The Hi Low Levels Last Day MT4 indicator shows the high and low of the last trading day . The ability to change the color of the lines is available . Try the full version of the Hi Low Last Day MT4 indicator , in which additional indicator features are available : Displaying the minimum and maximum of the second last day Displaying the minimum and maximum of the previous week Sound alert when crossing max . and min . levels Selecting an arb
FREE
How would you like to instantly know what the current trend is? How about the quality of that trend? Finding the trend on a chart can be subjective. The Fractal Trend Finder indicator examines the chart for you and reveals what the current trend is based on objective criteria. Using the Fractal Trend Finder you can easily tell if you are trading with the trend or against it. It also identifies those times when the market is not trending. Theoretically, you could trade with the trend when the tre
FREE
This is a modified Fractals indicator. It works similar the original Bill Williams' indicator, and is additionally enhanced with the possibility to change the top radius, in contrast to the standard radius of 2 bar. Simply put, the indicator checks the top and if it is the minimum/maximum in this radius, such a top is marked by an arrow. Advantages Adjustable radius. Use for drawing support and resistance levels. Use for drawing trend channels. Use within the classical Bill Williams' strategy or
FREE
Pin Bars
Yury Emeliyanov
5 (5)
主な目的:"ピンバー"は、自動的に金融市場チャート上のピンバーを検出するように設計されています。 ピンバーは、特徴的なボディと長いテールを持つキャンドルであり、トレンドの反転または修正を知らせることができます。 それがどのように機能するか:インジケーターはチャート上の各キャンドルを分析し、キャンドルの体、尾、鼻のサイズを決定します。 事前定義されたパラメータに対応するピンバーが検出されると、インジケータはピンバーの方向(強気または弱気)に応じて、上矢印または下矢印でチャート上に パラメータ: TailToBodyRatio-テールの長さとピンバーのボディサイズの最小比率を定義します。 NoseToTailRatio-ピンバーの「ノーズ」とテールの間の最大許容比を設定します。 ArrowSize-マークされたピンバーとチャート上のピンバーを指す矢印との間の距離を定義します。 適用:"ピン棒"の表示器が潜在的な傾向の逆転ポイントを識別し、市場か近い位置を書き入れる信号を発生させるのに使用することができます。 正しく使用され、他のテクニカル指標や分析方法と組み合わせると、指標は取引結果
FREE
Free automatic Fibonacci is an indicator that automatically plots a Fibonacci retracement based on the number of bars you select on the BarsToScan setting in the indicator. The Fibonacci is automatically updated in real time as new highest and lowest values appears amongst the selected bars. You can select which level values to be displayed in the indicator settings. You can also select the color of the levels thus enabling the trader to be able to attach the indicator several times with differe
FREE
Ppr PA
Yury Emeliyanov
4.75 (4)
"Ppr PA" is a unique technical indicator created to identify "PPR" patterns on the currency charts of the MT4 trading platform. These patterns can indicate possible reversals or continuation of the trend, providing traders with valuable signals to enter the market. Features: Automatic PPR Detection:   The indicator automatically identifies and marks PPR patterns with arrows on the chart. Visual Signals:   Green and red arrows indicate the optimal points for buying and selling, respectively. Ar
FREE
Triple RSI
Pablo Leonardo Spata
1 (1)
LOOK AT THE FOLLOWING STRATEGY   WITH THIS INDICATOR.   Triple RSI   is a tool that uses the classic Relative Strength Indicator, but in several timeframes to find market reversals.    1.  ️ Idea behind the indicator and its strategy: In Trading, be it Forex or any other asset, the ideal is   to keep it simple, the simpler the better . The   triple RSI   strategy is one of the simple strategies that seek market returns. In our experience, where there is more money to always be won, i
FREE
RSI divergence indicator finds divergences between price chart and RSI   indicator and informs you with alerts (popup, mobile notification or email). Its main use is to find trend reversals in the chart. Always use the divergence indicators with other technical assets like support resistance zones, candlestick patterns and price action to have a higher possibility to find trend reversals. Three confirmation type for RSI   divergences: RSI   line cross 50 level (doesn't repaint) Price returns to
FREE
The Turtle Trading Indicator implements the original Dennis Richards and Bill Eckhart trading system, commonly known as The Turtle Trader. This trend following system relies on breakouts of historical highs and lows to take and close trades: it is the complete opposite to the "buy low and sell high" approach. The main rule is "Trade an N-day breakout and take profits when an M-day high or low is breached (N must me above M)". [ Installation Guide | Update Guide | Troubleshooting | FAQ | All Prod
FREE
PZ Penta O MT4
PZ TRADING SLU
2.33 (3)
The Penta-O is a 6-point retracement harmonacci pattern which usually precedes big market movements. Penta-O patterns can expand and repaint quite a bit. To make things easier this indicator implements a twist: it waits for a donchian breakout in the right direction before signaling the trade. The end result is an otherwise repainting indicator with a very reliable trading signal. The donchian breakout period is entered as an input. [ Installation Guide | Update Guide | Troubleshooting | FAQ | A
FREE
Basic Harmonic Pattern
Mehran Sepah Mansoor
4.58 (59)
このインディケータは、相場の反転ポイントを予測する最もポピュラーなハーモニックパターンを識別します。これらのハーモニックパターンは、外国為替市場で常に繰り返され ている価格形成であり、将来起こりうる値動きを示唆します。/   MT5無料バージョン さらに、このインジケーターには、市場エントリーシグナルと、様々な利食いと損切りが組み込まれています。ハーモニック・パターン・インディケータは、それ自体で売買シグナルを発 信することができますが、他のテクニカル・インディケータを使用してこれらの シグナルを確認することをお勧めします。例えば、RSIやMACDなどのオシレーターを使用して、トレンドの方向性やモメンタ ムの強さを確認してから売買を行うことを検討するとよいでしょう。 このインディケータのダッシュボードスキャナ: ( Basic Harmonic Patterns Dashboard ) 含まれるハーモニックパターン ガートレー バタフライ バット カニ サメ サイファー ABCD 主な入力 Max allowed deviation (%): このパラメータは、調和的パタ
FREE
ハーモニックパターンは市場の転換点を予測するのに最適です。これらのパターンは高い勝率と1日の中での多くの取引機会を提供します。当社のインジケーターは、ハーモニックトレーディングの原則に基づいて、市場反転ポイントを予測する最も一般的なハーモニックパターンを特定します。 重要な注意事項: インジケーターは再描画されず、遅れることはありません(パターンはDポイントで検出されます);再描画されることはありません(パターンは有効またはキャンセルされます)。 使用方法: インジケーターをMT5チャートにドラッグアンドドロップします。 パターン検出をTRUE(ABCD;Gartley)に設定します。 任意のデバイスを設定します(高いデバイス=より多くのパターン;低いデバイス=より少ないパターン)。 好みに合わせて色を調整します。 バルブ/エントリーポイント、TP、SLの警告を有効または無効にします。 パターンが検出された場合: アルゴリズムはDポイントでパターンを検出します。 警告が有効になっている場合、パターン検出を通知します。 パターンが無効になった場合、「パターンがキャンセルされました」という
FREE
FlatBreakout (Free Version) Flat Range Detector and Breakout Panel for MT4 — GBPUSD Only FlatBreakout is the free version of the professional FlatBreakoutPro indicator, specially designed for flat (range) detection and breakout signals on the GBPUSD pair only. Perfect for traders who want to experience the unique fractal logic of FlatBreakout and test breakout signals on a live market without limitations. Who Is This Product For? For traders who prefer to trade breakout of flat ranges (breakout,
FREE
Necessary for traders: tools and indicators Waves automatically calculate indicators, channel trend trading Perfect trend-wave automatic calculation channel calculation , MT4 Perfect trend-wave automatic calculation channel calculation , MT5 Local Trading copying Easy And Fast Copy , MT4 Easy And Fast Copy , MT5 Local Trading copying For DEMO Easy And Fast Copy , MT4 DEMO Easy And Fast Copy , MT5 DEMO The homeopathic indicator is also called the CCI indicator. The CCI indicator was proposed
FREE
Candle Countdown — MT4用 正確なローソク足カウントダウン Candle Countdown は、 現在のローソク足が閉じるまでの残り時間 をチャート上に表示するシンプルで正確なツールです。 エントリーがローソク足のクローズに依存する場合、数秒の違いが重要になります。 このインジケーターは正確な時間を表示し、焦らずに判断できるようサポートします。 ローソク足のクローズ時間を正確に把握するためのインジケーターです。 表示内容: ローソク足が閉じるまでの残り時間 サーバー現在時刻 スプレッド ストップレベル(Stop Level) タイマーはティックに依存せず、プラットフォームの内部タイマーによって更新されるため、市場の動きが少ない場合でも安定した表示を維持します。 これにより、低ボラティリティの環境でも滑らかで安定したカウントダウンを実現します。 情報は背景付きのブロック内に表示されるため、どのチャートカラーでも見やすく、分析の妨げになりません。 ローソク足のクローズが近づくと、タイマーの色が変化し、視覚的に状況を把握しやすくなります。 MT5版はこちら: Cand
FREE
This indicator scans for you up to 30 trading instruments and up to 8 timeframes for occurrences of the high probability reversal patterns: Double Tops/Bottoms with fake breakouts . Please read also the blog post " Professional Trading With Double Tops/Bottoms And Divergences! " which explains the concepts behind the ULTIMATE Double Top/Bottom indicator and how you can use a professional top-down approach. This FREE Version of the Scanner scans only EURUSD and GBPUSD. The full version of the sca
FREE
The Support & Resistance Breakout Indicator with Smart Alerts a utomatically identifies key support and resistance levels using fractal detection, and receive instant breakout signals enhanced by RSI/CCI confirmation filters. This versatile tool includes   push notifications, email alerts, pop-up alerts, and sound alerts  so you never miss a trading opportunity. Key Features: Dynamic Level Detection  – Draws real-time support and resistance based on market fractals. Breakout Arrows  – Clear vis
FREE
Follow The Line
Oliver Gideon Amofa Appiah
3.94 (16)
FOLLOW THE LINE GET THE FULL VERSION HERE: https://www.mql5.com/en/market/product/36024 This indicator obeys the popular maxim that: "THE TREND IS YOUR FRIEND" It paints a GREEN line for BUY and also paints a RED line for SELL.  It gives alarms and alerts of all kinds. IT DOES NOT REPAINT and can be used for all currency pairs and timeframes. Yes, as easy and simple as that. Even a newbie can use it to make great and reliable trades. NB: For best results, get my other premium indicators for more
FREE
A forex   pivot point   strategy could very well be a trader’s best friend as far as identifying levels to develop a bias, place stops and identify potential profit targets for a trade. Pivot points have been a go-to for traders for decades. The basis of pivot points is such that price will often move relative to a previous limit, and unless an outside force causes the price to do so, price should stop near a prior extreme. Pivot point trading strategies vary which makes it a versatile tool for
FREE
Scalping indicator. It takes into account volatility, price movement in the local interval and the direction of the current trend. Recommended timeframe - M5. Advantages: Low volatility when a signal appears ensures minimal movement against an open position. The indicator does not redraw its signals. There are alert signals. It is a great tool for day trading. Settings: Name Description Period Indicator period Range of each bar in the period (pp.) The maximum size of each candle in the indicato
FREE
Fractals Direction ST Patterns MT4 is a modification of Bill Williams' Fractals indicator, which allows you to specify any number of bars for finding a fractal. In the settings, it is also possible to set the number of points for determining the trend direction. The upward direction is determined if the last upper fractal is higher than the penultimate upper fractal. The downward direction is determined if the last lower fractal is lower than the penultimate lower fractal. This simple indicator
FREE
Shape Pack
John Louis Fernando Diamante
5 (1)
This indicator provides common shapes as drawing object options. The shapes are rotatable, resizable, draggable, and will keep their proportions (according to their handle trendline) across different chart scales. Multiple drawings are supported. Shapes: Square Rhombus Triangle (quadrilateral & isosceles) Circle (grid, overlapped grid, flexi grid, rotatable grid, concentric circles) Features: rays (all object edges will be rays) show/hide each individual drawing type, or all delete last drawn ob
FREE
Power Trend Free - the indicator shows the trend strength in the selected period. Input Parameters The indicator has three input parameters: Period - a positive number greater than one, it shows the number of candlesticks used for calculations. If you enter one or zero, there will be no error, but the indicator will not be drawn. Applied Price - the standard "Apply to:" set meaning data used for the indicator calculation: Close - Close prices; Open - Open prices; High - High prices; Low - Low p
FREE
Candle GAP
Thushara Dissanayake
3 (1)
ローソク足ギャップ インジケーターは、曜日ごとのローソク足ギャップを自動的に識別するため、 ギャップ取引戦略を 利用するトレーダーにとって不可欠なツールです。ギャップとは、連続する 2 日間の終値と始値の間の価格レベルの差を指します。このインジケーターは、共通、離脱、継続、枯渇の 4 種類のギャップ パターンを認識します。このインジケーターをチャートに組み込むことで、トレーダーはシグナルを検証し、取引の意思決定を強化できます。 ローソク足 GAP インジケーターの重要な特徴の 1 つは、D1 (日次) の下の任意の時間枠および任意のシンボルまたは商品に対して使用できる多用途性です。使いやすいパラメータを提供し、あらゆる経験レベルのトレーダーが利用できるようになります。このインジケーターはチャート上にギャップ パターンを迅速に描画し、迅速な分析と意思決定を可能にします。そのシンプルさにより使いやすさが向上し、簡単で効率的な取引体験が保証されます。 インジケーターのデータ表示パラメーターを使用すると、トレーダーはギャップ情報の外観をカスタマイズできます。ユーザーは、各曜日に関連付けられたテ
FREE
MTF Alligator
Alexander Pekhterev
4.75 (8)
This is an indicator detecting trend direction. It uses the popular Bill Williams Alligator. It shows market state on all timeframes on one chart. As is well known, traders gain the main profit on the Forex market trading by trend, and losses usually occur when the market is flat. So, in order to gain profit a trader should learn to detect trend market and direction of a current trend in a rapid manner. This indicator has been developed for this purpose. MTF Alligator helps to: Profitably trade
FREE
このプロダクトを購入した人は以下も購入しています
Neuro Poseidon is a new indicator by Daria Rezueva. It combines precise trading signals with adaptive TP/SL levels - creating best possible trades as a result! Message me and get  Neuro Poseidon Assistant  as a gift to automize your trading process! What makes it stand out? 1. Proven profitability on all assets and timeframes 2. Only confirmed BUY and SELL signals present on the chart 3. Adaptive TP & SL levels generated by the software for each trade 4. Easy to understand - suitable for all
Gann Made Easy は、ミスター・ギャンの理論を使用した取引の最良の原則に基づいた、プロフェッショナルで使いやすい外国為替取引システムです。 W・D・ガン。このインジケーターは、ストップロスとテイクプロフィットレベルを含む正確な買いと売りのシグナルを提供します。 PUSH通知を利用して外出先でも取引可能です。 ご購入後、取引方法の説明と優れた追加インジケーターを無料で入手するには、私にご連絡ください! おそらく、ギャンの取引手法についてはすでに何度も聞いたことがあるでしょう。通常、ギャンの理論は初心者のトレーダーだけでなく、すでにある程度の取引経験がある人にとっても非常に複雑なものです。なぜなら、ギャンの取引手法は理論的にはそれほど簡単に適用できるものではないからです。私はその知識を磨き、最良の原則を私の外国為替インジケーターに組み込むために数年を費やしました。 このインジケーターは非常に簡単に適用できます。必要なのは、それをチャートに添付し、簡単な取引推奨事項に従うだけです。このインジケーターは常に市場分析の仕事を行い、取引の機会を探します。適切なエントリーポイントを検出す
Dynamic Forex28 Navigator - 次世代の Forex 取引ツール。 現在 49% オフ。 Dynamic Forex28 Navigator は、長年人気のインジケーターを進化させたもので、3 つの機能を 1 つにまとめています。 Advanced Currency Strength28 インジケーター (レビュー 695 件)  + Advanced Currency IMPULSE with ALERT (レビュー 520 件) + CS28 コンボ シグナル (ボーナス)。 インジケーターの詳細 https://www.mql5.com/en/blogs/post/758844 次世代の Strength インジケーターが提供するもの  オリジナルで気に入っていたすべての機能が、新機能と精度の向上によって強化されました。 主な機能: 独自の通貨強度計算式。 すべての時間枠でスムーズかつ正確な強度ライン。 トレンドの特定と正確なエントリーに最適です。 ダイナミックマーケットフィボナッチレベル (マーケットフィボナッチ)。 このインジケーターに固有
M1 SNIPER は使いやすいトレーディングインジケーターシステムです。M1時間足向けに設計された矢印インジケーターです。M1時間足でのスキャルピングのためのスタンドアロンシステムとして、また既存のトレーディングシステムの一部としても使用できます。このトレーディングシステムはM1時間足での取引に特化して設計されていますが、他の時間足でも使用できます。元々、この手法はXAUUSDとBTCUSDの取引用に設計しましたが、他の市場においても役立つと考えています。 インジケーターのシグナルは、トレンドの方向と逆方向に取引できます。インジケーターのシグナルを利用して両方向に取引するのに役立つ特別な取引テクニックをご紹介します。この手法は、特別な動的なサポートとレジスタンスの価格帯を利用することに基づいています。 ご購入後、M1 SNIPER矢印インジケーターをすぐにダウンロードできます。さらに、M1 SNIPERツールのすべてのユーザーに、以下のスクリーンショットに表示されているApollo Dynamic SRインジケーターを無料で提供しています。この2つのインジケーターを組み合わせることで
Scalper Inside PRO Scalper Inside PRO は、MetaTrader 4 向けの短期トレンドおよびスキャルピング用インジケーターです。独自アルゴリズムを用いて、市場の方向性と主要なターゲットレベルを素早く検出します。エントリー、イグジット、複数の利確ターゲットを自動計算し、詳細なパフォーマンス統計を表示することで、さまざまな銘柄やストラテジーがどのように機能してきたかを確認できます。これにより、現在のマーケットコンディションに最も適した取引銘柄を選択するのに役立ちます。さらに、Scalper Inside PRO には、お使いの矢印インジケーターを簡単に接続でき、その統計と過去のパフォーマンスを素早く評価できます。 本インジケーターは、あらゆる銘柄と時間足で動作し(短期トレードには M5 を推奨)、複数の内蔵ストラテジーを備えています。そのため、単体のスキャルピングツールとしても、トレーディングシステム内の強力な分析コンポーネントとしても活用できます。 主な機能 独自アルゴリズム(Next‑Generation Trend Detection Algor
Enigmera
Ivan Stefanov
5 (8)
ENIGMERA: 市場の中心 重要:MQL5.comのデモはStrategy Testerで実行されており、Enigmeraの機能を完全には反映していない場合があります。詳細については、説明、スクリーンショット、ビデオをご確認ください。質問があれば、遠慮なくメッセージを送ってください! インジケーターのコードは完全に書き直されました。バージョン3.0は新機能を追加し、インジケーターの開始以来蓄積されたバグを修正しました。 紹介 このインジケーターとトレーディングシステムは、金融市場への注目すべきアプローチです。ENIGMERAはフラクタルサイクルを使用して、サポートとレジスタンスのレベルを正確に計算します。真の蓄積フェーズを示し、方向と目標を提供します。トレンドでも修正でも機能するシステムです。 動作方法 インジケーターのほとんどの機能は、チャートの左側にあるボタンで制御され、市場の状況に迅速に対応できるようになっています。 ボタン ON/OFF – インジケーター全体を表示または非表示にします。 Channel – サポートチャネルを有効にし、許容範囲の偏差を示します。 Dev
多くの矢印インジケーターは、シグナルだけを表示して、その後の判断はすべてトレーダー任せです。KT Alpha Hunter Arrows は、最初から完成されたトレードプランを提供します。 各シグナル矢印が表示されると、エントリーライン、ストップロス、4つのテイクプロフィット水準、そして現在の銘柄と時間足を今トレードする価値があるかを示すリアルタイムのエッジ判定が、チャート上にまとめて描画されます。付属の Trade Manager EA は、手動でエントリーした後の管理をサポートし、相場が荒れて感情が揺れやすい場面でも、トレードの規律を保ちやすくします。リペイントなし。確定足のみでシグナルを表示。Forex、ゴールド、指数、その他あなたが取引するあらゆる銘柄向けに設計されています。 主な機能 リペイントしない買い・売り矢印。シグナルは足が確定した後にのみ表示されます。 各シグナルにエントリーライン、構造的なストップロス、4つのテイクプロフィット水準を表示。 Edge Dashboard が、現在のチャート上で買いと売りのセットアップを個別に評価。 判定システム:No Edge、Ma
Price & Time Market Structure Indicator A professional market structure tool that analyzes waves through both price and time — not price alone. Main Description NeoWave PRO is a professional market structure indicator for MetaTrader 4 designed for traders who want to move beyond traditional one-dimensional wave tools such as ZigZag, swing indicators, and basic high/low systems. Most wave indicators analyze only one thing: Price. But a real market wave is not only a price movement. A true wave de
PRO Renko Systemは、特別にRENKOチャートを取引するために設計された高精度の取引システムです。 これは、様々な取引商品に適用することができる普遍的なシステムです。 システムは効果的に正確な逆転信号へのアクセスを与えるいわゆる市場の騒音を中和する。 表示器は非常に使いやすく、信号の生成に責任がある1つの変数だけがあります。 あなたは簡単にお好みの任意の取引ツールとレンコバーのサイズにツールを適応させることができます。 私はいつもあなたが私のソフトウェアで収益性の高い取引を支援するために余分なサポートを提供する準備ができています! 私はあなたに幸せで収益性の高い取引をしたいです! ご購入後にご連絡ください! 私はあなたに私のレンコチャートジェネレータを送信します。 私はまた、私の個人的な推奨事項やシステムの他のモジュールを無料で共有します!
トレンドラインプロ   市場の真の方向転換点を理解するのに役立ちます。この指標は、真のトレンド反転と主要プレーヤーが再び参入するポイントを示します。 分かりますか     BOSライン   複雑な設定や不要なノイズなしに、より長い時間足でのトレンドの変化と重要なレベルを把握できます。シグナルは再描画されず、バーが閉じた後もチャート上に残ります。 VERSION MT 5     -     RFI LEVELS PRO インジケーター と組み合わせることで、その潜在能力を最大限に発揮します。 インジケーターが示す内容: 本当の変化   トレンド(BOSライン) 一度シグナルが現れたら、それは有効です!これは、リペイント機能を持つインジケーターとの重要な違いです。リペイント機能を持つインジケーターは、シグナルを発した後、それを変更し、資金の損失につながる可能性があります。これにより、より高い確率と精度で市場に参入できます。また、矢印が現れた後、目標値(利益確定)に達するか、反転シグナルが現れるまで、ローソク足の色を変更する機能もあります。 繰り返しエントリ       主要プレーヤーの
Trend Catcher ind
Ramil Minniakhmetov
5 (2)
トレンドキャッチャーインジケーター トレンドキャッチャーインジケーターは、開発者独自の適応型トレンド分析指標を組み合わせることで、市場価格の動きを分析します。短期的なノイズを除去し、根底にあるモメンタムの強さ、ボラティリティの拡大、価格構造の挙動に焦点を当てることで、真の市場方向性を特定します。また、移動平均線、RSI、ボラティリティフィルターなどの平滑化およびトレンドフィルタリング機能を備えたカスタマイズ指標も使用します。 実際の運用状況のモニタリングやその他の製品については、こちらをご覧ください: https://www.mql5.com/en/users/mechanic/seller ご注意ください。私はTelegramでEAや設定を販売していません。詐欺です。すべての設定はブログで無料で公開しています。 重要!ご購入後すぐにご連絡ください。手順とボーナスをお送りします!
Genesis Matrix Pro is a professional multi-timeframe trend detection indicator designed to help traders identify high-quality market alignment with clarity and structure. It combines 12 different technical indicators into one visual alignment matrix, allowing traders to quickly see when market conditions are bullish, bearish, or neutral. A signal is generated only when the selected strategies are aligned, helping reduce noise and improve decision-making. PLEASE CONTACT ME AFTER PURCHASE TO GET
Current event:  https://c.mql5.com/1/326/A2SR2025_NoMusic.gif A. A2SR とは何ですか ?   * 先行テクニカル指標です (塗り直しなし、ラグなし)。 -- ガイダンス : -- https://www.mql5.com/en/blogs/post/734748/page4#comment_16532516 -- そして https://www.mql5.com/en/users/yohana/blog A2SR には、サポート (需要) とレジスタンス (供給) のレベルを決定する特別な手法があります。 ネットで見かける通常の方法とは異なり、A2SR は実際の SR レベルを決定する独自のコンセプトを持っています。 元の手法はインターネットから取得されたものではなく、インターネット上で公開されたこともありません。 A2SR は、取引スタイルに応じて SR レベルを自動選択します。 時間枠を変更しても、SR レベルはその位置にとどまります。 実際のSRは、使用する時間枠から取得されるわけではないため. A2SR
トレンドトレーディング は、タイミングのプルバックとブレイクアウトにより、市場で起こっているトレンドから可能な限り利益を得るように設計された指標です。確立されたトレンドの中で価格が何をしているかを分析することにより、取引の機会を見つけます。 [ インストールガイド | 更新ガイド | トラブルシューティング | よくある質問 | すべての製品 ] 自信を持って効率的に金融市場を取引する むち打ちにならずに確立されたトレンドから利益を得る 収益性の高いプルバック、ブレイクアウト、早期の逆転を認識する この指標は、独自の品質とパフォーマンスを分析します 複数時間枠のダッシュボードを実装します インジケーターは再描画されていません 電子メール/音声/視覚アラートを実装します 確立されたトレンドは多くの取引機会を提供しますが、ほとんどのトレンド指標はそれらを完全に無視しています。インジケーターの解釈はかなり簡単です: (1) トレンドの変化 (2) トレンドの方向への後退 (3) トレンドの方向へのブレイクアウト 赤いダッシュ は下降トレンド中の修正です 青いダッシュ は上昇トレンド中
Step into the world of Forex trading with confidence, clarity, and precision using   Gold Indicator   a next-generation tool engineered to take your trading performance to the next level. Whether you’re a seasoned professional or just beginning your journey in the currency markets, Gold Indicator equips you with powerful insights and help you trade smarter, not harder. Built on the proven synergy of three advanced indicators, Gold Indicator focuses exclusively on medium and long-term trends eli
この製品は 2026 年の市場向けに更新され、最新の MT5 ビルドに最適化されています。 価格更新のお知らせ: Smart Trend Trading System は現在 $99 で提供されています。 次の 30 件の購入 後、価格は $199 に上がります。 特別オファー: Smart Trend Trading System を購入後、私にプライベートメッセージを送ることで、 Smart Universal EA を無料 で受け取り、Smart Trend のシグナルを自動売買に変えることができます。 Smart Trend Trading System は、リペイントなし、再描画なし、遅延なしの完全なトレーディングシステムです。よりクリーンなシグナル、より明確なトレンド方向、そしてより整理された取引方法を求めるトレーダー向けに作られています。 Online course , manual and download presets . このシステムは、トレンド検出、反転ゾーン、Smart Cloud、トレーリングストップロジック、サポートとレジスタンス、ローソク足の色分け、ア
Scalper Vault は、スキャルピングを成功させるために必要なすべてを提供するプロフェッショナルなスキャルピング システムです。このインジケーターは、外国為替およびバイナリー オプションのトレーダーが使用できる完全な取引システムです。推奨される時間枠は M5 です。 システムは、トレンドの方向に正確な矢印シグナルを提供します。また、トップとボトムのシグナルとギャン マーケット レベルも提供します。 インジケーターは、プッシュ通知を含むすべてのタイプのアラートを提供します。 インジケータの購入後にご連絡ください。私の個人的な取引の推奨事項と素晴らしいボーナス指標を無料で共有します! 幸せで有益な取引をお祈りします!
スイングトレーディング は、トレンドの方向のスイングと可能な反転スイングを検出するように設計された最初のインジケーターです。トレーディングの文献で広く説明されているベースラインスイングトレーディングアプローチを使用します。インディケータは、いくつかの価格と時間のベクトルを調査して、全体的なトレンドの方向を追跡し、市場が売られ過ぎまたは買われ過ぎて修正の準備ができている状況を検出します。 [ インストールガイド | 更新ガイド | トラブルシューティング | よくある質問 | すべての製品 ] むち打ちを起こさずに市場スイングの利益 インジケーターは常にトレンドの方向を表示します 色付きの価格帯は機会のベースラインを表します 色付きのダッシュは、可能な反転スイングを表します この指標は、独自の品質とパフォーマンスを分析します 複数時間枠のダッシュボードを実装します カスタマイズ可能なトレンドおよびスイング期間 電子メール/サウンド/プッシュアラートを実装します インジケータは再描画またはバックペインティングではありません Swing Tradingとは Swing Tradingは
BTMM State Engine Pro is a MetaTrader 4 indicator for traders who use the Beat The Market Maker approach: Asian session context, kill zone timing, level progression, peak formation detection, and a multi-pair scanner from a single chart. It combines cycle state logic with a built-in scanner dashboard so you do not need the same tool on many charts at once. What it does Draws the Asian session range; session times can follow broker server offset or be set in inputs. Tracks level progression (L
「 Dynamic Scalper System 」インジケーターは、トレンド波の中でスキャルピング取引を行う手法のために設計されています。 主要通貨ペアと金でテスト済みで、他の取引商品との互換性があります。 トレンドに沿った短期的なポジションオープンのシグナルを提供し、追加の価格変動サポートも提供します。 インジケーターの原理 大きな矢印はトレンドの方向を決定します。 トレンド波の中では、小さな矢印の形でスキャルピングシグナルを生成するアルゴリズムが機能します。 赤い矢印は強気方向、青い矢印は弱気方向です。 トレンドの方向には敏感な価格変動ラインが描かれ、小さな矢印のシグナルと連動します。 シグナルは次のように機能します。適切なタイミングでラインが現れるとエントリーシグナルが形成され、ラインが開いている間はポジションが保持され、完了すると取引が終了します。 推奨される動作時間枠はM1~H4です。 矢印は現在のローソク足に形成され、次のローソク足が開いている場合は、前のローソク足の矢印は再描画されません。 入力パラメータ Trend Wave Period - トレンド方向
MonsterDash Harmonic Indicator is a harmonic pattern dashboard. It recognizes all major patterns. MonsterDash is a dashboard that displays all detected patterns for all symbols and (almost) all timeframes in sortable and scrollable format. Users can add their own user defined patterns . MonsterDash can open and update charts with the pattern found. Settings MonsterDash's default settings are good enough most of the time. Feel free to fine tune them to your needs. The color settings are for thos
Apollo SR Master は、サポート/レジスタンスゾーンを利用した取引をより容易かつ確実にする特別な機能を備えたサポート/レジスタンスインジケーターです。このインジケーターは、ローカル価格の高値と安値を検出することで、タイムラグなしでリアルタイムにサポート/レジスタンスゾーンを計算します。そして、新たに形成されたSRゾーンを確認するために、インジケーターは特別なシグナルを表示します。このシグナルは、SRゾーンを実際の売りまたは買いシグナルとして考慮して使用できることを示します。この場合、SRゾーンの強度が高まり、SRエリアからの取引が成功する確率も高まります。これがこのインジケーターの基本的な考え方です。 SRゾーンは、ストップロスとテイクプロフィットの設定を容易にします。シグナルの方向に応じて、SRゾーンの上または下のスペースをストップロスとして設定できます。さらに、反対側のSRゾーンは、潜在的なテイクプロフィットエリアとして設定できます。 また、Apollo SRマスターインジケーターをご利用のすべてのユーザーには、「Apollo Price Action System」
地震計マーケット クエイク検出器。 Description in English : https://www.mql5.com/en/market/product/113869?source=Site+Market+Product+Page#description How to use the Seismograph : https://www.mql5.com/en/market/product/113869#!tab=comments&page=2&comment=52806941 Create an EA : https://www.mql5.com/en/market/product/113869#!tab=comments&page=3&comment=52816509 どのような取引方法であれ、流動性の低い市場への参入は避けたいものです。 地震計は、市場が上昇する前に市場に参入する適切なタイミングに役立ちます。 しかし、忙しいはずの市場時間帯にエントリーするようにしたにもかかわらず、流動性の低い市場に閉じ込められてしまう人が多いのが実情です。 数時間待った後、
現在40%オフ 初心者やエキスパートトレーダーに最適なソリューション! このインジケーターは、独自の機能と新しい計算式を取り入れた、ユニークで高品質、かつ手頃な価格のトレーディングツールです。たった1枚のチャートで28の為替ペアの通貨強度を読み取ることができます。新しいトレンドやスキャルピングチャンスの引き金となるポイントを正確に特定することができるので、あなたのトレードがどのように改善されるか想像してみてください。 ユーザーマニュアルはこちら  https://www.mql5.com/en/blogs/post/697384 これが最初の1本、オリジナルだ! 価値のないクローンを買わないでください。 特別な サブウィンドウの矢印で強い通貨の勢いを表示 GAPがあなたのトレードを導く! 基準通貨や気配値が売られすぎ・買われすぎのゾーン(外相フィボナッチレベル)にあるとき、個別チャートのメインウィンドウに警告表示。 通貨がレンジの外側から反落した場合、プルバック/リバーサルのアラート。 クロスパターンの特別なアラート 複数の時間枠を選択可能で、トレンドを素早く確認できます
Auto Optimized Parabolic RSI: 高度な3Dモメンタムエンジン ほとんどのリテール向けインジケーターは、市場のボラティリティが変化した瞬間に破綻する静的な入力値に依存しているため、失敗に終わります。Auto Optimized Parabolic RSIは、自らの数学的優位性を継続的に再計算することで「インジケーターの陳腐化」問題を解決し、機関投資家レベルの定量的適応力をMT5ターミナルに直接もたらします。 最大の強み: カスタムインメモリ3D最適化   標準的な自動最適化ツールは、インジケーターの呼び出しで端末に過負荷をかけるため、頻繁にMT5プラットフォームをフリーズさせます。本ツールは、このボトルネックを完全に回避しています。RAMベースのカスタムネイティブ計算機を内蔵した内部エンジンは、チャートを読み込んだりタイムフレームを変更したりするたびに、超高速の3Dグリッド探索を実行します。RSI期間(頻度)、SARステップ(加速度)、SAR最大値(制限速度)を同時にスイープし、プラットフォームを遅延させることなく、数万通りものパラメーターの組み合わせを絶対的
Advanced Supply Demand
Bernhard Schweigert
4.91 (300)
現在40%オフ 初心者にもエキスパートトレーダーにも最適なソリューション このインジケーターは独自の機能と新しい公式を多数内蔵しており、ユニークで高品質かつ手頃な取引ツールです。このアップデートでは、2つの時間枠ゾーンを表示できるようになります。より長いTFだけでなく、チャートTFとより長いTF(ネストゾーンを表示)の両方を表示できます。すべてのSupply Demandトレーダーの皆さんのお気に召すはずです。:) 重要情報の公開 Advanced Supply Demandの可能性を最大化するには、 https://www.mql5.com/ja/blogs/post/720245 にアクセスしてください。   エントリーまたはターゲットの正確なトリガーポイントを正確に特定できれば取引がどのように改善されるか想像してみてください。新しい基盤となるアルゴリズムに基づいて構築されているため、買い手と売り手の間の潜在的な不均衡をさらに簡単に特定できます。これは、最も強い需要と供給のゾーンと、過去のパフォーマンス(古いゾーンを表示)がグラフィカルに表現されるためです。これらの機能は、最適な
このインジケーターは、エリオット波動理論と組み合わせて作動し、2つの方法で使用されます: 自動モード: このモードでは、インジケーターがチャート上の全ての5つのモーティブ波を自動的に検出し、予測とポテンシャルな逆転ゾーンを提供します。また、アラートやプッシュメッセージを生成する能力も備えています。この自動機能により、エリオット波動パターンの識別と分析のプロセスが効率化されます。 手動モード: このオプションは、エリオット波動理論を手動で扱いたいトレーダー向けです。9つの段階を使用して波を描画することができます。各段階は、表示された後に描画されたラインを調整して個別に定義できます。この機能により、手動で波を描画するプロセスがより効率的になります。重要な点として、すべての描画データが将来の参照のためにプラットフォームのデータフォルダに保存されることに注意してください。 パラメータ: Name: インジケーターの名前。 Use_System_Visuals: インジケーターのテーマを有効または無効にして、取引プラットフォーム全体の外観に合わせます。 Explain_Comment: 波の番号
Introduction to Fractal Pattern Scanner Fractal Indicator refers to the technical indicator that makes use of the fractal geometry found in the financial market. Fractal Pattern Scanner is the advanced Fractal Indicator that brings the latest trading technology after the extensive research and development work in the fractal geometry in the financial market. The most important feature in Fractal Pattern Scanner is the ability to measure the turning point probability as well as the trend probabi
Send us a message after your purchase to receive more information on how to get your  BONUS  for FREE  that works in great combination with Bull vs Bear ! Bull versus Bear is an easy-to-use Forex indicator that gives traders clear and accurate signals based on clear trend retests . Forget about lagging indicators or staring at charts for hours because  Bull vs Bear provides real-time entries with no lag and no repaint, so you can trade with confidence. Bull vs Bear  helps you enter trades during
The Propfolio Master Suite is the ultimate all-in-one analytical workstation for professional traders. Combining the power of the Beat The Market Maker (BTMM) methodology, Smart Money Concepts (SND/Liquidity), and Advanced Volume Profile, this suite replaces multiple different indicators with one optimized engine. Monitor up to 14 pairs simultaneously from a single chart, instantly identify market cycles, and seamlessly map institutional footprints with the click of a button. The Command Center
作者のその他のプロダクト
Фрактальная дивергенция - это   скрытая дивергенция, построенная на фракталах Билла Вильямса. Бычья фрактальная дивергенция представляет собой комбинацию из двух нижних фракталов, последний из которых расположен ниже предыдущего, и при этом две свечи справа от минимума последнего фрактала имеют минимумы выше уровня предыдущего фрактала (см. скриншот 1). Медвежья фрактальная дивергенция - это комбинация из двух соседних верхних фракталов, последний из которых расположен выше, чем предыдущий верхн
FREE
A fractal divergence is a hidden divergence , based on Bill Williams' fractals. A bullish fractal divergence is a combination of two lower fractals, the last of which is located below the previous one, and, at the same time, two candles to the right of the Low of the last fractal have Lows higher than the previous fractal level (see screenshot 1). A bearish fractal divergence is a combination of two adjacent upper fractals, the last of which is located above the previous one, but, at the same ti
FREE
The indicator shows the number and ratio of ticks with the price growth and fall for each candle of the chart. The upper part of the histogram in the form of thin lines shows the number of price growth ticks (bullish strength), while the lower part shows the amount of price fall ticks (bearish strength). The thicker histogram bars is the difference between the strength of bulls and bears. A positive difference is displayed in green, and the negative one is red. The strength of bulls increases wh
FREE
Канал фрактальной дивергенции базируется на   паттернах фрактальной дивергенции , представляя их в виде канала, границы которого изменяются в момент появления очередного паттерна. Верхняя граница канала соответствует верхней части последнего найденного медвежьего паттерна фрактальной дивергенции. Нижняя граница канала - это нижняя часть последнего найденного бычьего паттерна (см. скриншот 1). По отношению к индикатору   FractalDivergence_Patterns , канальная версия обладает теми же параметрами,
FREE
The "Chart synchronization" utility (the SynchronizeCharts indicator) can help traders in simultaneous trading on multiple financial instruments, as it automatically scrolls all or selected charts of the terminal according to the position of the master chart.  Four charts are shown in the screenshot 1. The EURUSD chart is the master chart, as the SynchronizeCharts indicator is attached to it. As a result, the other three charts are displayed on the timeline starting from 2017.02.17 23:15. Any fu
The TemplateSwitcher utility allows automatically switching the set of indicators and objects used on the chart depending on the current timeframe and/or symbol. It often happens that an indicator with a certain period is used on a chart of a higher timeframe, while the same indicator with an increased calculation period is required for a smaller timeframe. Of course, it is possible to open two charts of different timeframes with the required indicator periods. But what if duplication of charts
The Expert Advisor generates trading signals based on the values of the FractalDivergence_Patterns indicator. A Buy signal is generated when the indicator detects a support level, and a Sell signal is generated when the resistance level is found (see Fig. 1: blue arrows show buying, red arrows show selling). The Expert Advisor does not require the indicator to be additionally used, and can display the appropriate support and resistance levels. Parameters The "Fractal divergence parameters" bloc
General information The indicator determines the areas of flat and trending market states by comparing the average and current volatilities. Flat areas are rectangles of a user-defined color. It is easy to determine the maximum and minimum of the flat area, as well as its height in points. The beginning of each trend area is marked with an arrow indicating the direction of the trend. Tuning parameters 1. Averaging period - period for calculating average volatility 2. Color of flat region -
The indicator identifies ordered trend structures. Each structure consists of at least three waves: the formation of the primary movement, a rollback, and a breakout of the primary movement. One wave in the structure is considered to be the market movement between opposite price extremes, which corresponded to different positions of the points of the classic Parabolic Support And Reverse (PSAR) indicator relative to the closing prices of the candles: a point below the price - searching for a m
Утилита TemplateSwitcher позволяет автоматически переключать набор используемых на графике индикаторов и объектов в зависимости от текущего таймфрейма графика и/или символа. Часто бывает так, что на графике старшего таймфрейма используется индикатор с одним периодом расчета, а для младшего таймфрейма этот же индикатор необходим с увеличенным периодом расчета. Можно, конечно же, открыть два графика разных таймфреймов с нужными периодами индикатора. Но что, если мы не можем позволить себе дублиров
フィルタ:
レビューなし
レビューに返信