TSO Stochastic RSI
- 지표
-
Dionisis Nikolopoulos
 We are a small team of individuals with a strong passion for trading.
Our research is focused in the area of trading methods and mechanical trading systems
developed on the MT4 and MT5 trading platforms.
Many more features will be coming in the future, so stay with us! - 버전: 1.15
- 업데이트됨: 29 6월 2019
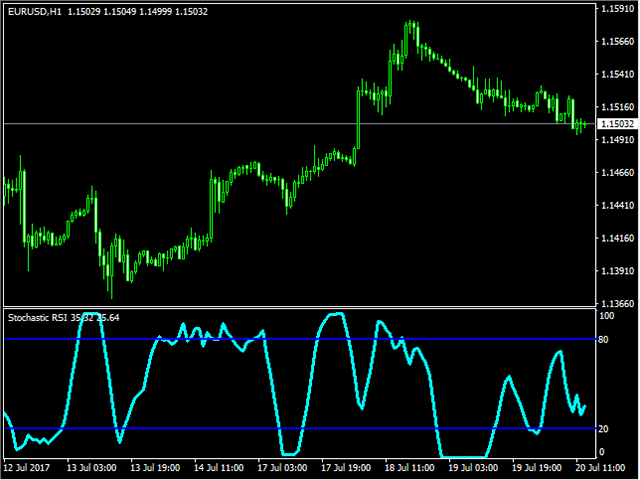
Stochastic RSI makes a stochastic calculation on the RSI indicator. The Relative Strength Index (RSI) is a well known momentum oscillator that measures the speed and change of price movements, developed by J. Welles Wilder.
Features
- Find overbought and oversold situations.
- Sound alert when overbought/oversold level is reached.
- Get email and/or push notification alerts when a signal is detected.
- The indicator is non-repainting.
- Returns buffer values for %K and %D to be used as part of an EA . (see below)
Basic Strategy
- Look for shorts when the price rises above the upper boundary.
- Look for longs when the price falls below the lower boundary.
Inputs
- RSI Period: Typically set to 14
- %K period: Typically set to 8
- %K Smoothing Period: Set to 1 for the default %K calculation. Set a higher value to have %K smoothed using an X-period Simple Moving Average (SMA). This also affects %D since it is the SMA of %K.
- %D period: Typically set to 5
For EA Developers
The indicator can be easily used as part of an EA.
- Buffer for %D value = 0
- Buffer for %K value = 1


I too used this indicator, and I Love it! Can´t thank you enough for sharing it with us.But, Can you tell me if there is any way of getting the "source code"(MQL File) for it?