Heiken Ashi Multicurrency
- Indikatoren
- Version: 1.24
- Aktualisiert: 24 Juli 2024
- Aktivierungen: 7

Beschreibung
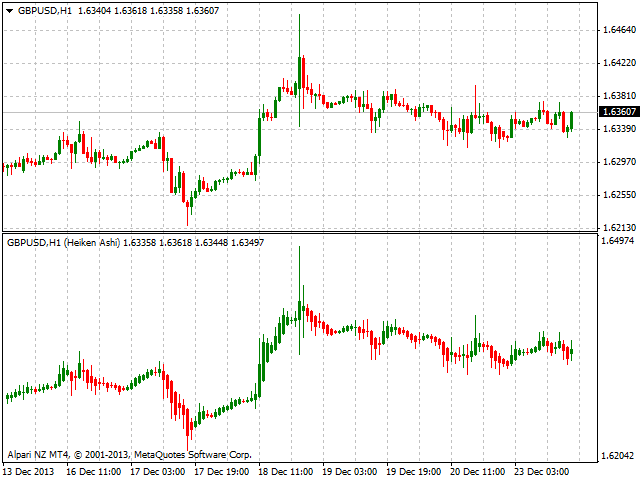
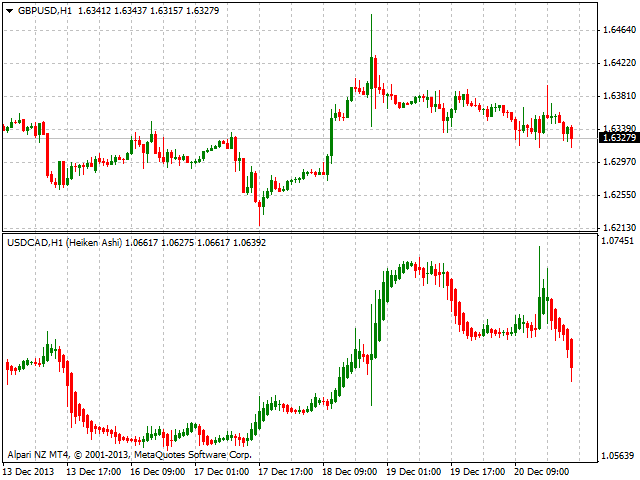
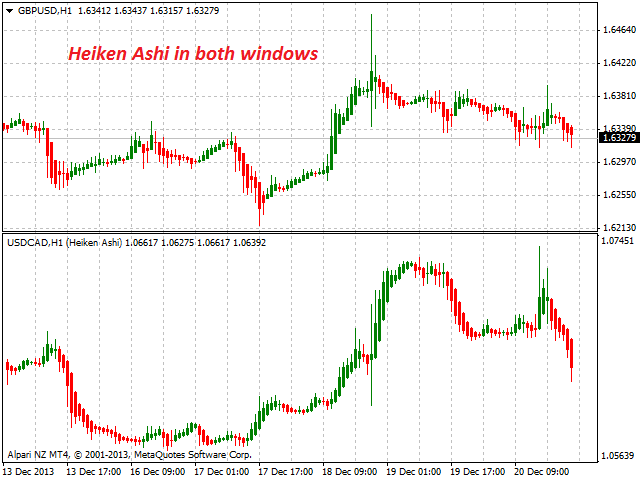
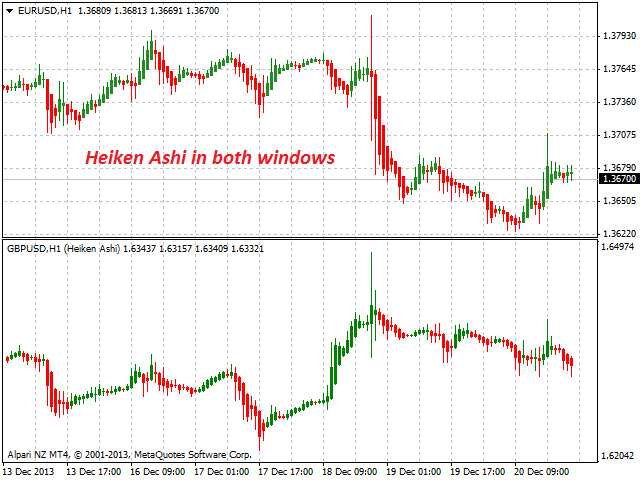
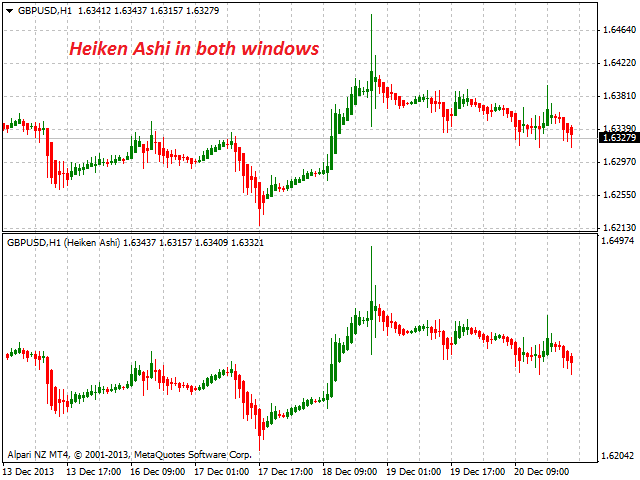
Heiken Ashi Multicurrency ist ein farbiger bekannter Multicurrency/Multisymbol-Indikator. Er zeigt ein Finanzinstrument als geglätteten Candlestick-Chart in einem separaten Fenster unterhalb des Charts des Hauptfinanzsymbols an.
Der Indikator kann mit jedem Broker verwendet werden, unabhängig vom Namen des Finanzinstruments, da die manuelle Eingabe des Namens als Eingabeparameter notwendig ist. Wenn Sie einen nicht existierenden oder falschen Namen eines Finanzinstruments eingeben, erhalten Sie eine Fehlermeldung, dass dieses Finanzinstrument unbekannt ist (nicht existiert).
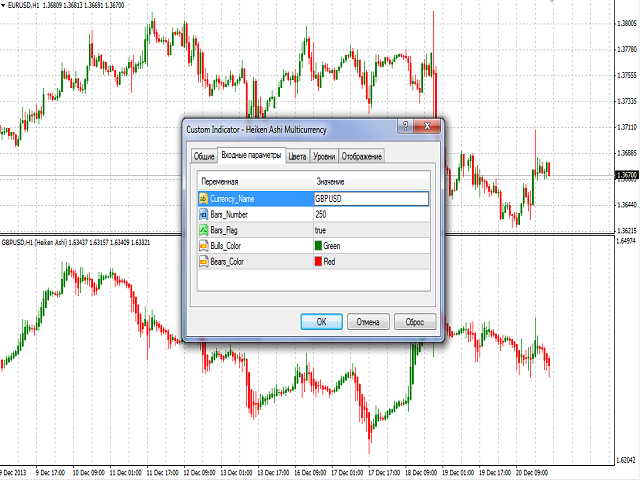
Sie können die Anzahl der angezeigten Candlesticks einstellen sowie die bullische und bärische Färbung auswählen.
Zweck
Der Indikator kann sowohl als visuelles Werkzeug für die Intermarket-Analyse (Konvergenz und/oder Divergenz) als auch als eigenständiges Candlestick-Tool für den Handel mit Symbolen mit starker Volatilität verwendet werden.
Eingaben
- Währung_Name - der Name des Finanzinstruments.
- Bars_Number - die Anzahl der Bars, die in einem separaten Fenster angezeigt werden sollen.
- Bars_Flag - ein Flag, das die Anzeige der im Parameter Bars_Number angegebenen Anzahl von Bars erlaubt:
- true - entsprechend Bars_Number.
- false - maximal verfügbare Balken in der Historie.
- Bulls_Color - die Farbe des bullischen Candlesticks.
- Bears_Color - die Farbe der bearish candlestick.
Verwendung
Der Indikator kann für den manuellen oder automatisierten Handel in einem Expert Advisor verwendet werden. Werte von Indikatorpuffern des Typs Double können für den automatisierten Handel verwendet werden:
- Heiken Ashi Price: Low или High - Puffer 2.
- Heiken Ashi Preis: Hoch или Tief - Puffer 3.
- Heiken Ashi Preis: Open - Puffer 4.
- Heiken Ashi Preis: Close - Puffer 5.
Wenn der Wert von Puffer 2 > Puffer 3 ist, enthält Puffer 2 den Hochkurs, andernfalls ist der Wert von Puffer 2 gleich dem Tiefkurs.
Beschränkungen
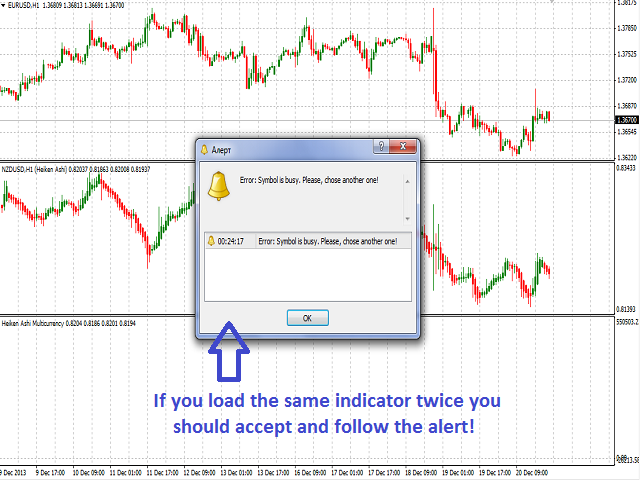
Der Chart für jedes Finanzinstrument kann nur einmal angezeigt werden. Andernfalls erhalten Sie eine Fehlermeldung in Bezug auf die Wiederverwendung und werden aufgefordert, ein anderes Finanzinstrument auszuwählen.
Damit der Indikator funktioniert, müssen mindestens 10 Balken für das Finanzinstrument vorhanden sein. Andernfalls wird eine Fehlermeldung angezeigt, die Ihnen vorschlägt, die Datenbank für die Kurshistorie zu aktualisieren.
Empfehlungen
Es wird empfohlen, den Indikator mit dem Parameter Bars_Number zu verwenden, der die Anzahl der Balken, die in einem Fenster angezeigt werden können, nicht überschreitet (etwa 250 Balken).
Hinweise
Im Falle eines Verbindungsverlustes mit dem Handelsserver wird das Diagramm nach Wiederherstellung der Verbindung und dem Herunterladen der Daten von Anfang an bis zu der durch Bars_Number und Bars_Flag festgelegten Anzahl von Bars neu gezeichnet.