Smoothed Moving Averages Convergence Divergence
- Indikatoren
- Version: 1.0

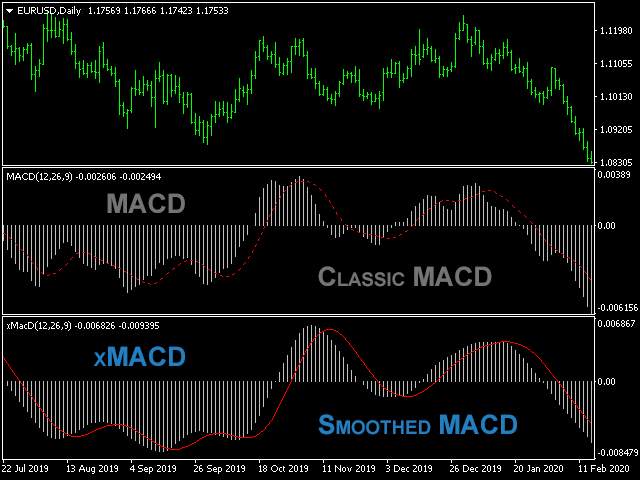
Geglätteter MACD-Indikator (xMACD)
Eingabeparameter:
- Schnelle EMA-Periode - Periode des schnellen EMA
- Slow EMA Periode - Per iode des langsamen EMA
- Signal SMA Periode - Periode des Signal SMA
- Angewandter Preis - Preistyp (0 - CLOSE | 1 - OPEN | 2 - HIGH | 3 - LOW | 4 - MEDIAN | 5 - TYPICAL | 6 - WEIGHTED).
Funktionsweise
Der Indikator berechnet den technischen Standardindikator MACD neu (er mittelt die erhaltenen Werte zweimal).
Der Indikatorpuffer wird nicht neu gezeichnet.