Neue technische Indikatoren für den MetaTrader 4 - 34
Dieser Indikator ist für die bequeme und schnelle Erstellung von Screenshots von Charts im Handelsterminal konzipiert. Er vereinfacht den Prozess des Speicherns von Charts in einem bestimmten Verzeichnis erheblich und bietet eine bequeme Schnittstelle mit einer Schaltfläche auf dem Chart, die mit einem einzigen Klick aktiviert wird.
Die Hauptfunktionen des Indikators sind:
Automatische Erstellung eines Chart-Screenshots, wenn die Schaltfläche gedrückt wird. Möglichkeit, ein Verzeichnis zum Sp
FREE
Dieser Indikator vereinfacht die Erstellung von Chartvorlagen, indem er es Ihnen ermöglicht, die aktuellen Charteinstellungen mit nur einem Klick auf eine Schaltfläche in einer Vorlage zu speichern. Der Indikator fügt eine Schaltfläche direkt in das Diagramm ein, die automatisch die Vorlage mit einem bestimmten Namen und Präfix speichert, was die Organisation und Verwendung von Vorlagen erleichtert.
Die Hauptfunktionen des Indikators sind:
Erstellung einer Vorlage des aktuellen Charts mit ein
FREE
Dieser Scanner zeigt die Kreuzung der verschiedenen TDI-Elemente an: PriceLine, Trade Signal Line und Market Base Line Und um Warnungen zu erhalten, so dass Sie darauf vorbereitet sein können, gute Handels-Setups zu finden, bevor sie passieren. Er zeigt auch TDI-Signale, Trend, Volatilität und verschiedene Zeitrahmenausrichtungen an.
Ausführlicher Blog-Beitrag:
https://www.mql5.com/en/blogs/post/759050
Merkmale: TDI-Signal und Trend anzeigen Volatilität und Überkauft/Überverkauft anzeigen Zei
Der FVG-Zonenindikator ist ein leistungsstarkes Tool zur Erkennung von Fair Value Gaps (FVG) auf dem Markt und hebt Preisungleichgewichte zwischen fairem Wert und Marktpreis hervor. Diese präzise Identifizierung von Lücken ermöglicht es Händlern, potenzielle Markteinstiegs- und -ausstiegspunkte zu erkennen, was ihre Fähigkeit, fundierte Handelsentscheidungen zu treffen, erheblich verbessert. Mit seiner intuitiven und benutzerfreundlichen Oberfläche durchsucht der FVG Zone Indicator Charts au
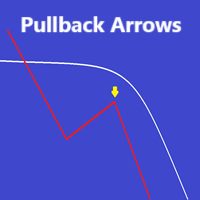
Der Indikator bietet Kauf- und Verkaufspfeile mit einem gleitenden Durchschnitt und einer Balkenfarbe basierend auf dem EMA
Über dem gleitenden Durchschnitt werden nur Kaufpfeile und unter dem gleitenden Durchschnitt nur Verkaufspfeile angezeigt
Die Pfeile basieren auf einem Umkehralgorithmus und versuchen daher, die Rückzugspunkte zu finden
Benachrichtigungen können nach Wunsch aktiviert werden
Geeignet für jeden Zeitrahmen oder jedes Instrument Ihrer Wahl
Bitte testen Sie vor d

Filtern Sie kleine Preisschwankungen heraus und konzentrieren Sie sich auf den größeren Trend . Der Renko-Chart-Indikator hilft Ihnen, kleinere Preisschwankungen zu filtern, damit Sie sich auf den allgemeinen Trend konzentrieren können. Der Preis muss sich um einen bestimmten Betrag bewegen, um einen Renko-Block zu erzeugen. Dies erleichtert die Erkennung der aktuellen Trendrichtung, in die sich der Preis bewegt. Multifunktionales Tool : enthält 66+ Funktionen | Kontaktieren Sie mich bei Fr

Um Zugang zum TD sequentiellen Scanner für MT5 zu erhalten, besuchen Sie bitte https://www.mql5.com/en/market/product/123369?source=Site+Market+My+Products+Page . Eine der MT5-Versionen enthält zusätzliche Zeitrahmen wie M1, M2, M3, H2, H6, H8 usw. (https://www.mql5.com/en/market/product/123367?source=Site+Market+My+Products+Page ) TD Sequential Scanner: Ein Überblick Der TD Sequential Scanner ist ein leistungsfähiges technisches Analysewerkzeug, das entwickelt wurde, um potenzielle Preiserschöp

DER INDIKATOR MIT EINEM DOPPELTEN GLEITENDEN DURCHSCHNITT (MA).
Empfehlungen : Der Indikator funktioniert besser, wenn zwei Linien zur gleichen Zeit die gleiche Farbe haben. (wenn eine grün und die andere rot ist, befindet sich der Preis in der flachen Zone (es ist besser, nichts zu tun)).
Eingabeparameter :
1. Die Periode des ersten und zweiten MATCH. 2. Die Dicke der Linie des ersten und zweiten MATCH. 3. Die Farbe der Linie des ersten und zweiten MATCH.
Suchen Sie einen guten Broker? D
FREE
Order Block Tracker ist dazu da, eine der größten Herausforderungen für Händler zu lösen: das Erkennen von Orderblöcken. Viele Händler versäumen es, diese kritischen Zonen zu erkennen, und verpassen oft wichtige Markteintritte. Mit Order Block Tracker müssen Sie sich darüber keine Gedanken mehr machen. Dieser fortschrittliche Indikator hebt diese entscheidenden Zonen automatisch für Sie hervor und gibt Ihnen die Sicherheit, zum richtigen Zeitpunkt in den Markt einzusteigen. MT5 Version - https:/
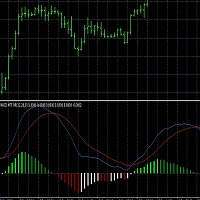
Dieses Skript erzeugt einen MACD mit 6 farbcodierten Histogrammbalken , die auf der Position (über oder unter Null) und der Richtung (steigend oder fallend) des Histogramms basieren. Es bietet Unterstützung für mehrere Zeitrahmen , so dass Benutzer den MACD aus verschiedenen Zeitrahmen in einem einzigen Diagramm anzeigen können. Der Indikator verwendet anpassbare Einstellungen für MACD-Perioden, Histogrammbreite und vertikale Skalierung. Dieses Skript könnte für Händler nützlich sein, die einen
FREE
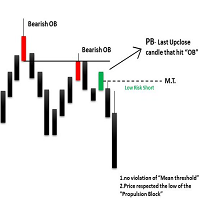
Der ICT Propulsion Block-Indikator dient der Erkennung und Hervorhebung von Propulsion Blocks, d.h. von spezifischen Preisstrukturen, die vom Inner Circle Trader (ICT) eingeführt wurden. Hinweis: Dies ist die MTF-Version, die Single-Timeframe-Version finden Sie hier
Propulsion Blocks sind im Wesentlichen Blöcke, die sich dort befinden, wo Preise mit vorhergehenden Orderblöcken interagieren. Händler nutzen sie häufig bei der Analyse von Kursbewegungen, um potenzielle Wendepunkte und Marktverhal

Der Indikator CYCLE WAVE OSCILLATOR ist ein Indikator, der auf zyklischen Kursschwankungen basiert. Dieser Indikator kann Ihnen helfen, überkaufte und überverkaufte Niveaus zu bestimmen und Preistrends innerhalb des Zyklus vorherzusagen. MT5-Version hier! Sie können diesen Indikator mit unseren untenstehenden Indikatoren kombinieren, um Ihre Handelsentscheidungen zu präzisieren: Angebot-Nachfrage-Band MT4 Basic
Merkmal: - Drei Trendtypen: + Null + Grundlegend + Erweitert
FREE

Dieser Scanner verwendet die Quarters-Theorie. Er findet die nächstgelegenen Quartale zum aktuellen Kurs. Und wenn der Preis bis auf wenige Punkte herankommt, wird er hervorgehoben und sendet Warnungen. Merkmale: Definieren Sie den Abstand der wichtigsten Quartale für jeden Zeitrahmen Option zur Verwendung: Halber Punkt zwischen Hauptkursen Quarters zwischen Half Point und Majors Suche nach dem nächstgelegenen Viertelpunkt und Preis Highlight anzeigen und Warnungen senden Viertel-Linien anzeigen

Der Real Cloud Indikator für MT4 ist ein beliebter und nützlicher Forex-Indikator. Dieser Indikator bietet Händlern eine einfache Möglichkeit, potenzielle Handelsmöglichkeiten auf dem Forex-Markt zu identifizieren. Der Real Cloud-Indikator verwendet einen einzigartigen Algorithmus, um die Preisbewegung zu analysieren und Signale zu generieren. Er wurde entwickelt, um starke Trends zu erkennen und Händlern einen Vorteil bei ihrem Handel zu verschaffen. Der Real Cloud-Indikator ist einfach zu verw

Merkmale:
Sharkfin-Warnungen Mehrere Zeitrahmen Mehrere Währungen SM TDI: Zur Anzeige von TDI-Linien mit Sharkfin-Levels Zigzag MTF: Zur Anzeige des Trends im höheren Zeitrahmen Ausführlicher Blogbeitrag und Extras: https://www.mql5.com/en/blogs/post/759138
Arrows funktioniert auf einem einzigen Zeitrahmen und einer einzigen Währung. Aber es ist visuell hilft sehen, dass sharkfins. Sie können auch die einfachen Pfeile von mql5 Website Produkt: https://www.mql5.com/en/market/product/42405
Über
Order-Blöcke Mtf-Indikator baut Ebenen auf der Grundlage von smart mony(smart money) Bildet Niveaus, die unmittelbar nach einem Trendbruch eintreten, der Indikator ist sehr bequem und praktisch für den Einsatz auf Forex und binäre Optionen. Es hat ein System der Suche nach Signalen auf Berührung Senior Ebenen sowie Trend Break Ebenen und Retesting auf den durchschnittlichen Wert. Bei Berührung einer Ebene funktioniert sehr gut auf binäre Optionen,

Dynamic Forex28 Navigator – Das Forex-Handelstool der nächsten Generation AKTUELL 49 % RABATT. Dynamic Forex28 Navigator ist die Weiterentwicklung unserer seit langem beliebten Indikatoren und vereint die Leistung von drei in einem: Advanced Currency Strength28 Indicator (695 Bewertungen) + Advanced Currency IMPULSE mit ALERT (520 Bewertungen) + CS28 Combo Signals (Bonus) Details zum Indikator https://www.mql5.com/en/blogs/post/758844
Was bietet der Strength Indicator der nächsten Generation?

Der Indikator misst das Ungleichgewicht zwischen Bullen und Bären über einen bestimmten Zeitraum und zeigt eine gerade Linie zwischen den beiden Punkten.
Wenn die Bullen mehr Volumen haben als die Bären, wird die Linie grün. Wenn die Bären mehr Volumen haben, ist sie rot. Die Linie zeigt auch den prozentualen Unterschied im Volumen an.
Der Indikator zeigt die gleichen Daten in einem separaten Fenster an. Sie können auch das geteilte Volumen sehen.
Der Indikator hat zwei Modi.
Zu diesem Zw
Die präzisen Ziele von GANN werden basierend auf seinen bewährten Methoden berechnet und direkt vor Ihnen angezeigt. Dieses Tool wurde entwickelt, um das Trading einfacher und intuitiver zu gestalten. Wenn Sie die weiße Linie nach oben oder die grüne Linie nach unten ziehen, werden Sie sofort verstehen, warum GANNs Techniken in der Welt des Tradings nach wie vor einflussreich sind. GANNs Strategien konzentrieren sich darauf, Marktbewegungen mit hoher Genauigkeit vorherzusagen, und dieses Tool br

Verbessern Sie Ihr Handelserlebnis mit dem Your Chart Indikator! Dieses kostenlose und hochgradig anpassbare Tool ermöglicht es Händlern, mehrere Zeitrahmen in einer einzigen, übersichtlichen Kerzendarstellung zusammenzuführen, ohne das Originalchart zu verändern. Mit Your Chart können Sie die Anzahl der Balken pro benutzerdefinierter Kerze einstellen – zum Beispiel jede 18 M1-Kerzen in eine zusammenfassen, um einen umfassenderen Blick auf die Markttendenzen zu erhalten. Hauptmerkmale: Benutzerd
FREE

CVB Cumulative Volume Bands: Maximieren Sie Ihre Trades mit kumuliertem Volumen! Der CVB Cumulative Volume Bands ist ein fortschrittlicher Indikator, der für Trader entwickelt wurde, die präzise Signale auf Basis des kumulierten Volumens suchen. Durch die Nutzung von kumulierten Volumenbändern bietet dieser Indikator klare Einblicke in den Kauf- und Verkaufsdruck am Markt, um Umkehrungen und starke Kursbewegungen zu identifizieren. Cumulative Volume Bands for MT5 !
Hauptmerkmale:
Stochastic Multicurrency Scanner Dashboard MT4 ist ein leistungsstarkes Tool, das entwickelt wurde, um mehrere Währungspaare und Zeitrahmen mithilfe des Stochastik-Oszillators zu überwachen. Es organisiert Signale in einem Rasterformat und zeigt den Status jedes Symbols in Zeitrahmen von M1 bis MN1 an. Trader können bestimmte Zeitrahmen aktivieren oder deaktivieren, um sie an ihre Strategien anzupassen. Die MT5-Version ist hier verfügbar: Stochastic Oscillator Multicurrency Scanner MT5 Für detai

Zen Market Flow - MTF SuperTrend
Der MTF SuperTrend ist ein System, das auf jeder Zeiteinheit verwendet werden kann. Dieser Multi-Zeitrahmen-Indikator zeigt Signale von 1 bis 3 Zeiteinheiten gleichzeitig an und zeigt deren Ausrichtung an.
Wenn Ihnen der SuperTrend-Indikator gefällt, werden Sie diese Version lieben.
Sie können die Signale und Zeichnungen des Indikators auch im Backtest testen, wo Sie Multi-Zeitrahmen-Signale anzeigen lassen können.
Der Indikator liefert Signale, wenn alle Ze
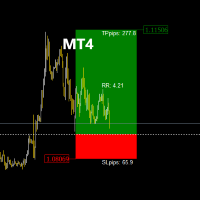
RR_TradeManager Visualizer ist ein Handelsmanagement-Tool, das für Händler entwickelt wurde, die ihre Gewinnziel- (TP) und Stop-Loss- (SL) Ebenen einfach auf einem Chart visualisieren möchten. Diese erste Version bietet eine einfache grafische Darstellung, die die SL- und TP-Zonen sowie den Einstiegspreis anzeigt. Bitte beachten Sie, dass sich diese aktuelle Version ausschließlich auf die grafische Darstellung der SL- und TP-Zonen als Figuren auf dem Chart konzentriert. Aktuelle Version: Funktio
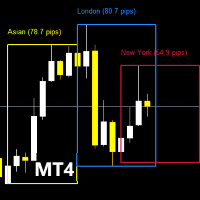
Bevor Sie sich mit den Funktionen dieses Indikators vertrautmachen, denken Sie bitte daran, dieses Produkt zu bewerten, einen Kommentar zu hinterlassen, um Ihre Erfahrungen zu teilen, und sich auf meiner Seite anzumelden, um über die neuesten Updates und neuen Tools informiert zu bleiben. Ihre Unterstützung ist unschätzbar und hilft mir, meine Kreationen kontinuierlich zu verbessern! Beschreibung: TradingSessionPipsVisualizer - Das professionelle Tool zur Beherrschung der Handelssitzungen Visua
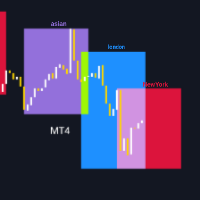
Bevor Sie die Funktionen dieses Indikators erkunden, bewerten Sie bitte dieses Produkt, hinterlassen Sie einen Kommentar zur Ihrer Erfahrung und abonnieren Sie meine Seite, um über die neuesten Veröffentlichungen und Werkzeuge informiert zu bleiben. Ihre Unterstützung ist wertvoll und hilft mir, meine Kreationen ständig zu verbessern! Beschreibung: Der TradingSessionVisualizer ist ein leistungsstarker Indikator für MetaTrader 4, der eine klare und anpassbare Visualisierung der wichtigsten Handel
FREE
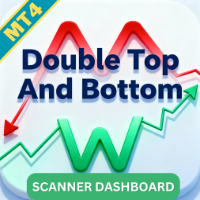
Willkommen zur verbesserten Mustererkennung mit dem Double Top and Bottom Pattern Scanner ! Transformieren Sie Ihren Handelsansatz mit diesem leistungsstarken MT4-Indikator, der für effizientes Pattern-Scanning und umsetzbare Alarme entwickelt wurde. Hauptmerkmale: Erweiterte Zig Zag-Mustererkennung : Der Double Top and Bottom Pattern Scanner nutzt das Zick-Zack-Muster, um Tops und Bottoms zu erkennen. Er identifiziert Punkte, an denen der Kurs nach einem langen Trend zweimal vom gleichen Nivea

Der Block Master Pro-Indikator wurde entwickelt, um visuell Bereiche auf dem Chart zu identifizieren, in denen sich wahrscheinlich bedeutende Volumina von großen Marktteilnehmern konzentrieren. Diese Bereiche, die als Orderblöcke bezeichnet werden, stellen Preisbereiche dar, in denen große Marktteilnehmer ihre Orders platzieren und damit möglicherweise eine Preisumkehr und eine Bewegung in die entgegengesetzte Richtung signalisieren. Hauptmerkmale:
Identifizierung von Orderblöcken: Block Master

Ein unausgeglichener Balken oder eine unausgeglichene Kerze, auch Fair-Value-Gap (FVG) oder Ineffizienz genannt, zeigt starke Käufe oder Verkäufe auf dem Markt oder schwache Käufe oder Verkäufe, die zu schnellen Kursbewegungen mit hoher Dynamik führen. Aus diesem Grund ist er ein wichtiger Bestandteil der Preisaktionsanalyse. Unser Indikator bietet drei Hauptvorteile: Klares Design: Der Ungleichgewichtsbalken ist in die Kerze integriert und hat ein einfaches, klares Aussehen, das es Händlern lei
FREE

Gold Pro Scalper
Präzise Einstiegspunkte für Währungen, Krypto, Metalle, Aktien, Indizes! Indikator 100% nicht nachgemalt!!!
Wenn ein Signal erschienen ist, verschwindet es nicht! Im Gegensatz zu Indikatoren mit Redrawing, die zum Verlust der Einlage führen, weil sie ein Signal zeigen können, und dann entfernen Sie es.
Der Handel mit diesem Indikator ist sehr einfach.
Warten Sie auf ein Signal des Indikators und tätigen Sie das Geschäft entsprechend dem Pfeil
(Blauer Pfeil - Kaufen, Roter

Der Indikator berechnet eine Kombination aus zwei gleitenden Durchschnitten und zeigt deren Trend in abgeleiteten Einheiten an. Im Gegensatz zu traditionellen Oszillatoren entsprechen die Höchst- und Mindestwerte in diesem Indikator immer der Anzahl der Balken, die Sie verfolgen möchten. Dadurch können Sie unabhängig von der Volatilität und anderen Faktoren benutzerdefinierte Werte verwenden. Die Maximal- und Minimalwerte sind immer statisch und hängen nur von den anfänglichen Einstellungen der
FREE
Dieser Indikator hilft Ihnen, die Horizontlinien ( Marcelo Ferreira ) auf dem Wochenchart zu zeichnen. Sie können z.B. auf M5 oder M15 umschalten. Die wöchentlichen Linien bleiben dabei erhalten. Die Analyse von Trends auf Wochencharts vor dem Einstieg in den Devisenmarkt ist unerlässlich, um die vorherrschende langfristige Richtung des Marktes zu erkennen. Diese Art der Analyse hilft, impulsive Entscheidungen auf der Grundlage kurzfristiger Schwankungen zu vermeiden, und bietet einen klareren Ü
FREE

Dies ist ein sehr einfacher Indikator für mehrere gleitende Durchschnitte.
Er kann 12 gleitende Durchschnitte anzeigen. Die Zeitachse der gleitenden Durchschnitte kann im Eingabefeld des Indikators geändert werden. Der Prozess ist schneller als die 12 gleitenden Durchschnitte, die in MT4 enthalten sind.
Wir haben auch einen Puffer eingerichtet, damit Sie von einem Expert Advisor darauf zugreifen können. *Für fortgeschrittene Benutzer.
Wenn Sie Fragen oder Wünsche haben, senden Sie mir bitte
FREE
Der Indikator zeigt die vier wichtigsten Handelssitzungen an: New York London Sydney
Tokio Der Indikator berechnet automatisch die GMT-Zeit. Der Indikator hat Puffer, die verwendet werden können, um die aktuelle Session und die GMT zu erhalten.
Sie können den Indikator als eigenständigen Indikator verwenden und Sie können die Zeichnung ausschalten und ihn von Ihrem EA aus aufrufen. INPUTS Maximaler Tag: Maximale Anzahl der Tage, die zurückliegen, um die Daten zu erhalten/zu zeichnen. London Sess
FREE

Dies ist ein umfassendes Dashboard mit mehreren Zeitrahmen und Indikatoren , das Ihre Handelserfahrung vereinfachen und verbessern soll. Das Dashboard bietet Echtzeit-Einblicke über mehrere Währungspaare und Zeitrahmen und hilft Händlern, die Marktbedingungen schnell zu beurteilen und fundierte Entscheidungen zu treffen. Mit einer benutzerfreundlichen Oberfläche, anpassbaren Einstellungen und einer soliden Auswahl an Indikatoren ist dieses Tool eine unverzichtbare Ergänzung für das Arsenal eine
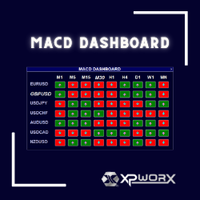
Vereinfachen Sie Ihren Handel mit dem MACD Dashboard
Sind Sie es leid, mit mehreren MetaTrader-Charts zu jonglieren, um den MACD über verschiedene Zeitrahmen und Symbole hinweg zu überwachen? Das MACD Dashboard ist die Lösung, auf die Sie gewartet haben. Dieser innovative MetaTrader-Indikator bietet eine zentrale Ansicht der MACD-Signale auf mehreren Charts und macht es einfacher denn je, Handelsmöglichkeiten zu erkennen und Ihr Risiko zu kontrollieren.
Hauptmerkmale: Multi-Timeframe-Überwach
Dies ist die Multiple Timeframe Version von Malaysia SNR Levels und Storyline. Die Version mit einem Zeitrahmen hier Merkmale: + Anzeige des Niveaus in mehreren Zeitrahmen (höher oder niedriger) + Pegel auf Zeitrahmen ein-/ausschalten + Warnung, wenn der Preis das Niveau berührt 1. wenn das Hoch > Widerstandsniveau, aber der Kerzenschluss < Widerstandsniveau ist, wird dieses Niveau ungültig - der Name des Niveaus wird mit "(m)" gekennzeichnet, was "abgemildert" bedeutet wenn Kerzenschluss > Wide
Dieser Indikator verwaltet alle Arten von ICT FVG, einschließlich: FVG, SIBI, BISI, Inverse FVG. Der Vorteil dieses Indikators besteht darin, dass er die FVG in allen Zeiträumen misst. FVG - Marktwertlücke ICT Fair Value Gap findet sich in einer "Drei-Kerzen-Formation" in der Art, dass die mittlere Kerze eine große Kerze mit dem meisten Körperbereich ist und die Kerzen über und unter dieser Kerze kurz sind und den Körper der mittleren Kerze nicht vollständig überlappen. * Dieser Indikator erlau
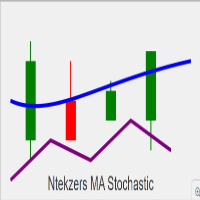
Bitte denken Sie daran, eine Bewertung für Verbesserungen zu hinterlassen. Überblick über die wichtigsten Funktionen: Kaufsignal Bedingungen : Die Hauptlinie des Stochastik Oszillators kreuzt über der Signallinie. Der Schlusskurs der aktuellen Kerze ist höher als der Schlusskurs der vorherigen Kerze. Der aktuelle Schlusskurs liegt über dem EMA (Exponential Moving Average). Der Stochastik-Wert liegt unter 50. Wenn diese Bedingungen erfüllt sind, wird ein Kaufpfeil eingezeichnet, und es werden Ala
FREE

Trend Cutter ist ein Trendindikator, der für jeden Zeitrahmen verwendet werden kann, einschließlich der niedrigeren Zeitrahmen wie M1 und M5. Der Indikator ist ideal für Händler, die den Intraday-Handel bevorzugen, und wird auch für diejenigen hilfreich sein, die den langfristigen Handel bevorzugen. Sie können diesen Indikator als Basis für Ihr Handelssystem oder als eigenständige Handelslösung verwenden. Der Indikator bietet alle Arten von Warnungen, einschließlich PUSH-Benachrichtigungen. Der

Wir stellen das Volume Orderflow Profile vor, ein vielseitiges Tool, das Händlern hilft, die Dynamik des Kauf- und Verkaufsdrucks innerhalb eines bestimmten Rückblickzeitraums zu visualisieren und zu verstehen. Perfekt für alle, die einen tieferen Einblick in das volumenbasierte Marktverhalten gewinnen möchten! MT5-Version - https://www.mql5.com/en/market/product/122657 Der Indikator sammelt Daten zu Höchst- und Tiefstkursen sowie Kauf- und Verkaufsvolumina über einen benutzerdefinierten Zeitrau

Der Stratos Pali-Indikator ist ein revolutionäres Instrument zur Verbesserung Ihrer Handelsstrategie durch die genaue Erkennung von Markttrends. Dieser hochentwickelte Indikator verwendet einen einzigartigen Algorithmus, um ein vollständiges Histogramm zu erstellen, das aufzeichnet, wann der Trend Long oder Short ist. Bei einer Trendumkehr erscheint ein Pfeil, der die neue Richtung des Trends anzeigt.
Wichtige Informationen aufgedeckt Hinterlassen Sie eine Bewertung und kontaktieren Sie mich p

ATR-Bänder mit Take-Profit-Zonen für MT4 Der ATR-Bands-Indikator für MT4 wurde entwickelt, um Händler beim Risikomanagement und der Steuerung der Marktvolatilität zu unterstützen. Durch die Verwendung der Average True Range (ATR) hilft er, wichtige Kursniveaus zu identifizieren und realistische Stop-Loss- und Take-Profit-Zonen festzulegen. Hauptmerkmale: ATR-basierte Bänder : Der Indikator berechnet anhand der ATR dynamische obere und untere Bänder. Diese Bänder passen sich an die Preisvolatilit
FREE

Dieser Indikator ist ein bestimmter Algorithmus und fungiert als Marktscanner. Alles, was Sie tun müssen, ist, die ausgewählten Währungspaare in den Einstellungen einzugeben, und das war's. Danach wird der Indikator selbst alle diese Währungspaare und Zeitrahmen von M5 bis D1 gleichzeitig anzeigen. Wenn ein neues Signal auftaucht, gibt der Indikator eine Warnung aus und zeichnet außerdem den Buchstaben N an der Stelle, an der sich das neue Signal befindet.
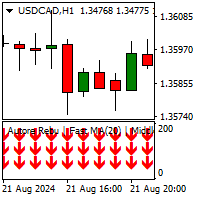
Der MovingAverageTrends-Indikator ist ein technisches Analyseinstrument, mit dem die allgemeine Marktrichtung ermittelt und Kauf- oder Verkaufssignale gegeben werden können. Der Indikator verwendet drei gleitende Durchschnitte, für die unterschiedliche Zeiträume festgelegt werden können. Wie er funktioniert Bullische Bedingungen: Der Indikator zeigt drei grüne Aufwärtspfeile an, wenn alle drei gleitenden Durchschnitte aufwärts tendieren. Dieses Signal deutet darauf hin, dass sich der Markt in ei
Engulfing Pattern ist ein kostenloser Indikator, der für die Plattformen MT4/MT5 verfügbar ist. Seine Aufgabe ist es, "Alarme" zu liefern, wenn sich ein "Bullish" oder "Bearish engulfing pattern" auf dem Zeitrahmen bildet. Dieser Indikator verfügt über Alarmoptionen, die im Abschnitt "Parameter" unten aufgeführt sind. Treten Sie unserer MQL5-Gruppe bei, in der wir wichtige Neuigkeiten und Updates austauschen. Sie können auch gerne unserem privaten Kanal beitreten, kontaktieren Sie mich für den p
FREE

Der Multi Pairs Forex Indicator ist ein fortschrittliches Handelsinstrument , das es Händlern ermöglicht, die Performance mehrerer Währungspaare in Echtzeit auf einem einzigen Chart zu verfolgen und zu analysieren. Der Multi Pairs Forex Indicator konsolidiert die Daten verschiedener Devisenpaare und bietet so einen Überblick über die Marktbedingungen verschiedener Währungen und hilft Ihnen, Zeit zu sparen. Nützlich für verschiedene Handelsstile, einschließlich Scalping, Day Trading und Swing Tr
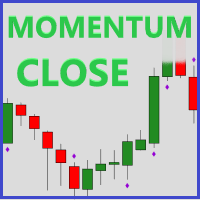
Momentum Close ist ein nützliches Instrument zur Ermittlung des Volumens auf der Grundlage der Stärke eines Kerzenschlusses. Ein starker Kerzenschluss liegt vor, wenn der Docht im Vergleich zum Kerzenkörper klein ist, und ist ein Zeichen dafür, dass der Markt in diese Richtung weitergeht. * Dies ist ein NICHT-nachzeichnender Indikator.
Wie kann dieser Indikator Ihnen helfen? Erkennen der Trendstärke Trendbestätigung Erkennen potenzieller Umkehrungen (starke Ablehnungskerze) Entwicklung von Eins
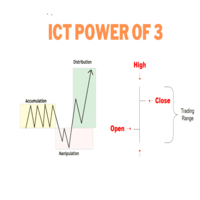
NUR ZU ZEITEN HANDELN, DIE IM SCREENSHOT ZU SEHEN SIND. BEGINNEN, DEN INDIKATOR ZU LADEN, BEVOR DIE BALKEN ZU BERECHNEN, SO DASS ES DIE PHASEN NACH ICT ZEIGT. 1. London Silver Bullet (3:00 AM - 4:00 AM NY Zeit) Vor 3:00 AM : Der Markt befindet sich in der Regel in der Akkumulationsphase vor der Londoner Eröffnung, in der sich der Preis konsolidiert und große Marktteilnehmer Positionen aufbauen. Achten Sie auf diese ruhige Konsolidierung im Vorfeld der Manipulation. 3:00 UHR - 4:00 UHR : Die Man

Im Zusammenhang mit dem Handel bezieht sich Malaysia SNR ( Support and Resistance) auf die technische Analyse von Unterstützungs- und Widerstandsniveaus auf den Finanzmärkten, insbesondere für Aktien, Indizes oder andere gehandelte Vermögenswerte. Es gibt drei Arten von Malaysia SNR-Levels Classic , GAP und Flipped 1. Klassisch Die Unterstützung ist das Preisniveau, bei dem ein Vermögenswert dazu neigt, nicht weiter zu fallen, und möglicherweise wieder zu steigen beginnt. Sie fungiert als "Unter

Fortgeschrittener UT Bot & HTS Indikator Dieser Indikator ist ein fortschrittliches technisches Analyseinstrument, das zwei Methoden kombiniert: UT Bot und HTS (Higher Timeframe Smoothing) , um präzise Kauf- und Verkaufssignale zu generieren. 1. Struktur des Indikators Arbeitet im Hauptfenster des Charts und verwendet 11 Puffer , um verschiedene Datenpunkte zu speichern, darunter Pfeile (Kauf-/Verkaufssignale) und Bänder aus den Systemen UT Bot und HTS. Verwendet farbige Pfeile zur Darstellung

Fortgeschrittener ATR Trailing Stop mit EMA-Filter-Indikator Wir stellen Ihnen den ATR Trailing Stop mit EMA-Filter-Indikator vor, ein leistungsstarkes Tool, das Ihre Handelsstrategie durch fortschrittliche Signalfilterung verbessert. Dieser Indikator kombiniert die Präzision der ATR (Average True Range)-Trailing-Stop-Berechnungen mit der Flexibilität eines EMA (Exponential Moving Average)-Filters und stellt so sicher, dass Sie die besten Gelegenheiten am Markt nutzen. Hauptmerkmale: Zwei Signal

Dieser Indikator (Dashboard) bietet einen Trend für mehrere Währungen auf Charts mit mehreren Zeitrahmen. Es gibt Einträge und Stoploss auf dem Chart selbst Wenn das Währungspaar im Aufwärtstrend ist, wird die Farbe der Zelle als Grün angezeigt, und wenn es im Abwärtstrend ist, zeigt die Zelle die Farbe als Rot an. Wenn die Farbe der Zelle für eine bestimmte Währung Grün ist, bedeutet dies einen starken Aufwärtstrend, und umgekehrt, wenn die Farbe der Zelle Rot ist, bedeutet dies, dass die Währu
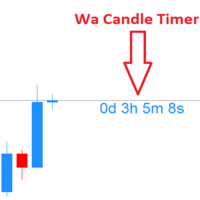
Wa Candle Timer MT4 ist ein leistungsstarker und benutzerfreundlicher Indikator, der die verbleibende Zeit bis zur nächsten Kerze auf deinem MT4-Chart anzeigt. Er unterstützt Trader bei der besseren Überwachung von Kerzenschlusszeiten für präzisere Entscheidungen. Hauptfunktionen :
Countdown-Anzeige für die aktuelle Kerze
Farbwechsel, wenn die verbleibende Zeit unter einen definierten Prozentsatz fällt
Neu in Version 3.00: Anpassbarer Alarm bei Erreichen eines bestimmten Prozentsatzes
FREE
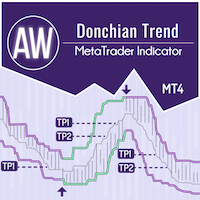
AW Donchian Trend ist ein Trendindikator, der auf dem Donchian-Kanal basiert. Der Indikator kann TakeProfit- und StopLoss-Niveaus berechnen, verfügt über erweiterte Statistiken zum Erfolg von Signalen sowie drei Arten von Benachrichtigungen über das empfangene Signal. Installationshandbuch und Anweisungen - Hier / MT5 Version - Hier So handeln Sie mit dem Indikator: Der Handel mit AW Donchian Trend erfolgt in nur drei einfachen Schritten: Schritt 1 - Eine Position eröffnen Ein Kaufsign
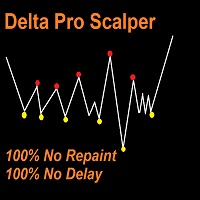
Delta Pro Scalper - Ihre ultimative Lösung für den Trendhandel, Delta Pro Scalper ist ein TREND-Indikator, der den Markt automatisch analysiert und Informationen über den Trend ohne Neuzeichnung oder Verzögerung liefert.
Der Indikator verwendet Candlestick OHLC Daten und analysiert diese, um einen Aufwärts- oder Abwärtstrend zu bestimmen. Sie MÜSSEN bis zur Schlusskerze warten, sobald der Punkt erscheint, können Sie eine Kauf- oder Verkaufsposition eröffnen.
Roter Punkt = Bearish Trend (Open SE

Der Escobar Reversal Indicator konzentriert sich darauf, einzigartige, intelligente Kauf- und Verkaufssignale zu geben. Nebenbei erhalten Sie Stop-Loss-Ziele und verschiedene Take-Profit-Ziele zur Auswahl!
Kommt mit einem eingebauten Trend-Analysator sitzt in der Mitte unter dem Namen, dieser Trend-Analysator kann uns helfen, bestätigen Einträge und erhöhen die Genauigkeit.
Denken Sie daran, dass dies ein guter Indikator mit einfachen Funktionen für Anfänger sein könnte, aber das bedeutet nich
Reversal Zones Pro ist ein Indikator, der speziell für die genaue Identifizierung wichtiger Trendumkehrzonen entwickelt wurde. Er berechnet die durchschnittliche tatsächliche Spanne der Kursbewegung von der unteren bis zur oberen Grenze und zeigt potenzielle Zonen direkt auf dem Chart an, was Händlern hilft, wichtige Trendumkehrpunkte effektiv zu identifizieren. Hauptmerkmale: Identifizierung von Umkehrzonen: Der Indikator zeigt potenzielle Umkehrzonen visuell direkt auf dem Chart an. Dies hilf

!!!Die kostenlose Version funktioniert nur auf "EURUSD"!!! WaPreviousCandleLevels MT4 zeigt die vorherige Kerze Ebenen, es zeigt die vorherige Kerze Open High Low Close Ebenen (OHLC Levels) in verschiedenen Zeitrahmen. Es wurde entwickelt, um dem Händler zu helfen, den Markt zu analysieren und die Aufmerksamkeit auf die vorherigen Kerzenlevel in verschiedenen Zeitrahmen zu richten. Wir alle wissen, dass die OHLC-Levels auf Monats-, Wochen- und Tagesbasis sehr stark sind und dass der Preis in de
FREE

WaPreviousCandleLevels MT4 zeigt die vorherigen Kerzenniveaus, es zeigt die vorherigen Kerzen Open High Low Close Levels (OHLC Levels) in verschiedenen Zeitrahmen. Es wurde entwickelt, um dem Händler zu helfen, den Markt zu analysieren und die Aufmerksamkeit auf die vorherigen Kerzenlevel in verschiedenen Zeitrahmen zu richten. Wir alle wissen, dass die OHLC-Levels auf Monats-, Wochen- und Tagesbasis sehr stark sind und dass der Preis in der Regel stark auf diese Levels reagiert. In der technis
FREE

Smart Fibo Zones sind leistungsstarke, automatisch generierte Fibonacci-Retracements, die an wichtigen Marktstrukturverschiebungen verankert sind. Diese Zonen dienen als kritische Angebots- und Nachfrageniveaus , die Ihnen helfen, potenzielle Preisreaktionen zu erkennen und die Marktrichtung zu bestätigen. Fibonacci-Berechnungen , die von professionellen Händlern häufig verwendet werden, können komplex sein, wenn es darum geht, Hochs und Tiefs zu identifizieren. Smart Fibo Zones vereinfacht dies
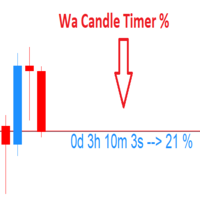
Wa Candle Timer Percentage MT4 ist ein Indikator, der dem Benutzer anzeigt, wie viel Zeit noch verbleibt, bis sich die nächste Kerze bilden wird. Der Prozentsatz der Entwicklung der aktuellen Kerze wird ebenfalls angezeigt. Der Benutzer kann den Prozentsatz festlegen, um den der Candle Timer die Farbe ändert. Dies sind die Einstellungen: 1- Der Prozentsatz, um den der Kerzen-Timer die Farbe ändert. 2- Farbe des Kerzentimers, wenn er UNTER dem vom Benutzer eingestellten Prozentsatz liegt. 3- Far
FREE
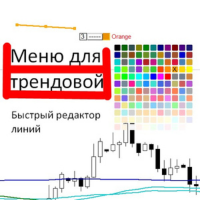
Dropdown-Menü für Trendlinien und Rechtecke. Ermöglicht die Bearbeitung von Farbe, Stil und Dicke. Wenn Sie eine Linie auswählen, erscheint ein Menü, in dem die einzelnen Funktionen getrennt sind. Sie können sofort darauf klicken und zur gewünschten Funktion wechseln. Die Dicke wird anders geändert, Sie müssen auf eine Zahl klicken, sie wird blau, klicken Sie auf die gewünschte Zahl von 1 bis 4, je nach gewünschter Dicke, klicken Sie auf inter.

Volume PRO ist ein innovativer und modernisierter Indikator für die Analyse des Handelsvolumens, der eine fortschrittliche Version der traditionellen Analysetools darstellt. Dieser Hightech-Indikator ermöglicht es Händlern, die Handelsaktivität effektiv zu überwachen, ohne komplexe Berechnungen durchführen zu müssen. Er zeigt die Ticks für das ausgewählte Zeitintervall, das dem ausgewählten Zeitrahmen entspricht, in Form eines dynamischen kumulativen Histogramms an, das in Echtzeit aktualisiert
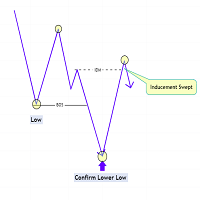
Der Indikator "Market Structure with Inducements & Sweeps" ist eine einzigartige Interpretation der Smart Money Concepts Marktstruktur-Labels, die darauf abzielt, Händlern eine präzisere Interpretation unter Berücksichtigung verschiedener Faktoren zu ermöglichen.
Im Vergleich zu traditionellen Marktstruktur-Skripten, die Change of Character (CHoCH) und Break of Structures (BOS) beinhalten, umfasst dieses Skript auch die Erkennung von Inducements (IDM) und Sweeps, die wichtige Komponenten bei d

Session Standard Deviation Date Range Analyzer: Bewerten Sie die Standardabweichung des Preises jedes Balkens (Höchst-, Tiefst-, Schluss-, Eröffnungs-, gewichteter, mittlerer und typischer Preis) innerhalb definierter Handelssitzungen und Datumsbereiche, um detaillierte Einblicke in die Preisvolatilität und das Marktverhalten zu erhalten. **Hinweis:** Wenn die Handelsplattform geschlossen ist, wird der Indikator möglicherweise nicht korrekt geladen. Um sicherzustellen, dass er funktioniert, müs
FREE
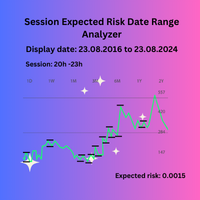
Session Expected Risk Date Range Analyzer: Analysiert Kursdaten über bestimmte Datumsbereiche, um detaillierte Einblicke in das finanzielle Risiko und die Volatilität zu erhalten, wobei die Kursmetriken jedes Balkens für eine genaue Risikobewertung verwendet werden.
Der Session Expected Risk Date Range Analyzer ist ein hochentwickeltes Tool, das Händlern und Analysten detaillierte Einblicke in das erwartete finanzielle Risiko über bestimmte Datumsbereiche hinweg bietet. Im Gegensatz zur tradit
FREE

MT4 ist eine Histogramm-Version von MT5: https: //www.mql5.com/en/market/product/122151 Wir stellen vor: Trade Sniper: Ihr Vorteil an den Märkten. Haben Sie es satt, profitable Trades zu verpassen oder auf der falschen Seite des Marktes zu landen? Lernen Sie Trade Sniper kennen, den innovativen Indikator, der die Macht der Trends nutzt, um Ihnen einen messerscharfen Vorteil bei Ihrem Handel zu verschaffen. Trend Sniper ist nicht nur ein weiterer gewöhnlicher Indikator. Es handelt sich um ein ho

Super Reversal Pattern Indicator
Nutzen Sie die Möglichkeiten der fortgeschrittenen Mustererkennung mit unserem Super Reversal Pattern Indicator. Dieser Indikator wurde für Händler entwickelt, die Präzision und Zuverlässigkeit suchen. Er identifiziert eines der effektivsten Umkehrmuster in der technischen Analyse und bietet einen bedeutenden Vorteil für Ihre Handelsstrategie. Hauptmerkmale: Nicht-nachzeichnende Genauigkeit: Genießen Sie das Vertrauen in die nicht nachmalende Technologie. Sobal

SENSE ist ein automatisiertes System, das ausgewählte GANN-Methoden mit fraktalen Berechnungen kombiniert. Das System sagt uns, wo wir Trades eröffnen und schließen sollen. Sie brauchen keine Zeit mehr mit komplexen Berechnungen zu verschwenden - SENSE macht alles für Sie. Installieren Sie einfach den Indikator.
Grundprinzipien:
Der Markt ist bullisch, wenn der Preis über den weißen Linien liegt.
Kaufen Sie oberhalb der weißen Linien, stoppen Sie unterhalb Grüne Linien sind Aufwärtsziele De
Ist Ihnen bekannt, warum der MetaTrader Market die beste Plattform für den Verkauf von Handelsstrategien und technischer Indikatoren ist? Der Entwickler braucht sich nicht mit Werbung, Programmschutz und Abrechnung mit Kunden zu beschäftigen. Alles ist bereits erledigt.
Sie verpassen Handelsmöglichkeiten:
- Freie Handelsapplikationen
- Über 8.000 Signale zum Kopieren
- Wirtschaftsnachrichten für die Lage an den Finanzmärkte
Registrierung
Einloggen
Wenn Sie kein Benutzerkonto haben, registrieren Sie sich
Erlauben Sie die Verwendung von Cookies, um sich auf der Website MQL5.com anzumelden.
Bitte aktivieren Sie die notwendige Einstellung in Ihrem Browser, da Sie sich sonst nicht einloggen können.