Neue technische Indikatoren für den MetaTrader 4 - 37

Golden Range 2 ist einer der Top-Einstiegsindikatoren, der mit seinen Ergebnissen seine Zukunft sichert. Einstellungen des Indikators: Punkte = wie präzise die Mustererkennung ist AlertConfirmation = Alarm einschalten (true) ausschalten (false) CalculatedBars = wie viele Balken berechnet werden sollen
Bitte hinterlassen Sie positive Kommentare, Bewertungen. Puffer 0 Kaufpfeil, Puffer 1 Verkaufspfeil, Puffer2 Kaufsignal(Wert:1/0), Puffer3 Verkaufssignal(Wert:1/0) Kaufen Grün, Verkaufen Rot
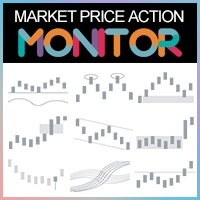
Warum muss ich den Market PA Monitor: verwenden?
(1) Es ist unmöglich, mehrere Sorten und mehrere TF des Marktes zu überwachen.
Die Marktsituation ändert sich ständig, mit zahlreichen Varianten, und jede Variante hat unterschiedliche Zeitrahmen von klein bis groß. Jede TF enthält unterschiedliche Marktveränderungen und Trendwechsel. Bei zahlreichen Varianten und mehreren TFs gibt es jeden Tag unzählige Handelsmöglichkeiten. Ein gewöhnlicher Händler kann jedoch die Handelsmöglichkeiten jeder S
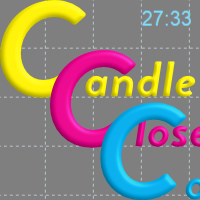
CandleCloseCountdown ist technisch gesehen ein Indikator. Sein Zweck ist es, die Zeit anzuzeigen, die einer Kerze in einem bestimmten Zeitrahmen verbleibt, bevor sie sich schließt. Es werden alle möglichen Zeitrahmen des MetaTrader 4 unterstützt. Die Art und Weise, wie die verbleibende Zeit angezeigt wird angezeigt wird, hängt vom gewählten Zeitrahmen ab. Für M1 werden nur die Sekunden angezeigt. Darüber hinaus werden bei allen Timeframes bis H1 werden die verbleibenden Minuten und Sekunden ange
FREE
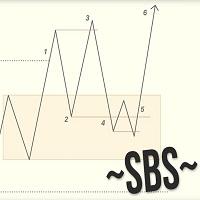
Swing Breakout Sequence | SBS stellt eine umfassende Handelsstrategie vor, die Händlern helfen soll, Marktschwankungen und Ausbrüche zu erkennen und zu nutzen. Die Swing Breakout Sequence (SBS)-Strategie basiert auf einer Reihe klar definierter Schritte zur Optimierung von Handelsentscheidungen und zur Verbesserung der Rentabilität. Version 2.01: Hinzufügen des "goldenen Einstiegs" - Einstieg durch fib. Stoic hinzugefügt (Fibo) er nennt dieses Setup Gold SBS hier ist das Video die Beschreibung d
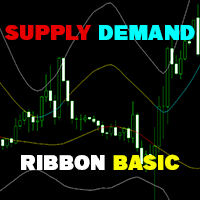
Supply Demand Ribbon ist ein Indikator mit sich bewegenden Angebots- und Nachfragelinien, die Ihnen helfen, Preiszonen leichter zu identifizieren. Der Indikator hilft Ihnen, flexible Einstiegs-, Stop-Loss- und Take-Profit-Bereiche zu bestimmen. Es gibt auch Strategien für die algorithmische Änderung der Ribbon-Farben. Daraus können Sie viele Handelsstrategien für sich selbst entwickeln! MT5 Version: Klicken Sie hier !
Sie können viele Funktionen der Advanced Version hier entdecken ! Sie können
FREE
Leistungsstarker Orderblock-Indikator in der Tradingview-Plattform. Indikator-Typ: Preis-Aktions-Indikator Einführung: Der Order-Block-Indikator - Erhöhen Sie Ihre Price-Action-Analyse. Wenn Sie auf der Suche nach einem umfassenden Orderblock-Indikator auf der MQL5-Plattform sind, brauchen Sie nicht weiter zu suchen.
Nach diesem Indikator wird ein OB als eine Zone mit ausstehenden Aufträgen von großen Institutionen verstanden, die noch nicht vollständig ausgeführt wurden und sich auf dem Markt

FXDragunov.MyThemes. Forex Chart Color Themes.
Die Chartvorlagen sind verantwortlich für das Layout der Charts und für den Inhalt der technischen Indikatoren, die auf sie angewendet werden.
Chartvorlagen werden verwendet: Beim Anpassen eines geöffneten Chart-Fensters. Bei der Anpassung der Einstellungen eines neuen Chart-Fensters. Beim Anpassen eines Charts, der über das Fenster "Neuer Chart" geöffnet wurde.
Originalcode von FXDragunov Indonesien
FREE
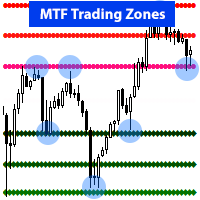
Kein traditioneller Unterstützungs-, Widerstands- oder Pivotpunkt-Indikator. RevCan's "Early Reversal - MTF Trading Zones " ist ein fortschrittliches Tool, das potentielle Marktumkehrpunkte oder Trendwechsel in einem frühen Stadium mittels MTF-Chartanalyse identifiziert. >> Es analysiert mehrere Chart-Zeitrahmen (MTF), um diese wichtigen Preisumkehrzonen zu finden, in denen große Banken und Institutionen wahrscheinlich ihre Trades platzieren werden, und somit Chancen für Sie für einen wahrschein

Produkt-Beschreibung: Präzisionsmuster-Indikator für konstante Profite Verbessern Sie Ihren Handel mit dem Precision Pattern Indicator, einem fortschrittlichen Tool, das entwickelt wurde, um ein hochprofitables und spezifisches Handelsmuster zu erkennen. Dieser Indikator ist Ihr Schlüssel, um mit minimalem Aufwand konstante Gewinne zu erzielen. Hauptmerkmale: Präzise Einstiegssignale: Erhalten Sie klare Einstiegssignale mit grünen Pfeilen für Kaufgelegenheiten und roten Pfeilen für Verkaufsgeleg

Gann Retracements Oktaven Indikator Verbessern Sie Ihre Handelsstrategie mit dem Gann Retracements Octaves Indikator, der sorgfältig entwickelt wurde, um die Theorien von Gann mit der modernen technischen Analyse zu verbinden. Dieser benutzerdefinierte Indikator liefert Ihnen präzise Retracement-Levels, die auf Ganns Oktaven basieren, und hilft Ihnen, wichtige Unterstützungs- und Widerstandsniveaus sowie potenzielle Umkehrpunkte auf dem Markt zu identifizieren. Hauptmerkmale: 24 Indikator-Puffer

HINTERLASSEN SIE NACH DEM KAUF EINE NACHRICHT ODER BEWERTUNG, UND ICH SENDE IHNEN DEN BONUS-EA-HANDELSASSISTENT! Hypertrend ist ein sehr leistungsstarker visueller Indikator, der die Kerzen je nach Stärke des Trends einfärbt. KEINE NEUFARBE!
Funktioniert mit allen Paaren und Zeitrahmen! Sehen Sie sich die Screenshots (GIF) an!
Es werden spezielle Filter und Oszillatoren verwendet, um den Trend für Sie zu finden, sodass Sie nichts weiter tun müssen, als sich das Diagramm anzusehen!
Einstellun

Der Durchschnitts-Einstiegspositionen-Indikator (The Average Entry Positions Indicator) Der Durchschnitts-Einstiegspositionen-Indikator bietet Tradern eine klare visuelle Darstellung ihrer durchschnittlichen Kauf- und Verkaufs-Einstiegspreise auf dem Chart. Dieses leistungsstarke Tool berechnet und zeigt nun entscheidende Informationen zum Trade-Management an, was zu besseren Entscheidungen und einer effizienten Positionsverfolgung beiträgt. Durch die Verwendung dieses Tools können Trader ihre G

Indikator für manuellen Handel und technische Analyse für Forex.
Es besteht aus einem Trendindikator mit dem Eröffnungsniveau des Handelstages und einem Pfeilindikator zur Bestimmung von Einstiegspunkten.
Der Indikator ändert seine Farbe nicht; er funktioniert, wenn die Kerze schließt.
Enthält verschiedene Arten von Warnungen für Signalpfeile.
Kann für die Arbeit mit jedem Diagramm, Handelsinstrument oder Zeitrahmen konfiguriert werden.
Die Arbeitsstrategie basiert auf der Suche nach Preisbewe

Benutzerhandbuch Download-Link: https://ontrd.com/our-books/
Für alle, die nach dem Indikator fragen ON Trade Numerologie Station Es erhalten über 16 Numerologie Strategien machen es zusammen abgeschlossen Einheit Kontrolle Ihres Handels. Grundlegende Strategien, um mit ihm zu arbeiten sind 3 Strategien Statistiken über sie sind die folgenden : 1. RBA Ebenen Erfolgsquote mehr als 95%. 2. FF mehr als 96% 3.RBA SUN 98% Wir werden nicht sagen, 100 %, wie sie sind .. Ratio Raten wie folgt : 1.Rba S

Der Dreadnought-Indikator analysiert sorgfältig die Preisdynamik und identifiziert vorübergehende Trendschwächen und starke Richtungsänderungen. Durch die Beobachtung dieses Indikators können Sie Veränderungen auf dem Markt leicht feststellen und entsprechende Maßnahmen ergreifen. In den Markt einzusteigen mag einfach sein, aber eine Position zu halten ist viel schwieriger. Mit Dreadnought haben Sie eine zuverlässige Unterstützung, um dem Trend erfolgreich voraus zu sein. Dieser Indikator analy

Der Radiant Trend-Indikator berechnet die Sättigungsniveaus des Preisdiagramms. Ein Signal zum Verlassen der überverkauften Zone bedeutet einen Kauf, und ein Signal zum Verlassen der überkauften Zone bedeutet einen Verkauf. Für diesen Indikator ist es in der Regel erforderlich, relative Werte für die überkauften und überverkauften Niveaus - Bottom und Top - festzulegen.
Oft lässt sich ein guter Trend visuell auf dem Kursdiagramm erkennen. Ein erfahrener Händler muss jedoch die aktuelle Marktsi

Der Geliosx-Indikator wurde entwickelt, um den Trend visuell darzustellen. Eine der wichtigsten Aufgaben bei der Beobachtung des Devisenmarktes ist es, den Trend zu bestimmen - eine stabile Richtung der Kursbewegung. Geliosx verwendet spezielle Berechnungen, um starke Schwankungen zu glätten, die keinen wesentlichen Einfluss auf das Gesamtbild der Kursbewegung haben.
Dieser Indikator ist für diejenigen gedacht, die Wert auf ihre Zeit und ihr Geld legen.
Der Trend kann aufsteigend (Bullentrend

Der Onion Trend Indicator ist eine revolutionäre Lösung für den Trendhandel und die Filterung von Marktdaten, die alle wichtigen Funktionen eines Trendtools in einem einzigen Tool vereint! Er eignet sich für jeden Trader, sei es Forex oder binäre Optionen. Es sind keine Einstellungen erforderlich, alles ist durch Zeit und Erfahrung optimiert, es funktioniert effektiv sowohl in flachen Bedingungen als auch in Trendbedingungen.
Der Zwiebel-Trend-Indikator ist ein technisches Analyseinstrument fü

Mit dem Algorithmus des Likdon Forex-Indikators können Sie schnell den aktuellen Markttrend bestimmen. Der Elephant-Indikator verfolgt lange Trends und kann ohne Beschränkung auf Instrumente oder Zeitrahmen verwendet werden. Mit seiner Hilfe können Sie versuchen, zukünftige Kurswerte vorherzusagen, aber sein Hauptzweck ist es, Kauf- und Verkaufssignale zu generieren.
Der Indikator verfolgt den Markttrend und ignoriert starke Schwankungen und das Marktrauschen um den Durchschnittspreis. Er setz

Support and Resistance Levels ist ein intelligenter Indikator, der horizontale Unterstützungs- und Widerstandsniveaus anzeigt, die für Händler mit unterschiedlichen Handelsfrequenzen geeignet sind. Sie können Ihre bevorzugte Handelsfrequenz auswählen, und der Indikator berechnet automatisch die für diese Frequenz relevanten Unterstützungs- und Widerstandsniveaus. Die Bull-Bear-Linie ist ein Intervall, das zur Unterscheidung der Stärke von Aufwärts- und Abwärtskräften verwendet wird und ein wich

Der Consolidation Zone Indicator ist ein leistungsfähiges Instrument, mit dem Händler Konsolidierungsmuster auf dem Markt erkennen und nutzen können. Dieser innovative Indikator erkennt Konsolidierungsbereiche und gibt rechtzeitig Warnungen aus, wenn der Kurs diese Zonen über- oder unterschreitet, so dass Händler fundierte Handelsentscheidungen treffen können. MT5 Version : https://www.mql5.com/en/market/product/118748 Beitreten und Markttiefe lernen - h ttps:// www.mql5.com/en/channels/suvashi
FREE

Mysterium ist ein Kanalindikator ohne Redraws, der auf der doppelten Glättung gleitender Durchschnitte basiert. Im Gegensatz zu Kanalindikatoren wie Bollinger verwendet Mysterium doppelt geglättete gleitende Durchschnitte. Dadurch können Sie die Richtung der Marktbewegung genauer bestimmen, obwohl dies die Empfindlichkeit des Indikators verringert. Die doppelte Glättung sorgt jedoch für eine klarere und stabilere Darstellung der Kanäle auf dem Chart, was Händlern hilft, fundierte Handelsentschei

Volatilitätsspanne ist ein Indikator, der die Spanne der Volatilität berechnet und wichtige Niveaus wie den potenziellen Widerstand nach oben und die potenzielle Unterstützung nach unten vorhersagt. Der Indikator kann Volatilitätsvorhersagebereiche für die letzten 50 Tage, 10 Wochen oder 4 Monate anzeigen. Durch die Beobachtung dieser Bereiche können Sie verlässliche Niveaus besser identifizieren, wobei die Kombination mit der Preisaktion die Handelsgenauigkeit erheblich verbessert.
Sie haben

Warum der RSI-Alarm-Indikator für Ihr Trading-Toolkit unerlässlich ist
In der schnelllebigen Welt des Handels sind zeitnahe und genaue Informationen von entscheidender Bedeutung. Der RSI-Alarm-Indikator ist ein leistungsstarkes Instrument, das Ihnen hilft, dem Markt einen Schritt voraus zu sein, indem es Sie in Echtzeit benachrichtigt, wenn der Relative Strength Index (RSI) kritische Werte erreicht. Egal, ob Sie ein Anfänger oder ein erfahrener Händler sind, dieser Indikator kann Ihre Handelss

Der Price Action Scanner ist ein Indikator, der das Preisverhalten erkennt und Warnungen ausgibt. Dieser Indikator kann gleichzeitig Signale für bis zu 6 verschiedene Symbole in verschiedenen Zeitrahmen erkennen. Durch die Festlegung eines Trennzeichens können Sie verschiedene Symbolnamen und Zeitrahmen hinzufügen.
Der Indikator kann mehrere gängige Signaltypen erkennen, wie z.B. Pinbar, Engulfing Pattern, Inside Bar, Morning Star, Evening Star, Fakey, und entsprechende Informationen in separa

Price Action Scanner Pro ist ein Indikator, der Preisverhalten identifiziert und Warnungen ausgibt und im Vergleich zum Price Action Scanner ( https://www.mql5.com/zh/market/product/118937?source=Site+Profile+Seller ) mehr Funktionen und Anpassungsmöglichkeiten bietet. Dieser Indikator kann gleichzeitig Signale für bis zu 15 Symbole in verschiedenen Zeitrahmen erkennen. Sie können ihn so konfigurieren, dass er Signale während bestimmter Handelssitzungen, wie z. B. asiatische, europäische und US
Die Arbeit mit dem Channel Motion Tracker Indikator ist so einfach wie möglich. Reagieren Sie einfach auf die Pfeile, die der Indikator anzeigt. Jeder Pfeil stellt eine ausdrückliche Handlungsanweisung dar. Die von diesem Indikator generierten Signale sind genau genug, um Ihnen zu ermöglichen, auf der Grundlage dieser Informationen zu handeln.
Einer der Hauptvorteile des Indikators ist seine Fähigkeit, hochwertige Kanäle zu bilden und Signale für den Einstieg in den Markt zu generieren. Dies i

Der Candlestick Pattern Detector ist ein fortschrittlicher MetaTrader 4-Indikator, der entwickelt wurde, um Candlestick-Muster auf Ihren Charts zu erkennen und hervorzuheben. Derzeit erkennt der Indikator ein bestimmtes Candlestick-Muster - den Pinbar, der für seine Bedeutung in der technischen Analyse und für Handelsstrategien bekannt ist. Dieses Tool bietet Händlern visuelle Anhaltspunkte, die es ihnen erleichtern, potenzielle Marktumkehrungen oder -fortsetzungen zu erkennen. Merkmale: Anpassb
Der LewshaGen-Indikator ist ein technisches Analyseinstrument, das auf dem Devisenmarkt verwendet wird. Er hilft Händlern, auf der Grundlage der Analyse von Marktdaten zu entscheiden, wann sie in einen Handel ein- oder aussteigen sollten. Schauen wir uns an, wie er funktioniert und warum er nützlich sein kann.
Wie der LewshaGen-Indikator funktioniert : Trendanalyse: Der Indikator analysiert die Chartdaten und identifiziert wichtige Wendepunkte und Trends im Markt. In der obigen Grafik können S
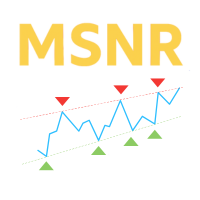
Malaysian Levels ist ein benutzerdefinierter Indikator, der dazu dient, Unterstützungs- und Widerstandsebenen auf einem Chart anzuzeigen. Diese Ebenen basieren auf der malaysischen Theorie zu Unterstützung und Widerstand, die Ebenen nicht als Bereiche, sondern als spezifische Preisniveaus definiert, die aus Spitzen und Tälern von Liniendiagrammen abgeleitet sind. Eigenschaften: Drei Arten von Ebenen: A-Level, V-Level und Gap Level. Frische-Anzeige für Ebenen: Frische Ebenen sind signifikanter
Max Payne ist ein Umkehr-/Trendsignalindikator, der Signale in Form eines Pfeils ausgibt. Dieser Indikator gibt sein Signal beim Schließen desselben Balkens aus. Dieser Indikator kann mehrmals mit unterschiedlichen Perioden auf dem Chart fallen, um eine doppelte/dreifache Bestätigung der Signale zu erhalten Der Indikator ist hochgradig anpassbar, um sich an jeden Handelsstil anzupassen, während er niemals neu lackiert oder rücklackiert wird. Sie erhalten nach dem Kauf das gesamte System, das in

Payne Trend ist ein Trendfilterindikator, der die mögliche Marktrichtung in Form dünner farbiger Linien angibt. Dieser Indikator hilft dem Händler, Handelsentscheidungen auf der Grundlage des aktuellen tatsächlichen Trends zu treffen. Der Indikator verfügt über viele Ebenen, die die Stärke und Schwäche des Trends anzeigen. Dies ist bei diesem Indikator der Fall Sie müssen nicht neu streichen oder neu lackieren und das Signal wird nicht verzögert.
===============================================

Der "Breakout Buy-Sell" Indikator ist darauf ausgelegt, potenzielle Kauf- und Verkaufsgelegenheiten basierend auf Preisdurchbrüchen während verschiedener Marktsitzungen (Tokio, London und New York) zu identifizieren und hervorzuheben. Dieser Indikator hilft Tradern, Kauf- und Verkaufszonen sowie Take-Profit (TP) und Stop-Loss (SL) Niveaus klar zu visualisieren. Nutzungsstrategie Der Indikator kann wie folgt verwendet werden: Erste Einstellungen : Wählen Sie die Marktsitzung und passen Sie den GM
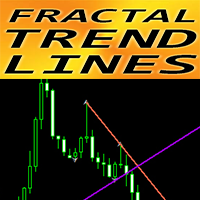
Crypto_Forex-Indikator „Fraktale Trendlinien“ für MT4.
- Dieser Indikator ist hervorragend für Händler geeignet, die grafische Analysen mit Ausbrüchen verwenden!!! - „Fraktale Trendlinien“ zeigt grafische Aufwärtstrendlinien (violette Farbe) und Abwärtstrendlinien (rote Farbe). - Aufwärtstrend- und Abwärtstrendlinien basieren auf 2 einander am nächsten liegenden Fraktalen. - Der Indikator hat einige Parameter, die für die Farbe und Breite der Trendlinien verantwortlich sind. - Der Indikator ve

"Trend Finder" ist eine Trendhandelsstrategie, die Marktgeräusche filtert und alle notwendigen Funktionen in einem Tool vereint! Das System zeigt automatisch Ein- und Ausstiegspunkte durch Pfeile an. Zur Konfiguration reicht ein einziger Parameter aus. Es bietet eine einfache, intuitiv verständliche und effektive Trenderkennung. Der intelligente Algorithmus des "Trend Finder"-Indikators identifiziert potenzielle Umkehrpunkte des Marktes. Oft lässt sich ein guter Trend visuell auf dem Kurschart

Der Tin-Indikator dient dazu, den aktuellen Trend auf dem Markt visuell darzustellen. Einer der wichtigsten Aspekte der Devisenmarktanalyse ist die Bestimmung des Trends, d. h. der nachhaltigen Richtung der Preisbewegung. Zu diesem Zweck verwendet der Tin-Indikator Algorithmen, die starke Schwankungen ausgleichen, die keinen wesentlichen Einfluss auf den Gesamttrend haben.
Ein Trend kann entweder aufwärts (bullish) oder abwärts (bearish) verlaufen. In der Regel hält ein Trend lange Zeit an, be

Der TMA-Kanal ist ein Preiskanal, der durch eine spezielle Berechnungsmethode auf der Grundlage des traditionellen TMA ermittelt wird. Der Kanal hat eine obere, eine mittlere und eine untere Spur. Wenn sich der Preis der oberen Spur nähert oder diese überschreitet, befindet er sich bereits in einem überkauften Zustand und es sollte auf die Situation der Umkehr und des Rückgangs geachtet werden; wenn sich der Preis der unteren Spur nähert oder unter diese fällt, befindet er sich bereits in einem
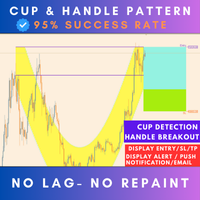
Live Trading Results MT5 Version Kontakt für Handbuch Nächster Preis $125 Kostenloses Scanner Dashboard (Kontaktieren Sie mich) Strategie - Ausbruch / Retest / Aggressiv Hallo zusammen, wir freuen uns, eines der zuverlässigsten und gewinnbringendsten Muster im Handel vorzustellen: den Cup and Handle . Dies ist das erste Mal, dass wir diesen sorgfältig ausgearbeiteten Indikator veröffentlichen, der eine beeindruckende Erfolgsquote von 95% vorweisen kann. Er ist vielseitig und eff

Der Your Honor Trendindikator basiert auf Preisdivergenzen und dient der Analyse und Bestimmung von Markteinstiegspunkten. Er kann auch als Filter beim Handel verwendet werden. Der Indikator hat nur zwei Parameter: Zeitraum und Niveau. Der Parameter Level hilft, unnötige Signale zu eliminieren. Für EURUSD kann das Level zum Beispiel auf 0,0001 eingestellt werden. Ihr Honor kann sowohl zur Ermittlung von Einstiegspunkten als auch zum Filtern von Signalen verwendet werden. Der Indikator zeigt die
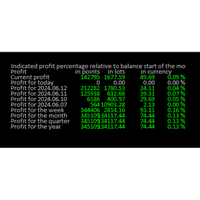
Online-Tagebuch : Dieser Indikator wurde entwickelt, um Händlern zu helfen, Gewinne und Verluste über verschiedene Zeiträume zu verfolgen, wie z. B. den aktuellen Gewinn, den heutigen Gewinn, den gestrigen Gewinn usw. bis hin zum Gewinn des laufenden Jahres. Der Indikator bietet mehrere Konfigurationsoptionen, wie z. B. die Berechnung des prozentualen Gewinns im Verhältnis zum Saldo zu Beginn des Tages, der Woche, des Monats, des Quartals oder des Jahres. Außerdem können Sie die Platzierung des
FREE

Der SuperTrend MTF-Indikator ist ein ausgezeichneter Trendverfolgungsindikator. Er kann nicht nur SuperTrend-Trends innerhalb des Zeitrahmens des Charts anzeigen, sondern auch so eingestellt werden, dass er SuperTrend-Trends für größere Zeitrahmen gleichzeitig anzeigt. Dies ist vorteilhaft für das Erfassen von Trends auf einer größeren Zeitskala und die Vorhersage zukünftiger Trends. Gleichzeitig kann auch der Preis der Trendlinie auf einen Blick angezeigt werden, was die Beobachtung erleichtert

SNR-LEVEL-INDIKATOR Der genaue Snr-Level-Indikator zeigt nur frische Levels an, die nahe am aktuellen Marktpreis liegen. Dieser Indikator ist sehr genau bei der Bestimmung von Unterstützungs- und Widerstandsniveaus. Es gibt eine Warnfunktion, wenn der Kurs das SNR-Level BERÜHRT, WENN der CLOSE CANDLE das SNR-Level durchbricht/verletzt.
KENNZEICHNUNG DES INDIKATORS:
- UNTERSTÜTZUNGSNIVEAU = V-FORM - WIDERSTANDSNIVEAU = SCHEITELNIVEAU - GAP-WIDERSTAND & GAP-UNTERSTÜTZUNG = OFFENE SCHLUSSKERZE -

Der KeyLevels Pro-Indikator ist ein leistungsfähiges Instrument zur Identifizierung von wichtigen Unterstützungs- und Widerstandsniveaus auf der Grundlage von Pivot-Hochs und -Tiefs in der Kursentwicklung. Dieser Indikator ist perfekt für Händler, die sich auf die Marktstruktur und die wichtigsten Kursniveaus verlassen, um fundierte Handelsentscheidungen zu treffen. Er verfügt über anpassbare Parameter, eine automatische Erkennung von Pivot-Punkten und eine visuelle Darstellung der Schlüsselnive
Beschreibung der Verwendung des Dynamic HL Breakouts-Indikators Der Dynamic HL Break outs-Indikator ist ein technisches Instrument, das für den Handel mit trendfolgenden Vermögenswerten entwickelt wurde. Sein Hauptzweck besteht darin, Händlern zu helfen, wichtige Einstiegs- und Ausstiegspunkte während starker Trendphasen eines Vermögenswerts zu identifizieren. Bestandteile des dynamischen HL-Breakouts-Indikators Hochs und Tiefs Dieser Indikator berechnet und zeigt die Höchst- und Tiefstwerte fü

* Pivot Points Magic : Pivot Levels mühelos auf jedem Chart darstellen**
Pivot Points Magic vereinfacht den Prozess der Identifizierung kritischer Pivot-Levels auf jedem Chart, über alle Zeitrahmen hinweg. Mit nur wenigen Klicks können Trader Pivot-Punkte sofort visualisieren und so fundiertere Handelsentscheidungen treffen.
Wir schätzen Ihr Feedback! Teilen Sie Ihre Erfahrungen mit Pivot Points Magic und helfen Sie uns, uns zu verbessern. Ihre Bewertungen und Vorschläge sind wichtig für die

Dies ist ein Halftrend Scalper für MT4. Er ist für schwankende Märkte mit hoher Volatilität gedacht. Nicht geeignet bei niedriger Volatilität. Merkmale:
Warten Sie, bis der Preis die Halftrend-Linie überschreitet. Wählen Sie den HTF Halftrend (Hauptsignal) Prüfen Sie die Ausrichtung des Halftrends zwischen höheren Zeitrahmen High Volume Bar prüfen (Optional) Halftrend Trends gestapelt (Optional) Was im Download-Paket enthalten ist Extras:
- HT Scalper Scanner Dashboard (im gleichen Verzeichnis

Der "Sharp Scalper"-Indikator ist ein Hochfrequenz-Handelsinstrument, das für schnelle, kurzfristige Trades auf dem Devisenmarkt entwickelt wurde. Er konzentriert sich darauf, schnelle Kursbewegungen zu erkennen und Signale für den besten Einstieg zu generieren. Dieser Indikator ist für seine Fähigkeit bekannt, mehrmals am Tag kleine Gewinnchancen zu nutzen, was ihn ideal für Scalper macht, die aus der Marktvolatilität Kapital schlagen wollen. Der" sharp scalper" Indikator verwendet fortschrittl

Der 10PIPS Dynamite Indikator ist ein halbautomatischer , hochmoderner Forex-Indikator, der entwickelt wurde, um Ihre Trading-Fähigkeiten automatisch zu revolutionieren und Sie von einem verlustreichen Trader zu einem profitablen Trader zu machen, indem Sie einfach 10 Pips pro Trade-Setup skalieren, das von der Software generiert wird. 10PIPS Dynamite Indikator einmal auf dem Haupt-Chart befestigt beginnt es eine eingehende Marktanalyse auf der Grundlage seiner einzigartigen eingebauten fortschr
Dieses leistungsstarke Tool identifiziert automatisch Trendlinien, um Ihre Handelsstrategie zu optimieren und fundiertere Entscheidungen zu treffen. MT5 -Version
Schlüsselfunktionen Erkennung der automatischen Trendlinie : Die Anzeige "Basic Trendline" scannt den Markt für potenzielle Trendlinien und zeigt sie sofort in Ihrem Diagramm an.Dies spart Ihnen wertvolle Zeit und stellt sicher, dass Sie nie einen wichtigen Trend verpassen. benutzerfreundliches Panel : Unser Indikator verfügt über ein
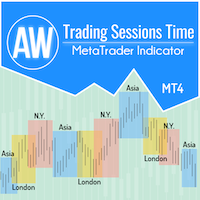
Damit Händler bequem Daten zur Entwicklung der Märkte erhalten und Handelsstrategien besser formulieren können, haben wir einen Handelssitzungsindikator entwickelt. Die Öffnungszeiten verschiedener Börsen wirken sich auf den Handel aus, da sie die Marktaktivität und das Handelsvolumen beeinflussen. Diese Faktoren bestimmen die Volatilität und Handelsmöglichkeiten verschiedener Instrumente. Der AW Trading Sessions Time-Indikator zeigt die Handelszeiten der asiatischen, Londoner und New Yorker Mä
FREE

Der Spider-Renko-Pfeil ist ein Renko-basierter Pfeilindikator, der ein Signal bei offener Bar/Intra-Bar gibt und zwei Strategien zur Darstellung des Signals verwendet. Dieser Indikator kann zum Skalpieren eines TP eines Balkens oder zum Swing-Traden verwendet werden, wenn er mit höheren Perioden in seinen Einstellungen verwendet wird. Dieser Indikator muss niemals neu lackiert oder hinterlackiert werden. =============================================== ======= Parameter: Eingabezeitraum: Hauptsi

"Scalping Signal No Repaint No Lag" ist der einzige Indikator auf dem Markt, der beim Ziehen auf ein beliebiges Diagramm automatisch alle erforderlichen Indikatoren lädt, ohne dass Vorlagen oder andere Indikatoren geladen werden müssen. Er konfiguriert das Diagramm automatisch so, dass es genau wie im bereitgestellten Bild aussieht. Dieser Indikator garantiert Signale ohne Neuzeichnung oder Verzögerung und ist daher ideal für Scalping-Strategien bei allen Währungspaaren und Zeitrahmen (TF). Funk
Basierend auf mehreren integrierten, miteinander kombinierten Indikatoren ist der Sure Swing-Indikator ein auf mehreren Zeitrahmentrends basierender Pfeilindikator, der Swing-Trading-Signale liefert. Dieser Indikator wird nicht neu dargestellt. Wie man handelt : Eröffnen Sie einen Kaufhandel, wenn ein grüner Pfeil mit einer Kaufwarnung erscheint, der Stop-Loss unter dem Pfeil liegt und der Take-Profit das 1-fache des minimalen Risikos beträgt Eröffnen Sie einen Verkaufshandel, wenn ein roter Pf

Binary ATM ist ein Signalindikator für binäre Optionen, der auf 2 Teilen basiert, der erste ist in Form einer farbigen Linie, die die Trendrichtung angibt und Verkäufe nur bei Käufen diktiert, der zweite ist ein Einstiegssignal in Form eines Punkts, der auf BAR OPEN kommt und nie neu lackiert wird und nicht verzögert wird.
ANWENDUNG :
Warten Sie, bis ein Verkaufspunkt bei der Eröffnung des Balkens angezeigt wird, wenn der vorherige Balken eine Verkaufslinienfarbe hatte, als einen Verkauf zu e
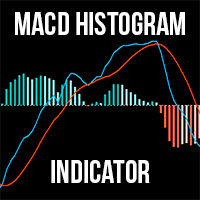
Für MT5
Der MACD Histogramm Indikator ist eine verbesserte Version des traditionellen MACD-Indikators, die eine überlegene Einsicht in Markttrends und Momentumänderungen bietet. Im Gegensatz zum standardmäßigen MACD in MT4, enthält diese Version ein Histogramm , das die Visualisierung und Interpretation der Marktbedingungen erleichtert. Vorteile gegenüber dem standardmäßigen MACD-Indikator: Verbesserte Visualisierung: Das Histogramm bietet eine Balkendarstellung der Differenz zwischen der MACD-
Engulfing Candle Signal Alert: Erhöhen Sie Ihre Handelsstrategie Erschließen Sie das volle Potenzial Ihres Handels mit dem Engulfing Candle Signal Alert, dem ultimativen Werkzeug zur Erkennung von Marktumkehrungen und zur Verbesserung Ihrer Handelspräzision. Dieser leistungsstarke Indikator wurde speziell für Händler entwickelt, die Wert auf Genauigkeit und rechtzeitige Warnungen legen. Er erkennt engulfing Candle-Muster, ein Schlüsselsignal in der technischen Analyse, das häufig eine potenziell
FREE

Wir haben alle unsere beliebten Indikatoren, wie z.B.: Key-Level-Order-Block , Key-Level-Angebot und -Nachfrage , Key-Level-Liquiditätsgrab und Key-Level-Keil in einem einzigen Indikator und Dashboard.
Was ist neu? Dashboard : Es gibt ein leicht zugängliches Dashboard für alle Ihre Bedürfnisse. Multi-Timeframe-Schaltfläche : Es gibt jetzt eine Multi-Timeframe-Option für Order-Blöcke und Angebots- und Nachfragezonen, die es einfach macht, höhere Timeframe-Zonen auf dem aktuellen Timeframe zu seh

Backtest mit guten Trenderkennungsergebnissen ab Januar 2023
EURUSD Zeitrahmen: m15, m30, H1
AUDUSD Zeitrahmen: m15, m30 NASDAQ Zeitrahmen: m15 S&P 500 Zeitrahmen: m15, m30 XAUUSD Zeitrahmen: m30 BTCUSD Zeitlicher Rahmen: H4
Dies sind nur einige der getesteten Vermögenswerte (Bitte beachten Sie, dass vergangene Ergebnisse keine Garantie für zukünftige Ergebnisse sind). Beachten Sie, dass es sich hierbei nicht um eine vollständige Strategie handelt. Sie können diesen Indikator als Einstiegsau
FREE

Async Charts ist ein Indikator zur Synchronisierung von Charts und zur Anzeige eines benutzerdefinierten Fadenkreuzes (Cursor) auf allen ausgewählten Charts. Dies ist ein nützliches Dienstprogramm für Händler, die mehrere Zeitrahmen für die Analyse mehrerer Symbole für den Handelseinstieg oder -ausstieg verwenden.
Hauptmerkmale: Echtzeit-Synchronisation des Fadenkreuzes auf allen ausgewählten Charts
Unterstützt mehrere Zeitrahmen und mehrere Symbole gleichzeitig
Auto-Scroll-Option
Grafische Anp
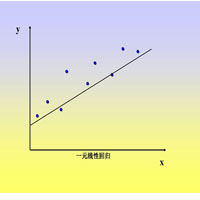
Dieser Index wird zur Berechnung der linearen Regressionssteigung der K-Linie in einem bestimmten Zeitraum verwendet. Der Algorithmus verwendet die Methode der kleinsten Quadrate.
1. Geeignet für jedes Zyklusdiagramm.
2. Kann zur Berechnung von Eröffnungskurs, Schlusskurs, Höchstkurs, Tiefstkurs und Mittelkurs verwendet werden.
3. Geben Sie die Start- und Endzeit in den Parametern an.
Beachten Sie, dass die Startzeit und die Endzeit keine Wochenenden sein können, wählen Sie den berechneten
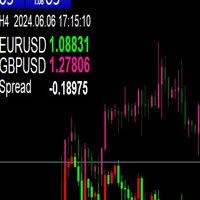
Dieser Indikator kann verwendet werden, um ein Kerzendiagramm einer anderen Sorte zum Diagramm der aktuellen Sorte hinzuzufügen.
1. Die Höhe des Charts wird automatisch angepasst
2. Wenn Sie die Periode des aktuellen Symbols wechseln, wird auch die K einer anderen Sorte auf die entsprechende Periode umgestellt
3. In der oberen linken Ecke des Diagramms werden der aktuelle Zyklus, die aktuelle Uhrzeit sowie der aktuelle Preis und die Spanne der beiden Ziele angezeigt.
4. Beim Umschalten des

Der RPO (Relative Price Oscillator) ist ein Indikator der technischen Analyse, der im Devisenhandel zur Messung der Dynamik und Trendstärke eines Währungspaares verwendet wird. Er ist vom Relative Strength Index (RSI) abgeleitet, konzentriert sich aber auf die Differenz zwischen zwei gleitenden Durchschnitten des Preises, in der Regel dem Schlusskurs, über verschiedene Zeiträume. Der RPO ähnelt dem MACD (Moving Average Convergence Divergence), verwendet jedoch relative Kursniveaus anstelle von a

Beschreibung der Fibonacci-Levels für Unterstützung und Widerstand (SNR) mit einem statistischen Modell Fibonacci-Levels werden in der technischen Analyse häufig verwendet, um potenzielle Unterstützungs- und Widerstandsniveaus auf den Finanzmärkten zu ermitteln. Diese Niveaus werden von der Fibonacci-Sequenz abgeleitet, einer mathematischen Sequenz, bei der jede Zahl die Summe der beiden vorhergehenden ist. Die wichtigsten Fibonacci-Retracement-Levels sind 23,6%, 38,2%, 50%, 61,8% und 100%.

YK-Fibo Pivot-Indikator: Intelligenter handeln mit Fibonacci-Pivot-Punkten Der YK-Fibo Pivot-Indikator ist ein leistungsstarkes technisches Analyseinstrument, das die Präzision von Fibonacci-Retracements mit den Erkenntnissen von Pivot-Punkten kombiniert. Egal, ob Sie ein Anfänger oder ein erfahrener Trader sind, dieser Indikator ermöglicht es Ihnen, mit Leichtigkeit profitable Gelegenheiten auf dem Markt zu erkennen. Warum YK-Fibo Pivot wählen? Punktgenaue Unterstützung und Widerstand: Durch d

Das Trading Dashboard ist ein nützliches Werkzeug für Ihre zahlreichen Trades. Es enthält Informationen wie: - Breakeven-Punkt (Preis) Ihrer mehrfachen Trades, - Verlustpunkt (Preis) Ihrer Handelsgeschäfte, - Aktueller Handelstag und Sitzung, - Aktuelle Zeit und verbleibende Zeit der Kerzen, - Total Lot Buy & Sell, und die Summe davon - Spread und ATR des aktuellen Zeitrahmens und Symbols - Gewinn/Verlust in Prozent Ihres offenen Handels

Riesiger 70% Halloween-Sale nur für 24 Stunden!
Dieser Indikator ist nicht zu stoppen, wenn er mit unserem anderen Indikator namens Support & Resistance kombiniert wird. Senden Sie uns nach dem Kauf eine Nachricht und Sie erhalten ihn GRATIS als BONUS! Wir stellen Ihnen Trend Punch vor, den revolutionären Forex-Trend-Indikator, der Ihre Art zu handeln verändern wird! Trend Punch wurde entwickelt, um Ihnen während starker Markttrends präzise Kauf- und Verkaufspfeile zu liefern und Ihre Handelse
WONNFX iN M5 - Pfeilindikator für Forex und Binäre Optionen. Zuverlässiger Signal-Algorithmus. Indikator nicht neu malen. Arbeitszeiten des Indikators: 21:55-23:00. GMT+2. Durchschnittliche Gewinnrate = 60-70%.
Empfehlungen: Zeitrahmen: M5. Verfall: 2-3 Kerzen (1 Kerze = 5 Minuten) Symbol: EURUSD, USDJPY, EURAUD, GBPAUD, EURJPY, AUDUSD, USDCAD, NZDUSD, AUDCAD, AUDCHF, AUDJPY, AUDNZD, CADJPY, EURCAD, EURGBP, GBPUSD, GBPCAD, NZDJPY, CADJPY, XAUUSD

Unser Basic Support and Resistance Indikator ist die Lösung, die Sie für die Steigerung Ihrer technischen Analyse benötigen.Mit diesem Indikator können Sie Support- und Widerstandsebenen in der Tabelle projizieren/ MT5 -Version
Funktionen
Integration von Fibonacci -Ebenen: Mit der Option, Fibonacci -Werte neben Unterstützung und Widerstandsniveau anzuzeigen, gibt unser Indikator einen noch tieferen Einblick in das Marktverhalten und mögliche Umkehrbereiche.
Leistungsoptimierung: Mit der Optio

Der Indikator LEVELSS zeigt an:
- Tägliche bullische und bearische Zone. Er ist täglich von 00:00 bis 23:59 Uhr sichtbar. - Die wöchentliche Hausse- und Baissezone. Sie ist jede Woche von Montag 0:00 Uhr bis Freitag 23:59 Uhr sichtbar. - Speziell berechneter Kanal aus einem bestimmten Zeitrahmen, der auf allen anderen Zeitrahmen angezeigt wird. Standardmäßig ist dies der 4-Stunden-Zeitrahmen, den Sie auf jeden anderen Zeitrahmen, den Sie handeln möchten, ändern können. Er wird nonstop berechn

Renko Masterx ist ein mt4-Pfeiltyp-Indikator, der für den Handel mit Renko-Charts entwickelt wurde. Dieser Indikator verfügt über ein Backtesting-Dashboard, das dem Händler nützliche Informationen wie Winrate und gewonnene Punkte liefert. Außerdem gibt er tp und sl in der Multiplikation von ATR x an. Dieser Indikator gibt seine Werte an Signal bei offenem Balken oder Intrabalken, und er verfügt über eine weiße Markierung, die den genauen Preis markiert, bei dem das Signal gegeben wurde. Die Ver
Ist Ihnen bekannt, warum der MetaTrader Market die beste Plattform für den Verkauf von Handelsstrategien und technischer Indikatoren ist? Der Entwickler braucht sich nicht mit Werbung, Programmschutz und Abrechnung mit Kunden zu beschäftigen. Alles ist bereits erledigt.
Sie verpassen Handelsmöglichkeiten:
- Freie Handelsapplikationen
- Über 8.000 Signale zum Kopieren
- Wirtschaftsnachrichten für die Lage an den Finanzmärkte
Registrierung
Einloggen
Wenn Sie kein Benutzerkonto haben, registrieren Sie sich
Erlauben Sie die Verwendung von Cookies, um sich auf der Website MQL5.com anzumelden.
Bitte aktivieren Sie die notwendige Einstellung in Ihrem Browser, da Sie sich sonst nicht einloggen können.