Neue technische Indikatoren für den MetaTrader 4 - 102

Der Indikator Multicurrency Trend Detector ( MTD ) ermöglicht es Ihnen, sofort und auf einem Chart in einem ausgewählten Zeitintervall (das von einem Null-Balken bis zu einem in den Einstellungen durch den Wertehorizont festgelegten Balken reicht) das Vorhandensein, die Richtung und die Stärke von Trends in allen wichtigen Währungen zu bestimmen sowie die Zuverlässigkeit dieser Trends zu bewerten. Dies geschieht durch die Berechnung von Indizes (nicht-relative Kaufkraft) von acht Hauptwährungen

Trend Analytics ist ein Indikator für die technische Analyse, mit dem Sie mit hinreichender Wahrscheinlichkeit feststellen können, wann auf dem Devisenmarkt ein Trend und seine Richtung oder eine Flaute vorherrschen. Der Indikator ist auf speziellen Algorithmen aufgebaut. Die Würde von denen Sie in den Screenshots zu sehen. Der Indikator kann auf jedem Zeitrahmen arbeiten, aber um die Wahrscheinlichkeit von Fehlsignalen zu minimieren, sollten Sie einen Zeitrahmen von H15 und höher wählen. In die
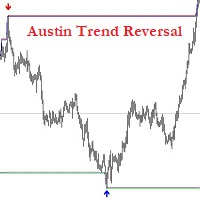
Einführung in den Austin Trend Reversal Indicator: Ihr Schlüssel zum Erkennen profitabler Marktumkehrungen.
Der Austin Trend Reversal Indicator ist ein revolutionäres MetaTrader 4-Tool, das Tradern zuverlässige Signale für Trendumkehrungen liefert. Dank fortschrittlicher Techniken und Algorithmen bietet dieser Indikator, der nicht nachzeichnet, eine unvergleichliche Genauigkeit bei der Erkennung potenzieller Wendepunkte im Markt.
Hauptmerkmale: 1. Nicht-umkehrende Signale: Der Austin Trend Rev

Der IndicatorPivot-Indikator eignet sich für die Anwendung von Forex-Handelsstrategien, die für den Intraday-Handel konzipiert sind. "IndicatorPivot" zeigt auf dem Preisdiagramm eines Währungspaares das Pivot-Level (Durchschnittspreis für den aktuellen Tag) und die drei nächstgelegenen Unterstützungs- und Widerstandsniveaus an, die auf der Grundlage von Fibonacci-Levels berechnet werden. Der "Indicator Pivot"-Indikator nutzt die Fibonacci-Levels, um das Problem der Bildung von Unterstützungs- un

Ich stelle Ihnen einen Indikator für den manuellen Handel mit den Trendlinien von DeMark vor. Alle signifikanten Niveaus, sowie die Signale des Indikators werden in den Puffern des Indikators gespeichert, was die Möglichkeit zur vollständigen Automatisierung des Systems eröffnet. Bars for calculate (0 = unbegrenzt) - Anzahl der Bars für die Suche nach Punkten DeMark range (bars) - Schultergröße zur Bestimmung des Punktes

Einfacher Indikator, der externe (äußere) Balken anzeigt. In bestimmten Fällen können externe Balken als starke Trendbalken anstelle von Range-Balken gesehen werden. Dies kann beobachtet werden, wenn ein externer Balken mit Trend bei einer Umkehrung eines starken Trends auftritt. Es wird Ihnen helfen, verschiedene Muster wie Innen-Außen-Innen, Innen-Innen-Innen, Außen-Innen-Außen usw. leichter zu erkennen. Funktioniert perfekt mit meinen anderen kostenlosen Indikatoren Internal bar und Shadows
FREE
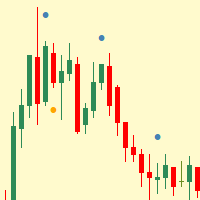
Einfacher Indikator, der interne (innere) Balken anzeigt.
Interne Balken sind wahrscheinlich eines der besten Preisaktions-Setups für den Devisenhandel. Das liegt daran, dass sie eine Forex-Handelsstrategie mit hohen Chancen sind. Sie bieten Händlern ein gutes Risiko-Ertrags-Verhältnis aus dem einfachen Grund, dass sie im Vergleich zu anderen Setups kleinere Stop-Losses erfordern. Sie können auch erfolgreich als Umkehrsignale von wichtigen Chartniveaus aus genutzt werden. Ein Inside Bar ist ein
FREE

Hier ist ein technischer Überblick über den Austin-Bat-Indikator:
Der Austin-Bat-Indikator ist ein hochentwickelter Trendfolgeindikator, der für MetaTrader 4 (MT4) Plattformen entwickelt wurde. Er zielt darauf ab, einen stabilen Trend zu identifizieren, indem er das Marktrauschen herausfiltert und sich an die Marktvolatilität anpasst.
Hauptmerkmale: 1. Duales gleitendes Durchschnittssystem: Verwendet einen schnellen und einen langsamen gleitenden Durchschnitt zur Trendbestimmung. 2. Anpassbare

EZT Bollinger Trendlinie
Indikator, der auf mehreren Einstellungen des Bollinger Bandes basiert. Im Menü können Sie ähnliche Einstellungen wie beim Bollinger Band Indikator wählen. Trendperiode und Trendabweichungen. Auch Farbe und Pfeil auf dem Chart, wenn die Richtung ändern. Drei verschiedene Arten von Warnungen, wie Pop-up, E-Mail und Push-Benachrichtigung. Probieren Sie verschiedene Einstellungen auf verschiedenen Zeitrahmen.
Bitte helfen Sie meiner Arbeit und bewerten und kommentieren S
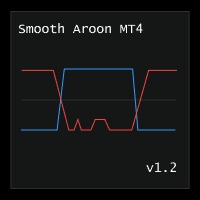
Smooth Aroon MT4 ist eine Version des Aroon Up and Down mit Glättung und Filterung.
Merkmale:
Glättung : Sie haben eine Glättung von 0 bis 99 . Um ein Signal zu glätten, suchen Sie den Maximalwert der betreffenden Punkte und setzen dann das Glättungsniveau über den Maximalwert. Beispiel: Wenn Sie alle Signale unter 30 glätten möchten, sollten Sie den Glättungswert auf über 30 einstellen. Dadurch werden auch alle Signale über 70 geglättet, da der Aroon Up und Down zwischen 0 und 100 oszilliert.

Der Handelsindikator PatternMMB findet die gängigsten Candlestick-Analysemuster und gibt darauf basierende Handelsempfehlungen aus Der Handelsindikator PatternMMB sucht nach Candlestick-Mustern im Preisdiagramm und gibt je nach Art des gefundenen Candlestick-Musters Handelsempfehlungen aus. Es ist auch möglich, akustische Benachrichtigungen zu senden, wenn alle oder einige der ausgewählten Muster erscheinen, mit einer Erklärung des Musters und seiner Interpretation. Darüber hinaus wurden die Ei

Stochastik-Indikator Zeitrahmen optional einfache anpassbare Strategie Möglichkeit, andere Zeitrahmen einzustellen. Zeigt das Signal, den Wert und den eingestellten Zeitrahmen an. BUY-Strategie> Zeitrahmeneinstellung D1 oder H4 Wir handeln auf dem H1-Zeitrahmen Wenn das Signal KAUFEN lautet, suchen wir nach Geschäften zum KAUFEN Wir suchen nach der niedrigsten Unterstützung SELL-Strategie> Einstellung des Zeitrahmens D1 oder H4 Wir handeln auf dem H1-Zeitrahmen Wenn das Signal SELL ist, suche
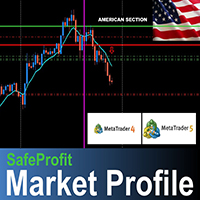
Das SafeProfit-Marktprofil ist der fortschrittlichste Tracking-Indikator im Forex-Markt. Es wurde entwickelt, um das Marktprofil jeder Sitzung des Tages zu verfolgen: asiatisch, europäisch und amerikanisch. Mit dieser Anzeige können Sie Intraday lächelnd bedienen ... und genau wissen, wo sich die Big Player befinden und wann sie genau hingehen. Der Indikator ist einfach, schnell und objektiv und verfolgt jede Preisbewegung der Big Player. Verlassen Sie die 95% -Statistik, die nur dieses sensatio

Dies ist ein professioneller TrendFact-Indikator . Die Kenntnis des Einstiegspunktes jeder Währung ist für jeden Trader, der auf dem Devisenmarkt handelt, sehr wichtig. Dieser Indikator misst die Änderungen in der Trendrichtung für jedes Währungspaar und jeden Zeitrahmen, indem er den eingebauten Autorenalgorithmus verwendet. Die Strategie für den Trendhandel, die Filterung und alle notwendigen Funktionen sind in einem einzigen Tool integriert! Der Indikator zeigt Signale in einer einfachen und

In Out Trend ist ein Trendindikator für die Arbeit auf dem Forex-Markt. Eine Besonderheit des Indikators ist, dass er sicher dem Trend folgt, ohne das Signal zu ändern, wenn der Preis die Trendlinie leicht durchstößt. Der Indikator wird nicht neu gezeichnet.
In Out Trend - der Indikator gibt Einstiegssignale zu den logischsten Preisen, nachdem der Preis die Trendlinie durchstoßen hat. Der Indikator funktioniert auf der Grundlage von mathematischen Berechnungen auf dem Preisdiagramm. Er ist ein

Primary Trend ist ein praktisches Instrument, wenn Sie es gewohnt sind, auf einem sauberen Chart zu handeln, aber manchmal müssen Sie einen Blick auf Primary Trend werfen. Der Primärtrend-Indikator untersucht das Kursgeschehen als eine Sammlung von Preis- und Zeitvektoren und verwendet den Durchschnittsvektor, um die Richtung und Stärke des Marktes zu bestimmen. Dieser Indikator hebt die kurzfristige Richtung und Stärke des Marktes hervor. Der Indikator wird nicht neu gezeichnet. Der Indikator s

Der Icarus Auto Dynamic Support and Resistance Indicator ist ein hochentwickeltes, einfach zu bedienendes Werkzeug zur automatischen Identifizierung von Bereichen mit hoher Kurswahrscheinlichkeit - ohne jegliche manuelle Eingabe. . Alle Händler und Investoren wissen, wie wichtig es ist, horizontale Ebenen auf ihren Charts zu markieren, um Bereiche von Angebot und Nachfrage oder Unterstützung und Widerstand zu identifizieren. Es ist zeitaufwändig und mühsam, alle Instrumente über alle Zeitrahmen
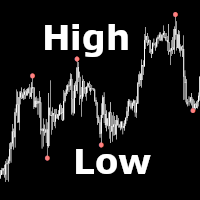
High Low FX zeichnet Punkte, wenn ein neues Hoch oder Tief auftritt. Der Indikator ist für viele verschiedene Strategien interessant. Er kann in EAs verwendet werden. High Low FX generiert auch Alarme, wenn ein neues Hoch/Tief erscheint. Der Indikator ist schnell und malt nicht nach.
️ High Low FX wird nicht neu gemalt.
️ High Low FX benötigt nur ein Minimum an CPU-Leistung.
️ High Low FX kann in EAs verwendet werden.
Um die Extremwerte richtig zu berechnen, ist der Indikator verzögert
Hallo lieber Freund! Hier ist meine Geschichte. Ich bin schnell. Nach vielen Versuchen, manuell zu handeln, beschloss ich, Expert zu verwenden. Ich begann, meinen Roboter zu schreiben. Aber das Testen dauerte sehr lange! Parallel dazu habe ich die Roboter anderer Leute ausprobiert. Und wieder verbrachte ich viel Zeit mit Testen. Nachtscaler, Nachrichtenscaler, Intraday-Scaler und viele andere Klassen... man musste genau wissen, wann der Roboter handelte, wann er Gewinne machte und wann er Verlus
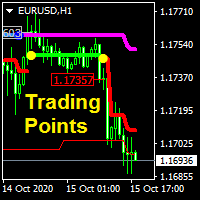
Dieser Indikator analysiert den Preis sowohl in aktuellen als auch in größeren Zeitrahmen, um Trendlinien, Handelssignale und Gewinnmitnahmen zu generieren. Er kann mit allen Finanzinstrumenten oder Wertpapieren arbeiten. Eigenschaften: Trendlinie, Trendlinie ist eine 2 Farben Schema dicke Linie, blaue Linie bezeichnet den Aufwärtstrend und rosa Linie für Abwärtstrend. Handelslinie, die Handelslinie ist eine dicke Linie mit 2 Farben, die grüne Linie steht für ein Kaufsignal und die rote Linie fü

SR ist ein Unterstützungs- und Widerstandsindikator , er zeigt wichtige Hochs und Tiefs durch verschiedene Farben an. Die Farbe eines Levels ändert sich, wenn das letzte Hoch oder Tief es berührt. Wenn ein Balken oberhalb oder unterhalb des Niveaus schließt, wird er gelöscht. extern inputs: loop for candles / colors / drawing time *Dieses Indikatorsignal ist nicht perfekt und muss mit anderen Marktanalysen und Bestätigungen verwendet werden.
FREE

Sehen Sie sich andere großartige Produkte von https://www.mql5.com/en/users/augustinekamatu/seller an .
Dieser Indikator ist bisher der beste, wenn es darum geht, die Währungsstärke der einzelnen Paare zu bestimmen. Er liefert stabile Werte und ist sehr anpassungsfähig an Marktveränderungen. Er ist ein großartiges Werkzeug, das Sie in Ihr Arsenal aufnehmen können, um sicherzustellen, dass Sie jederzeit auf der richtigen Seite des Trends stehen. Es sind keine Eingaben erforderlich, es ist einfach
FREE

Einführung in die Trendzonen: Ihr ultimatives Tool für präzise Marktein- und -ausstiegspunkte.
Trend Zones ist ein revolutionärer MetaTrader 4-Indikator, der Händlern klare Kauf- und Verkaufszonen auf der Grundlage von Trendumkehrungen und Kursbewegungen bietet. Dieser Indikator basiert auf fortschrittlichen Algorithmen und einer Technologie, die nicht nachbildet, und bietet eine unvergleichliche Genauigkeit bei der Identifizierung optimaler Ein- und Ausstiegspunkte im Devisenmarkt.
Hauptmerkm

Breakout Sniper zeichnet Trendlinien mit Hilfe von verbesserten Fraktalen und stellt die Ausbruchs- und Umkehrpunkte dar.
KEIN AUTOMATISCHES NACHZEICHNEN VON TRENDLINIEN FÜR MEHRERE ZEITRAHMEN
*** DA DER STRATEGIETESTER VON MT4 PALTFORM NOCH NICHT UNTERSTÜTZT, MÜSSEN SIE NUR DIE EINGABEN DES "AKTUELLEN ZEITRAHMENS" TESTEN. Eine Trendlinie ist eine Linie, die über Pivot-Hochs oder unter Pivot-Tiefs gezeichnet wird, um die vorherrschende Richtung des Preises anzuzeigen . Trendlinien sind eine vis
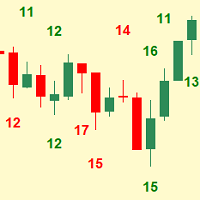
Einfachster Indikator für Balkenschatten. Sehr nützlich für die Känguru-Schwanz-Strategie.
"Schatten" - das ist der Abstand zwischen Hoch und Schluss des Bullen-Balkens und Tief und Schluss des Bären-Balkens. Der Zweck des Schattens ist es, Ihnen zu zeigen, ob der Balken stark ist oder nicht, ob er innerhalb oder außerhalb des Trends liegt. Er hilft sogar dabei festzustellen, ob ein Trend beginnt. Das Muster des Känguru-Schwanzes und des umgekehrten Balkens ist sehr leicht zu erkennen.
Eingabe-A

Fibonacci-Kanal
Was ist ein Fibonacci-Kanal? Der Fibonacci-Kanal ist ein technisches Analyseinstrument, das zur Einschätzung von Unterstützungs- und Widerstandsniveaus auf der Grundlage der Fibonacci-Zahlen verwendet wird. Es handelt sich um eine Variante des Fibonacci-Retracement-Tools, mit dem Unterschied, dass beim Kanal die Linien diagonal und nicht horizontal verlaufen. Es kann sowohl auf kurzfristige als auch auf langfristige Trends sowie auf Auf- und Abwärtstrends angewendet werden. Die
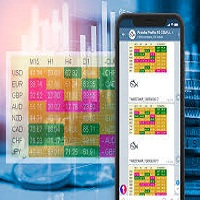
CurrencySt Alerts Metatrader 4 Forex-Indikator
Der CurrencySt Alerts MT4 Forex Indikator zeigt die Trendstärke für die 8 wichtigsten Währungen an: NZD, EUR, GBP, USD, JPY, AUD, CAD und CHF.
Er ordnet die 8 Währungen von sehr stark bis sehr schwach in einer Tabelle ein, die direkt auf dem MT4-Aktivitätsdiagramm zu sehen ist.
Wie handelt man mit dem Indikator Währungsstärke?
Generell gilt, dass Sie immer die stärkste Währung gegen die schwächste Währung handeln sollten.
Wie im untenstehenden
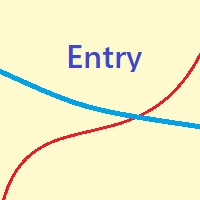
Dieser Cross-MA- und Trendlinien-Indikator definiert Einstiege auf der Grundlage der schnellen und langsamen MA und des vorherigen Bot oder Top. Der Einstieg wird zusammen mit indikativen Preisen für Ziel und Stoploss angezeigt . Er gibt auch einen indikativen pending sl und tp an, falls Sie eine umgekehrte Stop-Order setzen. Die Preise basieren auf Tops und Bots aus meiner Strategie, die ich in meinem anderen Indikator - https://www.mql5.com/en/market/product/56045 - verwende. Der Eintrag zeigt
Beschreibung:
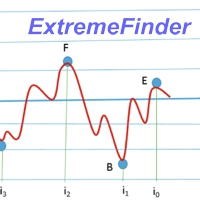
ExtremeFinder analysiert das Diagramm und findet lokale Extrema - Maximum und Minimum. Das gesuchte Extrem ist immer vom entgegengesetzten Typ als das vorherige. Das lokale Extrem wird bestätigt, wenn die Preisdifferenz höher ist als die eingestellte Preisdifferenz, aber nicht früher als nach einer bestimmten Anzahl von Kerzen. Es werden zwei verschiedene Arten der Bestätigung von lokalen Extremen durchgeführt: Normal für gewöhnliche Preisänderungen, Quick für steile Preisänderung
Dieser Indikator hält, was der Name verspricht! Er erfasst die größten Bewegungen wöchentlich auf dem 4-Stunden-Zeitfenster. Dieser Indikator kann für jedes Paar und jeden Zeitrahmen verwendet werden, aber der 4-Stunden-Rahmen ist am zuverlässigsten. Er funktioniert am besten vor wichtigen Nachrichtenveröffentlichungen, überprüfen Sie forexfactory.com, um zu erfahren, wann wichtige Nachrichten veröffentlicht werden. Die Anwendung ist einfach: Handeln Sie einfach, wenn Sie die Pfeile erscheinen s

Der Indikator der Indikatoren. Die leistungsfähigste Technik zur Bestimmung der Forex-Trendstärke im Jahr 2023. Wir haben Supreme Commander so perfektioniert, dass er einen Durchschnitt der ausgewählten Indikatoren (bis zu 16) und des ausgewählten Zeitrahmens (alle) berechnet, mit dem Ergebnis eines einzigen Trends, der das Potenzial von Kauf und Verkauf anzeigt. Er umfasst die folgenden Indikatoren:
Beschleuniger/Verzögerer-Oszillator Index der durchschnittlichen Richtungsbewegung (Average Dire

Bei diesem Indikator handelt es sich um einen Indikator für die automatische Wellenanalyse, der sich perfekt für den praktischen Handel eignet! Fall...
Hinweis: Ich bin es nicht gewohnt, westliche Namen für die Welleneinstufung zu verwenden. Aufgrund des Einflusses der Namenskonvention von Tang Lun (Tang Zhong Shuo Zen) habe ich die Grundwelle als Stift und das sekundäre Wellenband als Segment bezeichnet Gleichzeitig hat das Segment die Trendrichtung benannt (diese Benennungsmeth
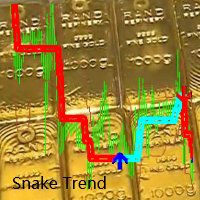
"Zusammen wachsen!" "Cooperative QQ: 556024" "Kooperation wechat: 556024" "Genossenschaftliche E-Mail: 556024@qq.com"
"Der Trend bildet sich oder stirbt und folgt der kreisenden tanzenden Schlange, die sich gemeinsam vorwärts bewegt und niemals aufgibt "Deutlich sichtbares langes und kurzes Urteil, folge ihm!" "Die verdrehte Schlange ist die Leiter, die Schritt für Schritt zum Trend führt, auf- und absteigt!" "Wir sind mit Trend gut befreundet und Shock ist auch unser bester Partner!" "

Der Indikator wird mit einem einzigartigen Algorithmus erstellt, für den es keine Analoga gibt. Auf der Grundlage der Berechnungen werden der Kontraktpreis selbst und die darin angezeigten Prozentsätze berechnet, die im Indikator in Form von Histogrammen in zwei Zeichnungsoptionen sowie in sechs Optionen für die Darstellung von Preisen auf einem Diagramm in verschiedenen Kombinationen angezeigt werden, wodurch Sie das Interesse aller Handelsteilnehmer in Form von Zeichnungsebenen für Unterstützu

Der Magic Arrow Scalper sortiert Signale mit geringer Wahrscheinlichkeit in einer Handelsstrategie aus. Der Indikator verwendet einen hochentwickelten Filteralgorithmus, der auf der Marktstimmung und dem Trend basiert. Der Indikator zeigt Pfeile auf einem Diagramm an (siehe beigefügte Screenshots), die eine wahrscheinliche Preisumkehr anzeigen. Der Magic Arrow Scalper wird nicht neu gezeichnet. Sobald die Kerze geschlossen ist, wird ein Signal bestätigt und verschwindet nie aus dem Chart. Sie kö
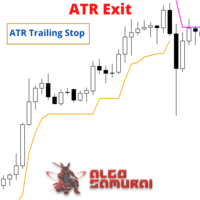
Der ATR-Exit-Indikator verwendet den Kerzenschluss + ATR-Wert, um Trailing-Stop-Linien zu ziehen (orange unter Käufen, magenta über Verkäufen), die mit dem Trend vorrücken, bis der Trend seine Richtung ändert. Er verwendet ein Vielfaches der Average True Range (ATR), indem er ihren Wert vom Schlusskurs bei Käufen subtrahiert und ihren Wert zum Schlusskurs bei Verkäufen addiert. Außerdem werden die Trailing-Stop-Linien so generiert, dass sie die Trendrichtung des Auftrags (Long oder Short) unter
FREE

DIE ERSTEN 10 EXEMPLARE ZU 30 USD, DER NÄCHSTE PREIS WÄRE 65 USD
HAWA MOMENTUM & TREND PRO (MT4) Fortgeschrittener Handelsindikator mit vordefinierten Ein- und Ausstiegslevels und einer Gewinnrate von fast 80%. Sein intelligenter und fortschrittlicher Algorithmus erkennt den Trend und die Trendstärke, indem er das Momentum für maximale Gewinne nutzt und Signale sendet, nachdem er das Marktrauschen herausgefiltert hat. EINSTELLUNGEN: Bitte stellen Sie sicher, dass alle Eingaben in den Indikato

Wir stellen den Austin Trend Scanner vor: Ihr ultimatives Werkzeug zur rechtzeitigen Trendidentifikation.
Der Austin Trend Scanner ist ein bahnbrechender MetaTrader 4-Indikator, der sorgfältig entwickelt wurde, um Händlern präzise Trendumkehrsignale über mehrere Zeitrahmen hinweg zu liefern. Dieser Indikator basiert auf fortschrittlichen Algorithmen und einer Technologie, die nicht nachzeichnet, und bietet eine unvergleichliche Genauigkeit bei der Identifizierung profitabler Handelsmöglichkeite

Der Icarus Reversals(TM) FREE Indikator ist ein leistungsfähiges Instrument zur Identifizierung von Umkehrpunkten mit hoher Wahrscheinlichkeit, und zwar für alle Instrumente. Der Reversals-Indikator bietet Händlern und Anlegern einen einfach zu bedienenden und hochdynamischen Einblick in Punkte mit wahrscheinlichen Kursumkehrungen. Der Reversals Indicator (KOSTENLOSE Version) wird durch ein einzigartiges proprietäres Codeset generiert und erzeugt Long- und Short-Handelssignale, die in Bezug auf
FREE

Watch the Clock zeigt die Uhrzeit im Chartfenster. Die Uhrzeit ist nützlich, wenn du wissen möchtest, wann die Kerze schliesst. Du kannst auch einen Alarm setzen - zum Beispiel vor wichtigen News.
️ Watch the Clock funktioniert auch im Strategy Tester
️ Watch the Clock arbeitet effizient.
️ Watch the Clock kann deinen manuellen Tradingstyle verbessern.
Inputs Alert -> Um welche Uhrzeit soll ein Alarm erscheinen? Time Shift in Minutes -> Soll die Uhrzeit um x Minuten verschoben werden? Size

Der Icarus Reversals(TM)-Indikator ist ein leistungsfähiges Instrument zur Identifizierung von Umkehrpunkten mit hoher Wahrscheinlichkeit, und zwar für alle Instrumente. Der Reversals-Indikator bietet Händlern und Anlegern einen einfach zu bedienenden und hochdynamischen Einblick in die Punkte, an denen eine Kursumkehr wahrscheinlich ist. Der Reversals Indicator wird von einem einzigartigen, proprietären Codesatz generiert und erzeugt Long- und Short-Handelssignale, die für alle Eingaben angepas
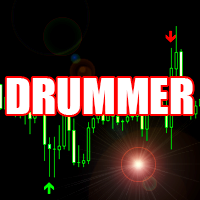
Der Frühindikator berechnet die wahrscheinlichsten Orte für eine Trendumkehr oder einen Stopp.
Ein Anwendungsbeispiel ist auf dem Screenshot mit dem ChainVector Trading Panel (https://www.mql5.com/en/market/product/49155) zu sehen.
Support: https://www.mql5.com/en/channels/TrendHunter Dieser Indikator kann als eigenständiges Handelssystem oder als zusätzlicher Teil eines anderen Handelssystems verwendet werden. Unterstützung: https: // www.mql5.com/en/channels/TrendHunter
Weitere Produkte fi

Der Indikator ermöglicht Ihnen den Handel mit binären Optionen. Der empfohlene Zeitrahmen ist М1 und die Verfallszeit ist 1,2 Minuten. Der Indikator ist für den automatischen und manuellen Handel geeignet. Ein mögliches Signal wird als Pfeile über/unter einer Kerze angegeben. Sie sollten warten, bis die Kerze geschlossen ist! Die Pfeile werden nicht neu gezeichnet Handelssitzungen: US-Abschnitt Währungspaare: Beliebig Arbeits-Zeitrahmen: M1 Verfallszeit: 1,2,3,4,5 (abhängig vom Paar - kontakt

Der Indikator ermöglicht Ihnen den Handel mit binären Optionen. Der empfohlene Zeitrahmen ist М1 und die Verfallszeit ist 2,3 Minuten. Der Indikator ist für den automatischen und manuellen Handel geeignet. Ein mögliches Signal wird als ein Pfeil über/unter einer Kerze angegeben. Sie können aktuelle oder neue Kerze eingeben Pfeile werden nicht neu gezeichnet Handelssitzungen: US-Abschnitt Währungspaare: Beliebig Arbeits-Zeitrahmen: M1 Verfallszeit: 2,3,4,5 (abhängig vom Paar) Beim automatische

Sehen Sie sich andere großartige Produkte von https://www.mql5.com/en/users/augustinekamatu/seller an .
Dieser Indikator findet die Einstiegspunkte auf der Grundlage von Divergenzen gängiger Indikatoren und malt nicht nach . Die verwendeten Prinzipien stellen sicher, dass er für CFDs, Rohstoffe und Aktien mit unglaublich guten Ergebnissen verwendet werden kann. Mit dem richtigen Geldmanagement und der richtigen Portfoliobalance kann der Indikator auf jede Handelsstrategie angewendet werden, um
FREE

Dies ist ein vollständiger HiLo-Aktivator-Indikator. Es handelt sich um einen Trendindikator, der in der Lage ist, eine Trendwende zu signalisieren und so für mehr Durchsetzungsvermögen bei den Einstiegen zu sorgen. Für die Perioden M30, M15 und M5 empfehlen wir das Setup: HiLo Perioden 27, MA Methode Exponential. Für H1 oder darüber empfehlen wir das Setup: Hilo Perioden 13, MA-Methode geglättet. -- Perioden Kontrolle -- MA Glättungsart Steuerung -- MA Linienbreite Kontrolle

Der Candle High Low Exit-Indikator verwendet das höchste Hoch und das niedrigste Tief einer Handelsspanne, um Trailing-Stop-Linien zu zeichnen (orange unter Käufen, magenta über Verkäufen), die sich mit dem Trend bewegen, bis der Trend seine Richtung ändert. Außerdem werden die Trailing-Stop-Linien so generiert, dass sie die Trendrichtung des Auftrags (Long oder Short) unterstützen: In einem Aufwärtstrend erscheint die lange Trailing-Stop-Linie (orangefarbene Linie unter "Buy") und bewegt sich n
FREE
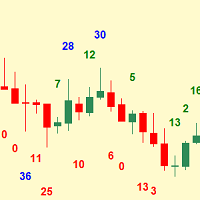
Einfachster Indikator für Balkenschatten. Sehr nützlich für die Känguru-Schwanz-Strategie.
"Schatten" - das ist der Abstand zwischen Hoch und Schluss des Bullen-Balkens und Tief und Schluss des Bären-Balkens. Der Zweck des Schattens ist es, Ihnen zu zeigen, ob der Balken stark ist oder nicht, ob er innerhalb oder außerhalb des Trends liegt. Er hilft sogar festzustellen, ob ein Trend beginnt. Eingabe-Argumente: Wie viele Prevoius-Balken berechnet werden sollen Wert, der übergeben werden soll, um
FREE
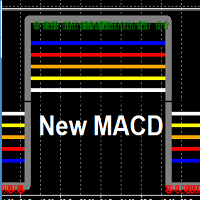
Dies ist ein neuer Single/Multi-Zeitrahmen-Indikator, der auf dem Konzept der gleitenden Durchschnittsdivergenz basiert. Sie können ihn in verschiedenen Modi verwenden: Einzelner Zeitrahmen-Modus: (2. bevorzugt) Sie geben die Zeitrahmen alle mit der gleichen Periode ein - Sie erhalten eine Rechteckwelle für Bären-/Bullenbereiche Zwei-Zeitrahmen-Modus: (1. bevorzugt) Sie geben die beiden Zeitrahmen ein, die Sie bevorzugen - Sie erhalten zwei Rechteckwellen, die die 2 Zeitrahmen repräsentieren - W
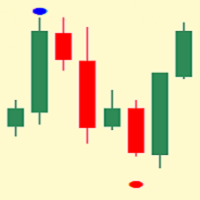
Indikator, der zwei Bars Cluster Bot und Top zeigt. Es zeigt Ihnen die Bildung Top/Bot auf der Grundlage der Schlusskurse. Sie können die tatsächliche Unterstützung und Widerstand zu sehen.
Der Indikator akzeptiert drei Argumente: Startbar - ab welchem Bar die Berechnung beginnen soll Größe des Punktes auf dem Chart (in Schriftgröße) Abstand vom Top/Bot Hinweis: Der Indikator funktioniert in dem Zeitrahmen, in dem Sie sich gerade befinden. Dieser Indikator ist sehr einfach, lenkt Sie nicht ab u

Chỉ báo tự động rút ra mức thoái lui fibonacci của tháng và năm. Zeichne von demselben oder unter demselben oder auf demselben des Baumes vor diesem. https://www.mql5.com/en/charts/12730171/audusd-pro-d1-axicorp-financial-services. Màu đỏ là tháng fibonacci Màu vàng là tuần fibonacci Weiße Farbe ist das Fibonacci-Datum Die rote Farbe ist der Fibonacci-Monat Gelbe Farbe ist Fibonacci tuần Weiße Farbe ist Fibonacci-Datum Die rote Farbe ist der Fibonacci-Monat Gelbe Farbe ist Fibonacci tuần Weiße

Market Calculator ist ein leistungsstarkes Tool, mit dem Sie die wichtigsten Parameter eines Handels einfach und schnell berechnen können: Lot-Größe, StopLoss und TakeProfit, sowie die Schätzung der Höhe der Mittel (erforderliche Margin) zur Eröffnung einer Position. Das Programm hat eine sehr bequeme und intuitive Steuerung, da es im Stil von OS Windows implementiert ist. Es gibt viele interessante und praktische Funktionen - schauen Sie sich einfach das Video an: youtu.be/FG2qqTJTIhE Alle Prog

Breakout FX zeichnet Pfeile und gibt Alarme aus, wenn der Preis die letzten n Kerzen über- oder unterschreitet.
️ Breakout FX kann in Expert Advisors verwendet werden.
️ Breakout FX kann bereits vorhandene Trading Strategien verbessern.
️ Breakout FX arbeitet sehr schnell und repainted nicht.
Inputs Breakout Range [Candles] Breakout Price Type Arrow Size Enable Alerts Enable Push Notifications Enable Emails

Der Icarus Bolli-Band Change Display(TM)-Indikator ist ein einfaches, aber höchst effektives Instrument zur visuellen Identifizierung von Bereichen, in denen sich die wichtigen Bollinger-Band-Werte in einem Zustand der Expansion, Kontraktion oder keinem von beiden befinden. Die traditionellen Bollinger-Bänder werden seit ihrer Erfindung durch John Bollinger vor mehreren Jahrzehnten weltweit auf Trading-Charts angewendet. Eine der Einschränkungen der traditionellen Bollinger-Bänder ist die Fähigk

Der Devisenmarkt kann viele verschiedene Preispfade durchlaufen, um einen bestimmten Punkt in der Zukunft zu erreichen. Die Zukunft ist dynamisch. Daher ist die Planung eines Handels mit einem möglichen Zukunftsszenario ein wesentlicher Schritt für Ihren Erfolg. Zu diesem Zweck stellen wir Ihnen Trend Units vor.
Eine einzigartige Strategie des Autors, die gleichzeitig die Stärke der Trends und die Einstiegspunkte in den Markt bestimmt und diese mit Hilfe von Pfeilen auf dem Chart visualisiert.

Der LSM Basket Indicator ist ein ideales Werkzeug für den Handel mit Korbwährungen für Scalping/Daytrading oder Swingtrading. Eingebettete Werkzeuge: 1. MTF(Multi Time frame) Basket Currency Trend-Filtersystem . 2. Identifizierung des Basket Currency Trendumkehrbereichs (in Kombination mit dem " SupplyDemand Zones Indicator " ) 3. Basket Currency Strength Indikator. 4. Chartsymbole ändern (siehe Video) 5. Tägliche Symboländerung in %.
Parameter:
Alarm bei "Erreichtes Kauf-/Verkaufsniveau: true

Trend Code (v2.0) Trend Code ist ein sehr einfacher und dennoch effektiver Trendindikator zur Erfassung von Trendbewegungen, zur Erkennung von Trendumkehr, zur Berechnung des Einstiegskurses und des richtigen Stop Loss. Der Trend Code Indikator besteht aus einer Reihe von Blöcken, wobei der Bullen-Trend-Block in der Bullen-Farbe und der Bären-Block in der Bären-Trend-Farbe dargestellt wird. Beim Bullen-Trend-Block ist der TrendOpen der untere Rand, der TrendClose der obere Rand, beim Bären-Tren

Hit Man ist ein Indikator zur Bestimmung des Trends, der jede Strategie ergänzt und auch als eigenständiges Instrument verwendet werden kann. Professioneller Indikator zur Bestimmung des Trends und der Einstiegspunkte. Er verwendet einen einzigartigen Filteralgorithmus, um den Trend zu bestimmen. Zeigt eine Änderung der Richtung der Preisbewegung bei beliebigen Währungspaaren an, ohne das Ergebnis neu zu zeichnen. Geeignet für die Bestimmung von Einstiegspunkten für Scalping und Swing, sowie fü

Kein Redrawing, keine Verzögerung, kein Nachmalen der Pfeile, Indikator für binäre Optionen und Forex
WENN SIE IRGENDWELCHE FRAGEN, BERATUNGEN ODER AKTIVIERUNGEN DER INDIKATOREN HABEN, KONTAKTIEREN SIE MICH BITTE SOFORT UNTER MEINEM PERSÖNLICHEN TELEGRAMM Wenn Sie diesen Indikator kaufen, erhalten Sie zwei kostenlose Indikatoren mit binären und Forex-Vorlage für Metatrader 4 Einer ist ein Bot überprüfen Sie dort, es sendet Ihnen automatisch Signale, Sie führen nur nach dem Signal,

Switchman ist ein intelligenter Indikator, der ohne Verzögerungen oder Neuberechnungen den Trend in den ausgewählten Zeitrahmen anzeigt. Die wichtigste Aufgabe eines Händlers ist es, einen Trend zu erkennen und ihm rechtzeitig zu folgen.
Der Indikator verwendet einen Algorithmus zur Berechnung möglicher Preisumkehrungen. Er kann als Zusatz- oder Hilfsinstrument für Ihre Handelsstrategie verwendet werden. Es wird der aktuelle Zeitrahmen verwendet, auf den der Indikator eingestellt ist.
Dazu we
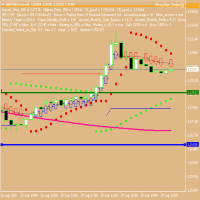
Mein Trend-Finder
//**************************** KOSTENLOSES Signal, das alle drei meiner Indikatoren verwendet, können Sie gerne kopieren siehe Link unten https://www.mql5.com/en/signals/1318509?source=Site+Signale+Mein //**************************** Periode ist die einzige Einstellung, im Grunde die Anzahl der Balken auf dem von Ihnen gewählten Zeitrahmen, Anhängen an ein Diagramm mit beliebiger Zeitskala Zeitraum in Balken = 7, was ein kurzer Überwachungszeitraum ist, 100 wäre eine längere Ü
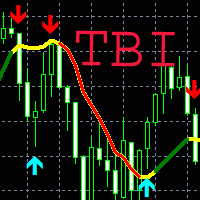
Einfache visuelle und effektive Trend-Erkennung.Das Signal wird auf "geschlossene Kerze" erhalten.Funktioniert auf allen Symbolen und Zeitrahmen.Der Indikator verwendet keine Eingabe-Parameter.Alle Algorithmen für die Berechnung sind in den Code eingebettet.Der Indikator kann verwendet werden, um Expert Advisors zu entwickeln.Ändern Sie die Farbe des Indikators, charakterisiert das Marktverhalten.Grüne Farbe signalisiert Aufwärtsbewegung.Rote Farbe signalisiert Abwärtsbewegung.Gelbe Farbe zeigt

HJZHI88888888888888888888888888888888888888888888888888888888888888888888888888888888888888888888888888888888888888888888888888888888888888888888888888888888888888888888888888888888888888888888888888888888888888888888888888888888888888888888888888888888888888888888888888888888888888888888888888888888888888888888888888888888888888888888888888888888888888888888888888888888888888888888888888888888888888888888888888888888888888888888888888888888888888888888888888888888888888888888888888888888888888
FREE

Sie befinden sich in einem gewinnbringenden Handel... sollten Sie den Gewinn jetzt mitnehmen oder abwarten...? Dieser einfach zu bedienende Dynamic Take Profit Indicator hilft Ihnen bei der Entscheidung, wann Sie aus einem gewinnbringenden Handel aussteigen sollten. Sie können auch jeden EA überwachen oder überstimmen, wenn Sie eine offene Order beim manuellen Handel schließen wollen, oder die Puffer[1][2] auslesen, um sie in einen Experten zu integrieren! Sobald der Kurs die gelbe Linie übersc

Der Indikator findet die Niveaus des maximalen und minimalen Preisvolumens (Marktprofil) auf dem Arbeitsbalkendiagramm für die angegebene Anzahl von Balken. Verbundprofil. Die Höhe des Histogramms ist vollautomatisch und passt sich an jedes Werkzeug und jeden Zeitrahmen an. Der Algorithmus des Autors wird verwendet und wiederholt bekannte Analoga nicht. Die Höhe der beiden Histogramme ist ungefähr gleich der durchschnittlichen Höhe der Kerze. Smart Alert (Smart alert) hilft Ihnen, den Preis i

Der Indikator analysiert die angegebene Anzahl von Kerzen und zeichnet Fibonacci-Niveaus basierend auf dem Hoch-Tief. Da sich die Ebenen neu anordnen, interessieren wir uns für die rechte Seite des Bereichs. Der Preis magnetisiert die Niveaus und reagiert auf die Berührung. Verwenden Sie dieses Tool, um nach einer Korrektur einen Trendeintrittspunkt zu finden. Wenn wir links sehen, dass die Pegel perfekt angestiegen sind, können wir davon ausgehen, dass wir das Ende der Bewegung am Extrempunkt g
FREE

Beschreibung
Range Detector ist ein Indikator, der Impulse im Markt identifiziert und deren Neigungswinkel im Chart anzeigt.
Empfehlungen
Sie können diesen Indikator verwenden, um einen Trend zu ermitteln und dementsprechend die Richtung der Eröffnung einer Position oder der Schließung einer entgegengesetzten Position zu bestimmen.
Parameter
===== _INDICATOR_SETTINGS_ ===== - Einstellungen des Indikators
Maximum History Bars - maximale Anzahl von History Bars für die Berechnung des Indika

Der Indikator sucht und zeigt Doji-Kerzenhalter auf dem Diagramm an und signalisiert das Auftreten einer solchen Kerze. Die Richtung des Signals hängt von der Richtung der vorherigen Kerzen ab, da der Doji eine Umkehrung oder Korrektur signalisiert. Zusätzlich zur Möglichkeit der Signalisierung wird die Stärke der Umkehrung grafisch dargestellt (je grüner, desto wahrscheinlicher ein Anstieg, desto roter ein Preisverfall). In den Anzeigeeinstellungen können Sie die Parameter des Doji-Kerzenhalte
FREE
Der Icarus Signals Continuation(TM)-Indikator ist ein einfaches, aber höchst effektives Instrument zur Identifizierung starker Preistrends, sowohl long als auch short, über alle Zeitrahmen und Instrumententypen hinweg. Der Icarus Continuation Indicator ermöglicht es dem Benutzer, individuelle Marker für jeden Balken zu zeichnen, wenn sich der Preis nach einer bestimmten Ausdehnung in einen Bereich mit hoher Wahrscheinlichkeit ausgedehnt hat. Der Fortsetzungsindikator ermöglicht dem Benutzer die

Reversal Sniper wurde entwickelt, um die extremen Umkehrungen des Preises zu finden. Der Indikator sammelt die Daten des Cycle Sniper Indikators.
HINWEIS: Der REVERSAL SNIPER Indikator ist für Cycle Sniper Benutzer als zusätzliches Werkzeug gedacht. Er kann jedoch auch von Händlern verwendet werden, die starke Umkehrniveaus ausfindig machen wollen.
Der Indikator funktioniert auf allen Timeframes und allen Instrumenten.
Reversal Sniper prüft: Harmonische Patterns RSI Zig Zag und harmonische A
MetaTrader Market - der einzige Shop, in dem man Handelsroboter als Demoversion herunterladen und testen sowie anhand historischer Daten optimieren kann.
Lesen Sie die Beschreibung und Bewertungen anderer Kunden über das gewünschte Produkt, laden Sie es direkt ins Terminal herunter und erfahren Sie, wie man einen Handelsroboter vor dem Kauf testet. Nur bei uns können Sie ein Programm testen, ohne dafür zu bezahlen.
Sie verpassen Handelsmöglichkeiten:
- Freie Handelsapplikationen
- Über 8.000 Signale zum Kopieren
- Wirtschaftsnachrichten für die Lage an den Finanzmärkte
Registrierung
Einloggen
Wenn Sie kein Benutzerkonto haben, registrieren Sie sich
Erlauben Sie die Verwendung von Cookies, um sich auf der Website MQL5.com anzumelden.
Bitte aktivieren Sie die notwendige Einstellung in Ihrem Browser, da Sie sich sonst nicht einloggen können.