Neue technische Indikatoren für den MetaTrader 4 - 40

Hello all. This indicator helps you to open a trade, when break out occurred, also you can add to your position and ride it if trend continued. I use it on 1-5 min chart, as you can use short stop loss. Also profit target should be small as well. It is better to enter few small position, so you can book some profit early and ride the rest for bigger gains. Look at the past to have a plan. Enjoy.
FREE
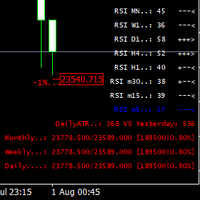
This indicator was created most for personal use. I decided to look up the last 3 bars of RSI, it is good for scalping or for weekly trading and looks as universal fx-toy. In menu you can turn on daily percentage gain info, it is good for crypto as for me, weekly and monthly gains also included as informers. Short ATR helps to determine when price was stopped and entry for pulse pump/dump. The filter of numbers of RSI can be tuned for overbought/oversold values with colors you needed. Exam
FREE
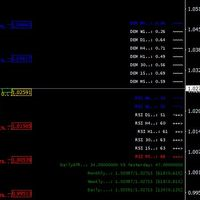
I decided to add parallel function with DeMarker to free version of my indicator with RSI MTF. it is good for scalping or for weekly trading and looks as universal fx-toy. In menu you can turn on daily percentage gain info, it is good for crypto as for me, weekly and monthly gains also included as informers. Short ATR helps to determine when price was stopped and entry for pulse pump/dump. The filter of numbers of RSI can be tuned for overbought/oversold values with colors you needed. Examp

Long term stats is a trend indicator. As the name suggests, it computes long term running average, standard deviation and min/max values Average and standard deviation are plotted on the graph and deviation value is taken as input parameter (similarly to bollinger bands). Historical minimum and maximum are plotted on the graph and updated for each bar, considering historical time series slope. (this is to somehow account for inflation/deflation) Can be used as filter for signals, as trigger to
FREE

Currently switched to the 4 hour chart - but use other time frames for confirmation. :-) I change my main time frame based on the market movement at the time. The Hurricane Forex Indicator is a multi time frame indicator that includes such things as Trade Notifications, Trade Calculator, Momentum Indicator, risk reward and much more. We have a free Trade room for our users as well. Please check out the video for full details of how this indicator works as it has over 15 years worth of developme

Welcome to Upside Down !
Upside Down is a powerful indicator that gives the perfect trading opportunities and a clear indication of the market. Upside Down has been created to be as simple as possible. Arrows are calculated based on ASC Trend and customs indicators . Signals appear without delay at the end of a candle, if it has tested the level. The signals do not overdraw.
THE BENEFIT:
Easily to enter in buy position/sell position Intuitive directional arrows by co

- 50% OFF -
Telegram group : https://t.me/+5RIceImV_OJmNDA0 MT5 version : https://www.mql5.com/en/market/product/85917?source=Site+Market+Product+Page
Master Pullback is a complete system that gives unique trading opportunities and a clear indication of the market: trend, signals as well as stop loss and take profit levels. This system has been designed to be as simple as possible and detects extreme overbought and oversold zones, support and resistance levels, as well as the major trend. You

Gold Buster M1 System ist ein professionelles Handelssystem für M1-Charts auf dem XAUUSD-Paar. Aber trotz der Tatsache, dass das System ursprünglich ausschließlich für den Handel mit Gold entwickelt wurde, kann das System auch mit einigen anderen Währungspaaren verwendet werden. Nach dem Kauf gebe ich Ihnen eine Liste von Handelspaaren, die zusätzlich zu XAUUSD mit dem System verwendet werden können, was Ihre Möglichkeiten zur Verwendung dieses Systems erweitert. ALLE ANZEIGEN IM SYSTEM WIEDERHO

Gorilla Channel VZ ist ein Kanal-Indikator, der auf der Grundlage jahrelanger Beobachtungen verfeinert wurde.
Signal-Trading Indikator kann sowohl als Indikator, in dem Trend-Kanal, als auch als einer der Signalquelle am Eingang, sofern eine weitere Filterung. Mit dem richtigen Ansatz mindestens 80% der erfolgreichen Transaktionen.
Hauptmerkmale von Gorilla Channel VZ: analytische Funktion
Kann für alle Währungspaare und Zeitrahmen verwendet werden; Der Indikator wird nicht neu gezeichne
FREE

UR-Hochs und -Tiefs
UR Highs&Lows führt eine eingehende Analyse der Preisbewegung und ihrer Volatilität durch und erstellt einen Kanal, innerhalb dessen sich der Preis bewegt. Dieser Kanal bewegt sich jetzt als Oszillator und wird mit der Abweichung des Preises überlagert, um potenzielle Erschöpfungen und mögliche Umkehrungen anzuzeigen.
Vorteile der Verwendung von UR Highs&Lows:
Keine Parameter Sie haben 3 Linien, die die Preisbewegung beschreiben – die weiße Linie, die einen Durchschn

Panda Oscillator ist ein neuer Indikator für das Scalping des Autors.
Ein Indikator, der Signale basierend auf den Messwerten eines ganzen Komplexes von Standard- und urheberrechtlich geschützten Werkzeugen gibt.
Hauptmerkmale von Panda Oscillator: analytische Funktion
Kann für alle Währungspaare und Zeitrahmen verwendet werden; Der Indikator wird nicht neu gezeichnet; Ideal als Ergänzung zu anderen Indikatoren; Grafische Funktionen
Nimmt den minimalen Platz in der Grafik ein; Flexi
FREE
Binaripex ist ein Indikator für binäre Optionen. Der Indikator zeigt mit einem Pfeil auf dem Chart an, in welche Richtung sich der Kurs in naher Zukunft bewegen wird. Unseren Statistiken zufolge wird der Preis in naher Zukunft (von 1 bis 5 Minuten in kleinen Zeiträumen) in 95 % der Fälle über oder unter die Pfeilanzeige fallen. Dadurch können Sie diesen Indikator mit hoher Effizienz für den Handel mit binären Optionen verwenden. Außerdem zeigt der Indikator auf dem Diagramm bei jeder Transaktio
Average directional index - verbesserte Indikatorformel. Diese Version von ADX bestimmt die Preisumkehrpunkte und die Richtung des aktuellen Trends viel genauer. Darüber hinaus können Sie mit diesem Indikator die Stärke des Trends bestimmen. Wenn die grüne Linie die rote Linie von unten nach oben kreuzt, bedeutet dies, dass der Trend nach oben dreht oder sich ein vorübergehender Pullback bildet. Wenn die rote Linie die grüne Linie von oben nach unten kreuzt, bedeutet dies, dass der Trend nach u
Dieses Programm macht die Analyse mehrerer Zeitrahmen bequemer.
Es hilft, alle Diagramme in einem anderen Zeitrahmen zu synchronisieren, um dasselbe Symbol anzuzeigen. denselben bestimmten Zeitraum und synchronisieren Sie Zeichnungsobjekte, die auf allen Diagrammen gleichzeitig angezeigt werden
Objektsynchronisationsunterstützung: Vertikale/Horizontale Linie, Trendlinie, Rechteck, Pfeil, Fibo-Retracement
Zusätzliches Feature: Trendlinien-Alarm
Wie man es benutzt >> https://youtu.be/NEHU
FREE
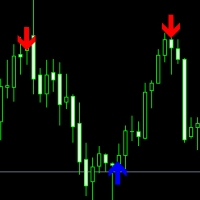
Price reversal Pro - Punkte, an denen sich der Preis mit einer Wahrscheinlichkeit von 95 % umkehrt. Diese Informationen helfen jedem Trader, Trades effektiv zu eröffnen. Der Indikator auf dem Chart zeichnet Pfeile, an welcher Stelle und in welche Richtung sich der Preis umkehren wird. Sie müssen warten, bis der Indikator einen Pfeil zeichnet und eine Order in der angegebenen Richtung eröffnen.Dies ist die einfachste Handelsstrategie. Der Indikator zeichnet seine Pfeile nicht neu und zeigt Preis
Fixation Trend indicator showing buy and sell areas. The indicator follows the price movement, works at the opening price. It also displays information about the trend following the breakout of the minimum and maximum. The indicator has very simple but effective graphics: above the opening price, an orange dot is displayed - a sell signal, below the opening price - blue, a buy signal. The indicator also accompanies the signals with a sound alert and a pop-up window notifying the signal on the op
Are you tired of the constant ups and downs? Do not become a victim of unstable market movements, it's time to get rid of it somehow! Already now you can use The Trend Setter solutions to balance the price movement analysis and get a clearer picture of the price action.
The Trend Setter is a trend indicator for the MetaTrader 4 trading platform. If you don't have your own trading strategy yet, you can use our ready-made trading strategy. The indicator will help in finding entry points when an

Polynomial Trend - A tool that allows you to determine the direction and strength of a trend. Unlike most indicators, Polynomial Trend finds longer-term trends and gives fewer false signals. This indicator allows you to find the most likely trend reversal points b allows you to identify the current market phase (uptrend, downtrend).
This indicator displays arrows of different colors depending on the current state of the market and thus signals the user about a change in trend. It is easy to u

What are "pivot points"? Pivot point analysis is often used in conjunction with the calculation of support and resistance levels, as is the case with trend line analysis. Pivot point analysis calculates the first support and resistance levels using the trading range width between the pivot point and the previous day's high or low price. The second support and resistance levels are calculated using the entire width between the previous day's high and low prices.
Looking for a quality pivot poi

Introduction to Chart Pattern MT Chart Pattern MT is a chart pattern scanner to detect the triangle pattern, falling wedge pattern, rising wedge pattern, channel pattern and so on. Chart Pattern MT uses highly sophisticated chart pattern detection algorithm. However, we have designed it in the easy to use with intuitive user interface. Chart Pattern MT will show all the patterns in your chart in the most efficient format for your trading. You do not have to do tedious manual pattern detection an
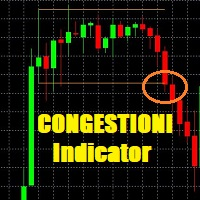
This indicator is very usefull to TRADE Trading Ranges and helps identify the following TREND. Every Trader knows that any market stay 80% of the time in trading ranges and only 20% of the time in TREND; this indicator has been built to help traders trade trading ranges. Now instead of waiting for the next TREND, You can SWING TRADE on trading ranges with this simple yet very effective indicator.
TRADING with CONGESTIONI INDICATOR:
The CONGESTIONI Indicator identify a new trading range and a
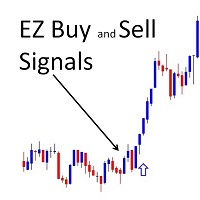
!! FLASH SALE !! Over 80% off !! For ONE week only. Now only $47 - normally $297! >>> Ends on 30 June 2023 - Don't miss it!
Buy and Sell Signals Directly Onto Your Charts. It couldn't be EZ-er! Aslo Gives Alerts – On Your MT4 To Your Phone To Your Email.
Does not repaint! This couldn't be EZ-er to use - just drag it onto your chart (any timeframe, any pair) set the time of day you want signals and where you want alerts, and wait for the signals. Spreads from 0.1pip RAW/ECN Acc
Reminder: After purchasing the unlimited version of this indicator send me the proof and I will add you to my private group so that you join the community and continue to learn more about this tool and grow together with other traders. You will also learn the strategy that will change your trading story! Dear Traders I am so glad to introduce my forex trading product called "Day Traders Master Board". This tool is designed for serious traders of any trading strategy. My goal is to help trader b

The Mechanism Trend indicator is a hybrid indicator that shows the moments for entering the market with arrows. This indicator was created on the basis of the original indicators for searching for extreme points, the indicator is well suited for determining a reversal or a large sharp jerk to one side.
When the trend changes, the Mechanism Trend indicator uses color signaling: green - when changing from a downtrend to an uptrend, and red - vice versa, to a downtrend. You can use the indicator

This indicator provides several drawing tools to assist in various methods of chart analysis.
The drawings will keep their proportions (according to their handle trendline) across different chart scales, update in real time, and multiple drawings are supported.
#
Drawing Option
Description
1 Grid box draggable boxed grid, user defines rows x colums, diagonal ray option 2 Grid partial or fullscreen grid, sized by handle line 3 Grid flex a diagonal grid, sized and sloped by handle line

Market Profile 3 MetaTrader 4 indicator — is a classic Market Profile implementation that can show the price density over time, outlining the most important price levels, value area, and control value of a given trading session. This indicator can be attached to timeframes between M1 and D1 and will show the Market Profile for daily, weekly, monthly, or even intraday sessions. Lower timeframes offer higher precision. Higher timeframes are recommended for better visibility. It is also possible t
FREE

Golden section price action indicator - is a trend-scalping complete system with enter and exit points. Indicator is based on most powerfull price action japan patterns that are filtered by volume, volatility, market phase. Pattern is not a simple combinations of candles. Patterns must have "weight" to move market in right direction. "Weight" - is the summary of pattern's volume, the size of pattern candles according to last average volatility and ofcourse pattern must appear in correct market p
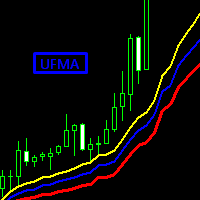
NEW FEATURE ! Now you can select the option of two MA to see the amazing MA cross of Two UFMA.
With the fast reaction of this MA you can avoid most of the false signals of a normal MA Cross.
New formula to calculate moving average, it quickly adapts to the price but maintains the analysis to determine if a change in trend is necessary.
Input Parameters:
Period: used to select the number of bars to use for calculations. Mode: Mode to use for the calculation of the moving average > SMA, EM

Identification of support and resistance areas
A useful indicator for traders
completely free
Can be used in all symbols
Can be used in all time frames
It has three different trends: short term, medium term, long term
Settings:
Clr1,2: You can change the color of the lines
Type Trend: You can determine the trend
Message me for questions, criticism and suggestions
FREE
CFF Day Trader Machine
CFF Day Trader Machine is the best trading system you will ever find when you want to go right every time with the market so that you will never have to trade against the market again, It’s providing marvelous trading signals based on such and amazing algorithm.
*** 5 Copies left for next price $613 ***

Hypothetical trend line display
Distance from the trend line
Can be used in all symbols
Can be used in all time frames
An interesting indicator for predicting small waves
The greater the distance from the trend line, the more likely it is to return to the trend line
Settings:
The first three(osic 1,2,3):
are the same as the settings of the zigzag indicator
The bigger these numbers are, the bigger the trend lines and the longer the trend
Back Show:
The number of candles displayed
FREE

Indicator help you recognize trend quickly ( recommended to use TF M30-Daily ) Parameters: Alert when have signal Push Notification to MT4 mobil2 Benefits Easy to use. input parameters is simple The ability to use as filter for any strategy. It work on stock, index, oil, gold, and on all time frames. It has the function of push-notifications, and sound alerts. Importance : Non Repainting Indicator

Diagnosis of major and minor pivot
Trend detection
with many signals
Can be used in all symbols
Can be used in all time frames
Settings:
Back Show: The number of candles it displays
If you need any adjustments, or have any questions or suggestions, message me
How to trade:
Blue: sell signal
Red: buy signal
Blue and red at the same time: no signal
Exit signal: Opposite signal

Forecasting the future by combining trend and average price
with many signals
Can be used in all symbols
Can be used in all time frames
Settings:
BackShow: The number of candles displayed
Osi: Main setting, the larger the number, the longer the trend
If you need more settings, or have any questions or suggestions, message me
How to trade:
Blue: sell signal
Red: buy signal
Blue and red at the same time: no signal
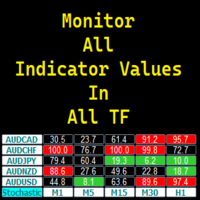
ALL in ONE Indicator Display Indicator values in all Timeframes Display Multiple Symbols/Pairs Fully customizable Click any value/box to open the chart of the corresponding symbol and timeframe Attach multiple instance of the program to display other indicator values Flexible Dashboard Positioning in chart You may request more indicators or additional feature for future updates!

NOTE: NEXT PRICE WILL BE 550$ Dear Trader I hope you have been eagerly waiting and looking for a tool to improve your trading. I am so glad to introduce my other product to you called Trend Shooter Index. The main goal of this tool is to help traders shoot the trend (target the trend) from the bottom or from the top of the trend for maximum profitability. How is the Indicator designed
This tool is designed to show the following Red arrows pointing down for sell signals. Blue arrows pointing up

A useful dashboard that shows the CCI values for multiple symbols and Time-frames.
It can be easily hidden/displayed with a simple click on the X top left of the dashboard.
You can input upper and lower CCI values and the colours can be set to show when above/below these values. The default values are 100 and 30-100 There are also input colours for when the CCI is positive or negative (but not exceeding the upper/lower levels
Symbols and time-frames are input separated by commas.
Sym
Divergence is one best ways to trade the financial market as it is a leading indicator of price action that detect high probability reversal and continuation setups. The AlgoKing Divergence Detector is an RSI and Stochastics Indicator with Divergence Detection. Features Hidden Divergence for trend continuation. Standard or Normal Divergence for trend reversal. Screen Alerts. MetaQuotes Notifications. Email Notifications. RSI Indicator built in. Stochastics Indicator built in. Types of Divergen
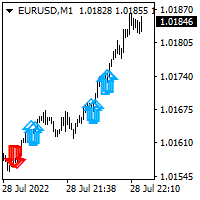
This indicator helps you to build position and profit when market turns in your favor. You will build your full position by trading many small position. Once blue arrow appear on the chart, you could add long position. Once red arrow appear on the chart, you could add short position. I personally spread my full size position in to 5-10 small position. I use small target of 2-5 pips on eurusd pair.

Forex trading support timer: - This is an indicator that supports a trader's trading process. - Before placing a BUY or SELL order, it is advisable to observe what the current time is like, to get the best position when trading. Function of indicator: - Display information about candle closing time of different timeframes (M1,M5,M15,H1), best used when Scalping. - Show market spreads. - Show TimeZone Trading. - Displays the remaining time of a session.
FREE

Geschwindigkeitswiderstandslinien sind ein leistungsfähiges Werkzeug zur Bestimmung von Trend- und Widerstandslinien. Der Indikator baut Linien mit extremen Grafiken und speziellen mathematischen Formeln. Der Indikator kann verwendet werden, um die Trendrichtung und die Umkehrpunkte zu bestimmen.
<---------------------------->
Parameter des Indikators:
"Depth of search" - die Tiefe (in Bars) der Suche nach den Extremen des Graphen "Back step of search" - der Mindestabstand (in Bars) zwisc
FREE

"Scalping-Handelsstrategie" - Der Indikator wurde für den Handel mit dem Scalping-System erstellt. "Scalping-Handelsstrategie" zeigt auf dem Chart mit einem Pfeil an, wohin der Preis jetzt gehen wird. Nachdem der Indikator einen Pfeil gezeichnet hat, bewegt sich der Preis um mindestens 20 Punkte in Pfeilrichtung. Dies ist genug für uns, um effektiv zu handeln. "Scalping-Handelsstrategie" zeichnet seine Signale nicht neu. Der Indikator hat viele verschiedene Betriebsmodi. Es kann einen Pfeil sow
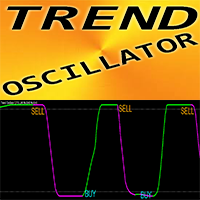
Trend Oscillator - is advanced custom indicator, efficient trading tool! Advanced new calculation method is used - 20 options for parameter "Price for calculation" Smoothest oscillator ever developed Green color for upward trends, Red color for downward trends Oversold values: below 5 ; O verbought values: over 95 There are plenty of opportunities to upgrade even standard strategies with this indicator // More great Expert Advisors and Indicators are available here: https://www.mql5.com/en/

The indicator refers to the means of probabilistic analysis. Prediction is performed by the Monte Carlo method together with a mathematical model of a neuron. But, the modeling of samples for this method is made not artificially, but comes from the original "nature", that is, from history. The number of samples and the detail of their modeling is achieved using the lower (relative current) timeframe.
Indicator algorithm :
In general terms, the algorithm boils down to the fact that the ind

Preis-Pivot-Punkte H1 – ein Indikator, der die Preis-Pivot-Punkte im H1-Zeitrahmen mit einer Genauigkeit von bis zu 95 % anzeigt. 95 Signale von 100 zeigen genau den Ort der Preisumkehr in die entgegengesetzte Richtung an. Der Indikator zeichnet seine Werte nicht neu. Geeignet für den Handel mit jedem Währungspaar. Es kann sowohl für das Intraday-Scalping als auch für den langfristigen Handel verwendet werden. Preis-Pivot-Punkte H1 zeigt Signale als Pfeile. Wenn sich der Preis umkehrt, zeichnet

It could help to calculate Risk-Reward easily before placing a BUY-SELL position. TradeSizeCalculator is a Multi-Tasking Calculator. It will calculate the others when we define the value in one of the columns. Stoploss, risk percentage, risk-money, lot size, take-profit , reward-money, and reward-ratio. Depending on which value is changed. All values in the columns are editable. Also, we can get those calculation results by drag-drop the stop-loss/take-profit line. Parameter: The inputs below ar

Fractal Structures Breakout Trader !!SPECIAL PRICE FOR THE FIRST 10 COPIES!!
A next generation powerfull indicator which brings a new approach to fractal theory Indicator tries to scan and find the fractal breakouts. Momentum, price action and harmonic calculations are also used to complete the algo. Advantages: No Repaint Works on all chart timeframes. Works for every instrument including Currency Pairs, Gold, Oil, Commodities, Indices, Stocks and Cryptocurrencies. Easy to use. User and CPU f
For Nasdaq trading, the most important principle is to know the trend of the fund.
This indicator with 6 green and red lights provides you with the daily path of this important indicator.
This indicator has been tested for 6 months and has a win rate of over 85%.
Be sure to contact me before purchasing to get the necessary instructions on how to use and set up this indicator.
You should use a broker that has dollar index, vix, and commodities. MT5 Version
You can contact us via Instagram,

This indicator provides common shapes as drawing object options. The shapes are rotatable, resizable, draggable, and will keep their proportions (according to their handle trendline) across different chart scales. Multiple drawings are supported.
Shapes: Square Rhombus
Triangle (quadrilateral & isosceles) Circle (grid, overlapped grid, flexi grid, rotatable grid, concentric circles) Features: rays (all object edges will be rays) show/hide each individual drawing type, or all delete last drawn
FREE

Th3Eng HistoMaster indicator Free Histogram Indicator to detect the current trend direction. The indicator is based on CCI indicator. Also draw arrows when it detect the trend is strong buy or strong sell, with Alerting system (Popup with sound, Email alerting and mobile notification). Also draws a dashboard shows all Time-Frames' current signal.
Requirements
works with all pairs, stocks, CFDs and crypto currencies. works with all Spreads works with all Account types works on all Time-Frames
FREE

极大的提升了交易感官,一目了然的走势展示,简洁高效。 极大的突出展示了行情的趋势脉络,跟随时间周期适应变化,替用户交易者研判了行情走势,简洁高效 同时我们还提供了主窗口和副窗口的展现,有需要可以联系我作者本人,感谢支持。 像传统的renko,又不是传统的renko,技术在发展,同样的砖图可以有不一样的绘制和计算展现。 希望可以帮到大家的交易,再次感谢。
极大的提升了交易感官,一目了然的走势展示,简洁高效。 极大的突出展示了行情的趋势脉络,跟随时间周期适应变化,替用户交易者研判了行情走势,简洁高效 同时我们还提供了主窗口和副窗口的展现,有需要可以联系我作者本人,感谢支持。 像传统的renko,又不是传统的renko,技术在发展,同样的砖图可以有不一样的绘制和计算展现。 希望可以帮到大家的交易,再次感谢。

This Indicator is a very Simple Method to make profit from the market! it has two arrow directions up and down. you can easily buy when you see up arrow and close it when you see down arrow. you can use it for Binary Options too! you also can use it with other indicators like Heiken Ashi and Ichimoku to make a complete System of Trading. it has just two Input Options: nBars: The Number of Candles you want to see the Signals for. ShowPanel: to display or not to display the Panel DoAlert: to Send

Indicator Support and Resistence plain in your chart seven lines; Red line=Resistence 3. Red line=Resistence 2. Red line=Resistence 1. Yellow line= Pivot. Green line= Support 1. Green line= Support 2. Green line= Support 3. adattable in all timeframe (minute 1, minute 5, minute 15, minute 30, Hour 1, Hour 4,Day 1,Week 1,Mounth 1); Buy under support and sell over the resistence;

This is another Arrow Indicator to show the instant direction of the Market. it's no repainting and no lagging. you can easily trade by it's direction or use it on your own System. the later is recommended! you can use it on Automatic Experts too. it's input parameters are consists of: nBars: Number of Bars to be checked EnableAlerts: to send Alert messages when get new Signal. EmailAlerts: to send you Email for new Signals you can simply use it on any Symbol or Time Frame after checking for it'

Magic Lines MT4 is an indicator which can be categorized as trend, levels and channels type. It draws a colored line which is colored in green and red depending where last close is. The value at the current open bar should not be taken into account. This part of the indicator can give us a sense whether it is trending up or down or its going sideways. Magic Lines indicator also draws blue top and bottom levels which can be taken into account for breakouts and false breakouts. A sideway zone shou

CFF New Plan
CFF New Plan is the best trading indicator especially for scalping traders , It’s providing marvelous trading signals based on such and amazing algorithm.
--6 copies has been sold with price $60--
*** 6 Copies left for next price $613***
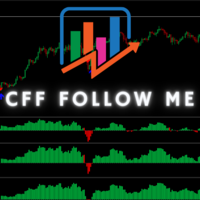
CFF Follow Me
*** 10 Copies left for next price $613***
* Entry signals without repainting or delays * Error-free opening of trades * Provides signals for any direction sell & Buy * Provides multiple timeframes on a single chart * Colored Histogram based on the market direction * Arrows entry signals
How does the CFF Follow Me Works?
Our CFF Follow Me trading system based on a very accurate "Trend-Following" Trading Strategy. Here's how to Start using ou
AI Signal is an indicator that is a ready to made scalping system that doesn't repaint
Instructions: Load indicator. Use arrows as entries in trends and stay out of sideways markets. Trade with the larger trend and trade only active volatile hours Buy blue arrow above yellow and exit at red arrow or at discretion. Sell red arrow below yellow and exit at blue arrow or at discretion.
Easy to follow and is based on trends. The indicator works on all time frames and assets. Use at your own

This is a regression tree indicator for MT4/MT5.
This indicator classificate nodes on the time period so that the deviation becomes smaller,
and displays regression line and channel for each node.
It's free!
Attached CartDemo.ex4 and CartDemo.ex5 is a Demo version and has the following limitations:
Method is RandomForest only
Maximum number of bars is 200
Maximum number of trees is 2
Maximum tree depth is 2
Calculated waste lines are shown
Not display correlation coefficients
Fu
FREE
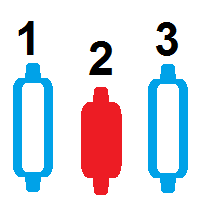
Candlestick-Zähler dieser Indikator zählt Kerzen, die sich auf dem Chart eines beliebigen Zeitrahmens befinden eine kostenlose Bartheke, die Sie auf mt4 herunterladen können der Candlestick-Zähler zählt, wie viele Kerzen sich in einem größeren Chart befinden mit diesem Kerzenzähler können Sie die automatische Kerzenzählung durchführen kostenloser Candlestick-Zählindikator zum automatischen Herunterladen und Zählen von Balken bar counter to count the bars count candle counter indicator mt4 count
FREE

UR TrendErschöpfung
UR TrendExhaustion ist die beste Lösung für Trader, die sich nicht mit Parameterwerten oder anderen Einstellungen auseinandersetzen wollen – es ist sowohl einfach als auch visuell für jeden verständlich.
Vorteile der Verwendung von UR TrendExhaustion:
Keine Parameter Sie haben 3 Linien, die am besten beschreiben, was auf dem Chart vor sich geht: Trend-Erschöpfungslinie, Whale-Money-Linie und Retail-Money-Linie. Die Benutzeroberfläche zeigt die Erschöpfung beider Lini

DYJ ChameleonTrend arbeitet auf Basis von Trend Following und Counter Trend System. DYJ ChameleonTrend ist ein Indikator mit hoher Wahrscheinlichkeit. Dieser Indikator verwendet einen einzigartigen Mix-Indikator, der anspruchsvolle Indikator mit Benutzerdiskretion kombiniert. Dieser Indikator ist einer der fortschrittlichsten Ma-Kreuz- und Varianzalgorithmen. Der Indikator zeigt farbige Richtungspfeile und Trend-Scrollbälle an, die die besten Entry- und Exit-Positionen für Trader anzeigen. Eing

UR DivergenceSpotter
UR DivergenceSpotter ist das Ergebnis langjähriger Erfahrung und manchmal sind die einfachsten Wege die besten. Es gibt eine gute Korrelation zwischen einigen Indikatoren, aber wenn sie nicht übereinstimmen – versucht der Preis, sich „neu anzupassen“ – und in diesem Moment erhalten wir ein Signal mit UR DivergenceSpotter.
Vorteile der Verwendung von UR Divergence Spotter:
Keine Parameter Wird nicht neu gezeichnet, nachdem die Kerze erstellt wurde Signale, wenn das S

UR VolumenTrend
UR VolumeTrend ist der deutlichste Volumenindikator, der den anhaltenden Trend in Bezug auf das Volumen anzeigt. Funktioniert perfekt mit anderen Indikatoren wie UR TrendExhaustion, um lokale Hochs und Tiefs zu signalisieren.
Begrenzt auf nur 2 Parameter – je höher die Werte, desto länger werden die Trends angezeigt. Gradientenextreme zeigen mögliche Volumenerschöpfungen an, um eine potenzielle Trendwende abzufangen. Zwei Linien – Der Volumentrend und der Durchschnitt. Der
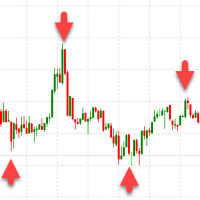
Scalping Trader - Der Indikator ist für den Intraday-Handel (Scalping) konzipiert. Zeichnet Pfeile nicht neu. Zeigt mögliche Preisumkehrungen auf dem Chart mit Pfeilen an. Die Genauigkeit der Signale beträgt ca. 96 %. Das heißt, in 96 % der Fälle wird der Preis für das GBPUSD-Paar um mindestens 40 Punkte in die entgegengesetzte Richtung gehen, nachdem der Pfeil auf dem Bildschirm erscheint. Die Handelsstrategie ist sehr einfach. Wir warten darauf, dass der Pfeil auf dem Diagramm erscheint. Nach

indicators to facilitate analysis based on Oma Ally's BBMA strategy by displaying CSAK (CSD), CSM and Extreme labels on the chart 1. Displays the Bollinger Band line 2. LWMA 5-10 High and Low 3. EMA 50 4. Fibonacci 5. MHV . area 6. Alert & Show labels BBMA consists of the use of 2 indicators: Moving Averages Bollinger Bands BBMA consists of 3 types of entries: Extreme MHV Re-Entry Moving Average Settings: There are 5 MAs used in the system: 2 High Moving Averages, 2 Low Moving Averages and
FREE
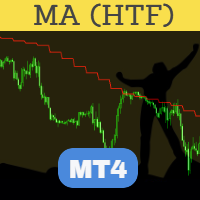
Perfected MA (Moving Average) HTF (Higher Time Frame) is perhaps the most advanced and reliable HTF indicator. Highly optimized in terms of execution, the indicator comes with standard settings of the MA indicator which is supplied with the MT4 platform. Place the indicator on the chart, any timeframe. You may select a higher time frame in indicator inputs. The same indicator can be used on a chart multiple times to draw MA from multiple timeframes or for different MA values. A must-have tool t
FREE

This is a Multi pair and Multi time frame dashboard. The founder of the system is Mr. Oma Ally, which is a system based from Bollinger Band and Moving Average(BBMA). BBMA consists of the use of 2 indicators: Moving Averages Bollinger Bands BBMA consists of 3 types of entries: Extreme MHV Re-Entry Rejection EMA50 This Dashboard Help you to scan current Extreme, Reentry setup, Rejection EMA50 and also MHV How to read signals:
find the same color in 3 different timeframes in succession
For exam
FREE

Provides Regression Channel on the current chart. Combined by Trend of Moving Averages and Multi timeframes Oscillator Indicators: CCI, RSI, Stochastic, and MACD with specific working logic . It could make us easier to identify swing high-low as an entry point, the retracement area while following the current trend. Consists of 2 types of signal, main and secondary. The main signal will draw very clearly triangle and lines on the chart with the word " BUY" or 'SELL'. and the secondary is the sta

Professional Support&Resistance Indicator. This indicator is primarily intended for professional use by brokers. There are countless options to choose from and it is one of the best tools in the stock market today. The indicator is optimized for use with EAs.
For programmers to retrieve output index value is for MQL4; (EXAMPLE)
bool buySNR=false,sellSNR=false;
char count=100;
char limit=1;
char dist=3;
for(short cnt=0;cnt<=count;cnt++)
{
double snr_middle=iCustom(NULL,TF_,"::Indica
Ist Ihnen bekannt, warum der MetaTrader Market die beste Plattform für den Verkauf von Handelsstrategien und technischer Indikatoren ist? Der Entwickler braucht sich nicht mit Werbung, Programmschutz und Abrechnung mit Kunden zu beschäftigen. Alles ist bereits erledigt.
Sie verpassen Handelsmöglichkeiten:
- Freie Handelsapplikationen
- Über 8.000 Signale zum Kopieren
- Wirtschaftsnachrichten für die Lage an den Finanzmärkte
Registrierung
Einloggen
Wenn Sie kein Benutzerkonto haben, registrieren Sie sich
Erlauben Sie die Verwendung von Cookies, um sich auf der Website MQL5.com anzumelden.
Bitte aktivieren Sie die notwendige Einstellung in Ihrem Browser, da Sie sich sonst nicht einloggen können.