YouTubeにあるマーケットチュートリアルビデオをご覧ください
ロボットや指標を購入する
仮想ホスティングで
EAを実行
EAを実行
ロボットや指標を購入前にテストする
マーケットで収入を得る
販売のためにプロダクトをプレゼンテーションする方法
MetaTrader 4のための新しいテクニカル指標 - 34

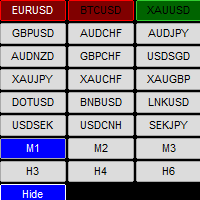
Candlestick Pattern Scanner Dashboard MT4 は、複数の通貨ペアと時間足にわたるキャンドルパターンを監視するための強力なツールです。検出されたパターンはグリッド形式で整理され、パターンの短縮形と何本前のキャンドルで表示されたかを示します(例:BUEN(3)は、3本前にBullish Engulfingパターンが検出されたことを示します)。 MT5バージョンはこちらで確認できます: CandleStick Patterns Multicurrency Scanner MT5 詳細なドキュメントはこちらをご覧ください Documentation Link 主な特徴 キャンドルパターン検出:Doji (DOJ)、Hammer (HAM)、Bullish Engulfing (BUEN)、Bearish Engulfing (BEEN)、Three White Soldiers (TWS)など、15種類の人気パターンを識別します。 複数時間足スキャン:M1からMN1までの時間足でパターンを監視し、特定のスキャンを有効または無効にする柔軟性があります。 コ

トレンドオシレーターは、高度なカスタム Crypto_Forex インジケーター、効率的な取引ツールです!
- 高度な新しい計算方法を使用 - パラメーター「計算価格」のオプションは 20 種類。 - これまで開発された中で最もスムーズなオシレーター。 - 上昇トレンドの場合は緑色、下降トレンドの場合は赤色。 - 売られすぎの値: 5 未満、買われすぎの値: 95 以上。 - このインジケーターを使用すると、標準戦略をアップグレードする機会が十分にあります。 - PC およびモバイルアラート付き。
高品質のトレーディングロボットとインジケーターをご覧になるにはここをクリックしてください! これは、この MQL5 Web サイトでのみ提供されるオリジナル製品です。

NASDAQ 100市場での高度な取引機会をNASDAQスマートインジケーターで発見 NASDAQスマートインジケーターは、NASDAQ 100市場での取引において非常に強力で効果的なツールの一つです。このインジケーターは特に1分と5分のタイムフレームに合わせて設計されており、高精度で高度なパフォーマンスを発揮します。簡単に設定してそのメリットを活用できます。 主な特徴 : 1分と5分のタイムフレームでの最適なパフォーマンス :このインジケーターは特にこれら2つのタイムフレーム向けに設計され、最高の結果を提供します。ほかのタイムフレームでも機能しますが、特に重要なこれらのタイムフレームに注力しています。 NASDAQ 100戦略との互換性 :このインジケーターは私たちのNASDAQ 100戦略の重要な要素で、適切な取引機会の理解を助けます。 このインジケーターは1年間にわたり利用・バックテストされてから提供されており、満足のいくパフォーマンスを示しています。しかし、利用前に必ずユーザー自身でバックテストし、機能性を確認してください。 オシレーター構造 :NASDAQスマートインジケータ

The Bullish and Bearish Engulfing Pattern Screener for MetaTrader 4 is a powerful tool designed for traders looking to identify key reversal patterns in the financial markets. This indicator scans price charts for bullish and bearish engulfing patterns, which signal potential trend reversals. Key Features: Real-time Scanning : Continuously analyzes price data to provide instant alerts when engulfing patterns are detected. Customizable Settings : Allows users to adjust parameters to fit their tra
FREE
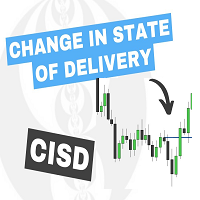
The Change In State Of Delivery (CISD) indicator detects and displays Change in State Of Delivery, a concept related to market structures.
Users can choose between two different CISD detection methods. Various filtering options are also included to filter out less significant CISDs.
USAGE Figure 2 A Change in State of Delivery (CISD) is a concept closely related to market structures, where price breaks a level of interest, confirming trends and their continuations from the resulting

ADX Shark Scalper – The Ultimate Hybrid Indicator for Precision Scalping Dive into the markets with the ADX Shark Scalper , a powerful and versatile tool designed for traders who seek precision in every trade. This cutting-edge indicator seamlessly combines multiple advanced technical signals into one streamlined system, allowing you to spot good buy and sell opportunities with ease. At its core, the ADX Shark Scalper leverages the power of trend and momentum detection through the integration of

Vondereich MTF Strength System – The Ultimate BBMA Dashboard for MT4 Overview Stop wasting time scanning dozens of charts manually!
The Vondereich MTF Strength System is a professional dashboard designed for traders who follow the BBMA (Bollinger Bands & Moving Averages) methodology. It automatically scans multiple pairs and timeframes, highlighting high-probability setups such as Re-entry, CSM, MHV, and Extreme . With a clean and responsive interface, you’ll instantly see market momentum

This dashboard shows you the 3MA Cross Overs current status for Multi-currency multi-timeframes. Works for Metatrader 4 (MT4) platform. Detailed Post:
https://www.mql5.com/en/blogs/post/759238
How it Works:
MA Cross Signals It will show “S” Green/Red Strong Signals and “M” or “W” Green/Red Medium or Weak signals. We have 3 types of MA: Faster, Medium and Slower MA. A strong signal is when FasterMA and MediumMA are both above/below SlowerMA. A medium signal is when only FasterMA is above/below
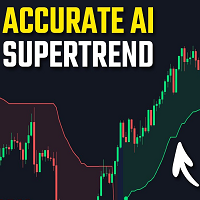
Machine Learning Adaptive SuperTrend - Take Your Trading to the Next Level!
Introducing the Machine Learning Adaptive SuperTrend , an advanced trading indicator designed to adapt to market volatility dynamically using machine learning techniques. This indicator employs k-means clustering to categorize market volatility into high, medium, and low levels, enhancing the traditional SuperTrend strategy. Perfect for traders who want an edge in identifying trend shifts and market conditio

Scopri l'Indicatore Avanzato di Zone di Offerta e Domanda Sei pronto a portare il tuo trading al livello successivo? L'indicatore "Advanced Supply and Demand Zone" è lo strumento definitivo per identificare con precisione le zone chiave di supporto e resistenza sul mercato, permettendoti di prendere decisioni informate e tempestive. Come Funziona Questo indicatore innovativo analizza il mercato utilizzando frattali veloci e lenti per individuare i punti di inversione del prezzo. Si basa sui prin

Unlock the Power of Multi-Market Insights with Our Cutting-Edge Dashboard Indicator
Are you tired of juggling multiple charts and indicators just to stay on top of the markets? Introducing the "RSI & EMA Cross Dashboard" - a revolutionary trading tool that consolidates critical signals across your favorite currency pairs and timeframes into a single, easy-to-read display.
Meticulously coded by our team of seasoned developers, this indicator harnesses the power of RSI and EMA crossover analysi

Advancing in NASDAQ 100 Trading with the Smart "Candle Color" Indicator The indicator we offer is one of the good tools for trading in the NASDAQ 100 market, especially in the 1-minute and 5-minute timeframes. This indicator is designed with precision and scientific rigor and can also be used in other timeframes. All you need to do is activate it and leverage its power. Unique Features: Optimized Performance in 1-Minute and 5-Minute Timeframes: This indicator is specifically designed for these

Magic Moving AI The Magic Moving AI indicator is one of the best tools for trading in the NASDAQ 100 market. This tool is specifically designed for the 1-minute and 5-minute timeframes and operates with high precision. You can easily activate this indicator and benefit from its advantages. Unique Features: Specialized Performance in 1-Minute and 5-Minute Timeframes: While this indicator is capable of working in other timeframes, its primary focus is on these two timeframes to deliver optimal re

The indicator now available to you is one of the best tools for trading in the NASDAQ 100 market, particularly in the 1-minute and 5-minute timeframes. This tool is designed with precision and can also be used for other timeframes. All you need to do is activate it. Key Features: Specialized Performance in 1-Minute and 5-Minute Timeframes: While this indicator can work in other timeframes, it delivers optimal results in these two timeframes. Compatibility with the NASDAQ 100 Secret Strategy: Th
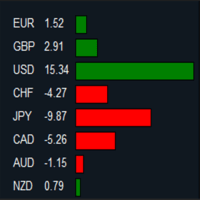
MT5 Version: https://www.mql5.com/en/market/product/124136 Imagine you’re at the helm of your trading terminal, scanning charts of various currency pairs, trying to figure out which ones are strong, which ones are weak, and where the real opportunities lie. It’s a lot to process—flipping between charts, calculating movements, and comparing performance. But what if all of that could be done for you, neatly displayed in one place? That’s where this Forex Strength Dashboard comes in. Picture thi
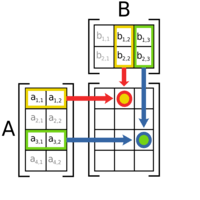
MT5 Version: https://www.mql5.com/en/market/product/124107 A Day in the Life of a Trader: Discovering the Forex Matrix Dashboard In the fast-paced world of forex trading, keeping track of multiple currency pairs can feel overwhelming. That’s where the Forex Matrix Dashboard comes in, making the life of a trader much easier. Imagine opening the dashboard and instantly seeing all your favorite currency pairs, like EUR/USD, GBP/USD, and USD/JPY, displayed clearly with their latest prices. No mo
Please share a comment or rate for improvement Main Function : The start function is called on each new tick. It performs the main logic of the indicator: It initializes arrays to store daily high and low prices. It resizes and initializes these arrays based on the number of days specified by the DAYS input parameter. It copies the daily high and low prices into these arrays. It finds the highest high and the lowest low over the specified number of days. It displays these values as com
FREE
このインジケータは、取引ターミナルのチャートのスクリーンショットを便利かつ迅速に作成するために設計されています。チャートを特定のディレクトリに保存するプロセスを大幅に簡素化し、シングルクリックで起動するチャート上のボタンによる便利なインターフェイスを提供します。
このインジケータの主な機能は以下の通りです:
ボタンを押すと自動的にチャートのスクリーンショットを作成。 スクリーンショットを保存するディレクトリを選択可能。 複数のインジケータが1つのチャート上で動作する場合、スクリーンショットを区別するための接頭辞をカスタマイズ可能。 ファイル形式はPNGまたはGIFから選択可能。 ボタンが重なることなく、1つのチャート上で複数のインジケーターのインスタンスをサポート。 インジケーターのパラメーター:
directory - スクリーンショットを保存するフォルダ。 prefix - ファイルを区別するためのスクリーンショット名のプレフィックス。 extension - ファイル形式(PNGまたはGIF)。 スクリーンショットは 「MQLFiles 」フォルダーにあります。
FREE

このインジケータは、ボタンをワンクリックするだけで、現在のチャート設定をテ ンプレートに保存でき、チャートテンプレートの作成プロセスを簡素化します。このインジケータは、指定した名前と接頭辞を持つテンプレートを自動的に保存するボタンをチャートに直接追加し、テンプレートの整理と使用を容易にします。
このインジケータの主な機能は以下の通りです:
ボタンを1回クリックするだけで、現在のチャートのテンプレートを作成。 テンプレート名に接頭辞を指定できるため、テンプレートの区別が容易。 ボタンを重複させることなく、異なる接頭辞を持つ複数のインジケータ・インスタンスをサポート。 インジケーターのパラメーター
prefix - 作成されたテンプレートを他と区別するためのプレフィックス。
FREE
Brilliant Reversal Multicurrency Scanner MT4 は、Brilliant Reversalインジケーターを使用して、複数の通貨ペアと時間枠を監視するために設計された強力なツールです。このスキャナーは、市場の潜在的な反転を特定するプロセスを簡素化し、集中型ダッシュボードからリアルタイムのスキャンとアラートを提供します。主要ペア、マイナーペア、またはエキゾチックペアを取引する場合でも、このツールは包括的な市場カバレッジと取引戦略に合わせたカスタマイズ可能な設定を提供します。市場の動きを先取りし、この必須ツールでエントリーを洗練してください。 このツールは、シグナルをグリッド形式で整理し、買いシグナルと売りシグナルをそれぞれの強度とともに表示します: S :強い M :中 W :弱い MT5バージョンはこちらで入手できます: Brilliant Reversals MultiCurrency Scanner MT5 詳細なドキュメントはこちらをクリックしてください: here 主な機能: 統合 Brilliant Reversal:Small Bar
Nadaraya Watson Envelopeマルチカレンシースキャナー MT4 は、複数の通貨ペアと時間枠にわたる重要な反転シグナルを監視するための簡素化された方法を提供します。TradingViewでその正確な反転シグナルで知られている人気のインジケーターを基に構築されたこのスキャナーは、同じコアロジックをMT4互換の形式に適応させています。低時間枠での短期的な機会と高時間枠での強いトレンドシグナルに焦点を当て、トレーダーが市場の転換点に注意を払うのに役立ちます。 MT5バージョンはこちらで入手できます: Nadaraya Watson Envelope Multicurrency Scanner MT5 詳細なドキュメントはこちらをクリックしてください: ドキュメント 主な機能: インジケーターの統合:Nadaraya Watson Envelopeインジケーターを使用し、価格行動の周囲に滑らかなエンベロープを計算します。トレーダーはLengthパラメーターを調整して考慮するバーの数を定義し、Bandwidthを調整して平滑化を制御し、Multiplierを設定してエンベロープ
FVG ゾーン インジケーターは、 市場における公正価値ギャップ (FVG) を特定し、公正価値と市場価格の間の価格不均衡を浮き彫りにするために設計された強力なツールです。このギャップの正確な特定により、トレーダーは潜在的な市場参入および市場退出ポイントを見極めることができ、情報に基づいた取引決定を行う能力が大幅に向上します。 FVG ゾーン インジケーターは、直感的でユーザー フレンドリーなインターフェイスを備えており、チャート上の公正価値ギャップを自動的にスキャンして、価格チャートにこれらのゾーンをリアルタイムでマークします。これにより、トレーダーは、今後の価格修正やトレンドの継続を示唆する可能性のある潜在的な価格の不均衡を迅速かつ簡単に認識できます。 主な機能は次のとおりです。 リアルタイムギャップ検出: FVG が現れると自動的に識別してマークします。 ギャップのサイズをピップ単位で表示: このインジケーターは、識別された各ギャップのサイズをピップ単位で表示し、トレーダーがギャップの重要性を理解するのに役立ちます。 現在の価格からのピップ距離: 特定された公正価値ギャップか

小さな価格変動をフィルタリングし、大きなトレンドに焦点を当てる . Renkoチャート指標は、小さな価格変動をフィルタリングして、全体のトレンドに焦点を当てるのに役立ちます。 価格が指定された距離だけ動くことで、Renkoブロックが作成されます。 これにより、価格が動いている現在のトレンド方向を簡単に特定できます。 多機能ユーティリティ : 66以上の機能を含む | ご質問があればご連絡ください | MT5バージョン インジケーターの設定で、以下を構成できます: 計算設定: ブロックサイズ(ポイント単位); インジケーターのスタイル:
ブロックの色; プログラムファイルは " Indicators " ディレクトリに配置してください。

Keltner Channel Multicurrency Scanner MT4 Keltner Channel Multicurrency Scanner MT4 は、複数の通貨ペアと時間枠でKeltnerチャネルの突破を検出し、リアルタイムで分析を提供することにより、あなたの取引戦略を強化するための高度なツールです。この強力なスキャナーは、トレーダーが重要な価格の動きや突破の機会を迅速に特定するのに役立ち、意思決定を加速し、市場分析を向上させます。 主な特徴 効率的なマルチカレンシースキャン: 複数の通貨ペアをリアルタイムで監視し、Keltnerチャネルの突破を即座に検出します。手動でチャートを切り替える必要はありません。 ダッシュボードによる包括的な概要: 明確で使いやすいダッシュボードで、強気および弱気の突破信号を確認します。市場の状況を追跡し、情報に基づいた取引判断を行います。 履歴信号の追跡: 過去のKeltnerチャネルの突破信号をレビューし、そのパフォーマンスを分析して戦略を最適化し、トレンドを把握します。 複数の時間枠のスキャン: 異なる時間枠でKeltnerチャネ

MT4用Heiken Ashiマルチカレンシースキャナー は、トレーダーがHeiken Ashiインジケーターを使用して市場のトレンドを効率的に監視できるように設計された高度なツールです。このスキャナーを使用すると、複数の通貨ペアを同時にスキャンでき、トレンドや反転のチャンスを素早く特定できます。 主な機能 簡単なマルチカレンシースキャン: 複数の通貨ペアをリアルタイムで監視し、重要なHeiken Ashiシグナルが検出された際に即座にアラートを受信します。 包括的なダッシュボード表示: さまざまな通貨ペアにおけるHeiken Ashiの強気および弱気トレンドをわかりやすいダッシュボードで確認できます。 幅広い通貨ペア対応: 主要通貨からエキゾチック通貨まで、さまざまな市場を分析可能です。 過去シグナルの追跡: 過去のHeiken Ashiトレンドシグナルをレビューし、取引戦略の改善に役立てることができます。 複数時間軸のスキャン: 短期から長期まで、さまざまな時間軸での取引チャンスを把握します。 シームレスなチャートナビゲーション: ダッシュボードからワンクリックで通貨ペアを切り替え

Binary Scalper 6 – MT4用の強力なバイナリーオプション指標
Binary Scalper 6 は、 MetaTrader 4 (MT4) 向けに設計された、先進的なトレンド分析とバイナリーオプショントレーディングツールです。すべてのレベルのトレーダーに適しており、明確なシグナルと統計を提供します。 主な特徴: トレンド検出 :トレンド市場を正確に特定し、明確な方向性を提示。 すべての通貨ペアに対応 :お好みの市場で取引可能。 あらゆるタイムフレームに対応 :1分足から月足まで。 1キャンドルの満期シグナル :迅速かつ簡潔なトレーディング機会。 統計情報を表示 :市場のパフォーマンスに関する貴重なデータを提供。 バッファ矢印 :取引エントリーを視覚的にサポート。 使用方法:
MQL5 フォルダをダウンロードし、MetaTrader 4 ディレクトリに移動します。 こちら からダウンロードできます。
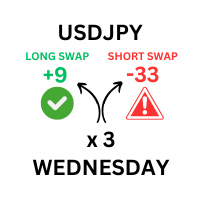
このツールは、取引プラットフォームで利用可能なすべての通貨ペアの詳細なスワップレートを表示するように設計されています。 これにより、トレーダーは視覚的に強化された別個のウィンドウでロングとショートの両方のスワップ値をすばやく確認できます。 このツールは、ロット サイズのユーザー定義の入力を提供し、現在のスワップ レートと取引量に基づいて正確な計算を保証します。 さらに、標準レートと週末調整レートの両方を考慮して、スワップ手数料が適用される時期も提供されます。 注: スワップ情報は取引プラットフォームに応じて毎日変わります。 ------------------------------------------------------------------------------------------------------------------------------------------------------------- このツールは、取引プラットフォームで利用可能なすべての通貨ペアの詳細なスワップレートを表示するように設計されています。 これにより、トレーダーは視覚的

Attention, for the indicator to work correctly, you need to put the "MQL5" folder in your terminal folder, you can download it from the link below: https://disk.yandex.ru/d/DPyo0ntaevi_2A
One of the best arrow indicators for Binary Options, which can also be used in the Forex market. Any time frame from M1 to MN, any currency pair, can also be used on stocks - the indicator is universal. Expiration from 1 to 5 candles. Displays traffic statistics on a graph. The indicator gives signals along th
FREE

Detailed blog post with extras downloads: https://www.mql5.com/en/blogs/post/759154
About: Price ranges most of the time in forex… Like 70-80% of the time. And then it breaks out of the range to continue in a trend. Even in a trend, price makes smaller ranges all the time. Range Breaker Scalper is a tool to find the times when price breaks out of a range. A sudden break means that price will continue on for next few bars towards the breakout. So, these areas are best for scalping. Especially if

To access the TD sequential Scanner for MT5, please check https://www.mql5.com/en/market/product/123369?source=Site +Market+My+Products+Page. One of the MT5 versions includes additional timeframes such as M1, M2, M3,H2,H6,H8 and so on.( https://www.mql5.com/en/market/product/123367?source=Site +Market+My+Products+Page) TD Sequential Scanner: An Overview The TD Sequential scanner is a powerful technical analysis tool designed to identify potential price exhaustion points and trend reversals in fi

Statistical Trend Indicator is an advanced custom indicator designed to analyze market movements and provide traders with calculated probabilities of upward or downward trends. By analyzing historical price data over a specified lookback period, this indicator computes the likelihood of the market continuing in either direction, offering traders a statistical edge in decision-making.
Key Features: Probability Display: It calculates and displays the percentage probabilities of an upward or down
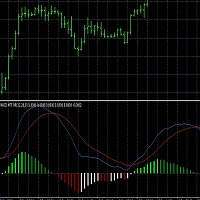
This script generates a MACD with 6 color-coded histogram bars based on the position (above or below zero) and direction (rising or falling) of the histogram. It provides multi-time frame support , allowing users to view the MACD from different time frames on a single chart. The indicator uses customizable settings for MACD periods, histogram width, and vertical scaling. This script could be useful for traders who want a visually enhanced MACD with clearer trend and momentum representation acro
FREE
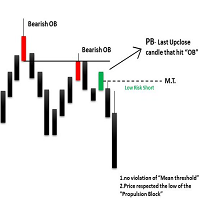
The ICT Propulsion Block indicator is meant to detect and highlight propulsion blocks, which are specific price structures introduced by the Inner Circle Trader (ICT). Note: THIS IS MTF version. Single Timeframe version avaiable at here
Propulsion Blocks are essentially blocks located where prices interact with preceding order blocks. Traders often utilize them when analyzing price movements to identify potential turning points and market behavior or areas of interest in the market.

Leonardo Breakout SMC – Advanced Trading Indicator
Overview The Leonardo Breakout SMC is a masterpiece of precision and innovation, crafted for those who seek to understand and harness the unseen forces within the market. Just as Da Vinci observed the natural world with meticulous detail, this MetaTrader 4 (MT4) indicator reveals the hidden structures of price movement, enabling traders to capture the essence of smart money concepts (SMC) and execute flawless breakout strategies. Every eleme
FREE

This scanner uses Quarters Theory. It finds the nearest quarters to current price. And when price gets close within a few points, then it highlights and sends alerts. Features: Define Major Quarters Distance for every timeframe Option to use: Half Point between majors Quarters between half point and majors Search for nearest quarter point and price Show Highlight and send Alerts Show/Hide Quarter Lines Show/Hide Price and QP Distance
Detailed post and Extras: https://www.mql5.com/en/blogs/post/

Features:
Sharkfin Alerts Multi-timeframe Multi-currency SM TDI: To show TDI lines with sharkfin levels Zigzag MTF: To see Higher Timeframe trend Detailed blog post and extras: https://www.mql5.com/en/blogs/post/759138
Arrows works on a single timeframe and single currency. But it’s visually helps see that sharkfins. You can also get the simple arrows from mql5 site product: https://www.mql5.com/en/market/product/42405
About Scanner: It is an easy to use simplified scanner. It will show when
** NOTE: This indicator uses realtime data. Thus DO NOT download Demo version. If you still need demo version, please refer to free version . Version for MT5: https://www.mql5.com/en/market/product/115489
Symbol Chart Changer is an indicator/utility that offers you the option to switch between symbols and timeframes.
You can choose any symbol and timeframe on the same chart with just a few clicks. In addition, this indicator also shows the profit of the symbol through the color o

Dynamic Forex28 Navigator - 次世代の Forex 取引ツール。 現在 49% オフ。
Dynamic Forex28 Navigator は、長年人気のインジケーターを進化させたもので、3 つの機能を 1 つにまとめています。 Advanced Currency Strength28 インジケーター (レビュー 695 件) + Advanced Currency IMPULSE with ALERT (レビュー 520 件) + CS28 コンボ シグナル (ボーナス)。
インジケーターの詳細 https://www.mql5.com/en/blogs/post/758844
次世代の Strength インジケーターが提供するもの オリジナルで気に入っていたすべての機能が、新機能と精度の向上によって強化されました。
主な機能: 独自の通貨強度計算式。 すべての時間枠でスムーズかつ正確な強度ライン。 トレンドの特定と正確なエントリーに最適です。
ダイナミックマーケットフィボナッチレベル (マーケットフィボナッチ)。 このインジケーターに固有

このインディケータは、選択した期間における強気と弱気の不均衡を測定し、2 点間の直線を示す。
強気派が弱気派より出来高が多ければ、線は緑色に変わる。 ベアの方が出来高が多い場合、線は赤になる。 線は、出来高の差のパーセンテージも示します。
このインジケーターは、同じデータを別ウィンドウで表示します。また、分割された出来高を見ることもできます。
このインジケーターには2つのモードがあります。
そのために、左上にボタンがあります、
- ボタンを押さなければ、市場の任意のポイントと現在の価格との間の不均衡を測定します。 - ボタンを押すと、市場の任意の2点間のバランスを測定できます。 このインディケータは、選択した期間における強気と弱気の不均衡を測定し、2 点間の直線を示す。
強気派が弱気派より出来高が多ければ、線は緑色に変わる。 ベアの方が出来高が多い場合、線は赤になる。 線は、出来高の差のパーセンテージも示します。
このインジケーターは、同じデータを別ウィンドウで表示します。また、分割された出来高を見ることもできます。
このインジケーターには2つのモードがあります
Order Block Tracker is here to solve one of the biggest challenges traders face: identifying order blocks. Many traders fail to spot these critical zones, often missing out on key market entries. But with Order Block Tracker , you no longer have to worry about that. This advanced indicator automatically highlights these crucial zones for you, giving you the confidence to enter the market at the right time. MT5 Version - https://www.mql5.com/en/market/product/123362/ Key Features of Order Block

Your Chart インジケーターでトレード体験を向上させましょう! この無料で高度にカスタマイズ可能なツールは、複数の時間枠を1つのクリーンなローソク足表示に統合し、元のチャートを変更することなく使用できます。Your Chart を使えば、カスタムローソク足ごとのバーの数を設定できます。例えば、M1のローソク足18本を1本にまとめ、マーケットトレンドをより広い視点で把握することが可能です。 主な特徴: カスタムローソク足の形成 : 1つのローソク足に結合するバーの数を選択し、柔軟なマーケットビューを提供します。 非侵入的なデザイン : 元のチャートデータはそのままに、カスタムローソク足はオーバーレイとして描画され、ローソク足の本体と影を表示します。 カラーのカスタマイズ : 上昇と下降方向のローソク足の色を好みに合わせて設定できます。 効率的なトレード : チャートビューをカスタマイズすることで、トレーダーは独自の洞察を得て、価格動向のビジュアルをより自分に合った形で把握できます。 MetaTrader 4 のシンプルさを保ちながら、新たな視点でチャートを確認したいトレーダーに最
FREE
ストキャスティクスマルチカレンシースキャナーダッシュボード MT4 は、ストキャスティクスオシレーターを使用して複数の通貨ペアと時間枠を監視するために設計された強力なツールです。シンボルと時間枠(M1からMN1まで)でシグナルを整理するグリッド形式を提供します。トレーダーは、戦略に合わせて特定の時間枠を有効または無効にできます。 MT5バージョンはこちらで入手できます: Stochastic Oscillator Multicurrency Scanner MT5 詳細なドキュメントはこちらをクリックしてください: ドキュメント このツールは、以下のストキャスティクス戦略に基づいてシグナルを表示します: 過買い/過売り戦略:ストキャスティクスが過買い(上位レベルを超える)または過売り(下位レベルを下回る)ゾーンに入るまたは出る際にシグナルが生成され、潜在的な反転を示します。 逆レベル戦略:ストキャスティクスがユーザー定義または自動計算された上位または下位レベルを逆方向にクロスする際にシグナルがトリガーされ、モメンタムの変化を示唆します。 クロスオーバー戦略:ストキャスティクスの%Kライ
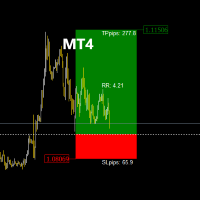
RR_TradeManager Visualizer は、トレーダーがチャート上で利益確定(TP)および損切り(SL)レベルを簡単に視覚化できるように設計されたトレード管理ツールです。この初期バージョンは、SLおよびTPゾーンとエントリープライスを表示するシンプルなグラフィカル表現を提供します。現在のバージョンは、グラフ上でSLおよびTPゾーンを図形として視覚化することにのみ焦点を当てています。 現在のバージョンの特徴: SLおよびTPゾーンの表示: カスタマイズ可能な色で、ストップロスとテイクプロフィットレベルのクリアな視覚化を提供します。 移動可能なエントリープライス: チャート上でエントリープライスを移動させることで、SLおよびTPレベルの反応を見ることができます。 リスクリワード比の計算: 定義されたレベルに基づいたリスクリワード比の動的表示。 使用方法: エントリープライスの設定: チャートをクリックしてエントリープライスを設定します。 SLおよびTPレベルの調整: SLおよびTPゾーンを移動させて、リスクとリターンのレベルを調整します。 ゾーンの視覚化: SLおよびTPゾー
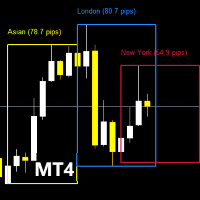
このインジケーターの機能に入る前に、この商品に評価を付け、経験を共有するためにコメントを残し、最新の更新や新しいツールについての通知を受け取るために私のページに登録してください。あなたのサポートは非常に貴重で、私の創作を常に改善するのに役立ちます! 説明: TradingSessionPipsVisualizer - トレーディングセッションをマスターするためのプロフェッショナルツール 外為市場のセッションを一目で視覚化し、最適なトレードタイミングを見極めよう! TradingSessionPipsVisualizer は、MetaTrader 4用のプレミアムインディケーターで、主要なトレーディングセッション(ロンドン、ニューヨーク、アジア、シドニー、フランクフルト)を直接グラフ上にハイライトします。要求の高いトレーダーのために開発されており、以下のことを可能にします: 高い取引活性期を瞬時に識別 (セッションの重複) リアルタイムでのボラティリティ分析 (表示されるピップ範囲) 最適な時間帯に合わせて戦略を調整 (スキャルピング、デイトレード、スウィングトレード) 自分の取引スタ
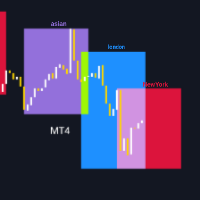
このインジケーターの機能について詳しく知る前に、ぜひこの製品を 評価 し、 コメント を残して体験を共有し、 フォロー して最新のリリースやツールの情報を受け取ってください。皆様のサポートは非常に重要で、私の作品を常に改善するための力になります! 説明: TradingSessionVisualizer はMetaTrader 4用の強力なインジケーターで、主要なトレーディングセッションをチャート上に明確かつカスタマイズ可能に表示します。このツールを使用することで、アジア、ロンドン、ニューヨークのトレーディングセッションを簡単に区別でき、これらの重要な期間中の市場の動きをよりよく理解するのに役立ちます。 主な機能: トレーディングセッションの表示: チャート上にアジア、ロンドン、ニューヨークのトレーディングセッションをカラーの矩形で明確に表示します。 カスタマイズ可能なパラメータ: 各セッションの色、線の幅、および矩形の塗りつぶしの有無を調整できます。 動的表示: 指標は、表示する日数に応じて自動的に調整されます(最大3日まで)。 簡単な管理: コードはグラフィックオブジェクトを効率的
FREE

Gold Pro Scalper
Precise entry points for currencies, crypto, metals, stocks, indices! Indicator 100% does not repaint!!!
If a signal appeared, it does not disappear! Unlike indicators with redrawing, which lead to loss of deposit, because they can show a signal, and then remove it.
Trading with this indicator is very easy.
Wait for a signal from the indicator and enter the deal, according to the arrow
(Blue arrow - Buy, Red - Sell).
I recommend using it with the Trend Filter (download

An imbalance bar or candle, also called a fair value gap (FVG) or inefficiency, shows strong buying or selling in the market or weak buying or selling that causes prices to move quickly with high momentum. This is why it's an important part of price action analysis. Our indicator offers three main benefits: Clear Design: The imbalance bar is built into the candle with a simple, clean look that makes it easy for traders to spot while keeping the chart tidy. Easy to Use: A hotkey lets traders quic
FREE

This scanner is for showing Cross of various TDI elements: PriceLine, Trade Signal Line and Market Base Line And for getting alerts, so you can be prepared for finding good trade setups before they happen. It also shows TDI signals, trend, volatility and different timeframe alignment.
Detailed blog post:
https://www.mql5.com/en/blogs/post/759050
Features: Show TDI Signal and Trend Show Volatility & Overbought/Oversold Show cross between: PriceLine & TSL PriceLine & MBL MBL & TSL PriceLine and

Este indicador irá ajudá-lo a traçar as linhas do horizonte ( Marcelo Ferreira ) do Grafico semanal. Você poderá mudar trabalhar por exemplo em M5 ou M15. As linhas semanais permanecerão lá. Analisar as tendências em gráficos semanais antes de fazer uma entrada no mercado Forex é essencial para identificar a direção predominante do mercado a longo prazo. Esse tipo de análise ajuda a evitar decisões impulsivas baseadas em flutuações de curto prazo e fornece uma visão mais clara sobre o movimento
FREE

CYCLE WAVE OSCILLATOR indicator is an indicator based on cyclical price fluctuations. This indicator can help you determine overbought and oversold levels, and help you predict price trends within the cycle. MT5 Version here! You can combine it with our indicators below to make your trading decisions more accurate: Supply Demand Ribbon MT4 Basic
Feature: - Three Trend Types: + Zero + Basic + Advanced
FREE
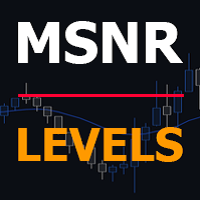
This is Multiple Timeframe of Malaysia SNR Levels and Storyline. The single timeframe version here Features: + Display level on multiple timeframe (higher or lower) + Turn on/off level on timeframe + Alert when price touch level 1. if high > resistance level but close of candle < resistance level , this level become unfresh - Name of level will have "(m)" meaning mitigated if close of candle > resistance level , this level become invalid and can be removed in chart (there is setting for keep
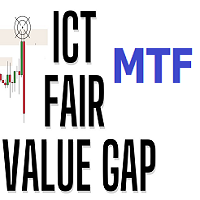
This indicator managge all kind of ICT FVG include: FVG, SIBI, BISI, Inverse FVG. The advantage point of this indicator is mangage FVG on all timeframe. FVG - Fair value gap ICT Fair value gap is found in a “three candles formation” in such a way that the middle candle is a big candlestick with most body range and the candles above & below that candle are short and don’t completely overlap the body of middle candle. * This indicator allow filter FVG by ATR. So you can just show valid FVG which

The Real Cloud indicator for MT4 is a popular and useful Forex indicator. This indicator provides traders with an easy way to identify potential trading opportunities in the Forex market. The Real Cloud indicator uses a unique algorithm to analyze price action and generate signals. It is designed to identify strong trends and provide traders with an edge in their trading. The Real Cloud indicator is easy to use and requires no additional setup. Simply attach the indicator to your chart and it wi
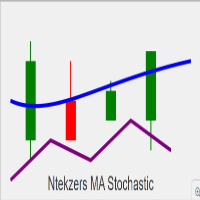
Please remember to leave a review for improvements thank you Overview of Key Functionalities: Buy Signal Conditions : The Stochastic Oscillator's main line crosses above the signal line. The closing price of the current candle is higher than the previous candle's close. The current closing price is above the EMA (Exponential Moving Average). The Stochastic value is below 50. When these conditions are met, a buy arrow is plotted, and alerts (audible or push notifications) are triggered. Sell Sign
FREE
Индикатор Order blocks Mtf строит уровни на основе smart mony(умные деньги) Строит уровни как сразу получил излом тренда, индикатор очень удобен и практичен для использование на форекс и на бинарных опционов В него в шита система поиска сигналов на касании старших уровней таким же уровней излома тренда и ретеста к среднему значению При касании уровня очень хорошо отрабатывает на бинарных опционах,

Stratos Pali Indicator is a revolutionary tool designed to enhance your trading strategy by accurately identifying market trends. This sophisticated indicator uses a unique algorithm to generate a complete histogram, which records when the trend is Long or Short. When a trend reversal occurs, an arrow appears, indicating the new direction of the trend.
Important Information Revealed Leave a review and contact me via mql5 message to receive My Top 5 set files for Stratos Pali at no cost!
Dow
GANNの正確な目標は、彼の時代を超えた方法に基づいて計算され、目の前に提示されます。このツールは、取引をよりスムーズで直感的にするために設計されています。白いラインを上に、または緑のラインを下に動かすことで、なぜGANNの技法が取引の世界で今なお影響力を持っているのかがすぐにわかるでしょう。 GANNの戦略は、市場の動きを高精度で予測することに焦点を当てており、このツールはその力をあなたの手元に提供します。経験豊富なトレーダーであっても、初心者であっても、ラインを操作することで、彼の手法がなぜ時の試練に耐えてきたのかを深く理解することができるでしょう。 GANNの正確な目標は、彼の時代を超えた方法に基づいて計算され、目の前に提示されます。このツールは、取引をよりスムーズで直感的にするために設計されています。白いラインを上に、または緑のラインを下に動かすことで、なぜGANNの技法が取引の世界で今なお影響力を持っているのかがすぐにわかるでしょう。 GANNの戦略は、市場の動きを高精度で予測することに焦点を当てており、このツールはその力をあなたの手元に提供します。経験豊富なトレーダーであっ

CVB Cumulative Volume Bands: 累積ボリュームでトレードを強化! CVB Cumulative Volume Bands は、累積ボリュームに基づく正確なシグナルを求めるトレーダー向けに設計された高度なインジケーターです。 このインジケーターは、累積ボリュームバンドを使用して、買いと売りの圧力を明確に読み取り、反転や強い価格変動を特定するのに役立ちます。 Cumulative Volume Bands for MT5 !
主な特徴: 累積ボリューム分析 : ボリュームに基づいて重要な圧力点を検出します。
明確なエントリー/エグジットシグナル : リアルタイムでチャンスを捉えます。
簡単な解釈 : ユーザーフレンドリーなインターフェースとシンプルなビジュアル。
全ての資産とタイムフレームに対応 : どの市場でも、いつでも使用可能。 CVB Cumulative Volume Bands で一歩先を行き、自信を持ってトレードの判断を改善しましょう! フィードバックをお寄せいただき、改善にご協力ください!

Zenマーケットフロー - MTFスーパートレンド
MTFスーパートレンドは、任意のタイムフレームで使用できるシステムです。このマルチタイムフレームインジケーターは、1つから3つのタイムフレームのシグナルを同時に表示し、それらの整合性を示します。
スーパートレンドインジケーターを気に入っている方は、このバージョンもきっと気に入るでしょう。
インジケーターのシグナルと描画をバックテストでテストすることもでき、マルチタイムフレームのシグナルを表示することができます。
すべてのタイムフレームが同じ方向を示しているときに、インジケーターはシグナルを提供し、スクリーンショットを撮り、アラートウィンドウをポップアップし、メールやプッシュ通知をスマートフォンに送信します。
高いタイムフレームの場合、クローズしたローソク足に基づいて値を表示するか、ローソク足ごとにインジケーターの値がどのように変化したかを確認するオプションがあります。
バックテストを行いたい場合も問題ありません。インジケーターは現在のタイムフレームのローソク足に基づいて、より高いタイムフレームのローソク足をシミュレーショ

The Block Master Pro indicator is designed to visually identify areas on the chart where significant volumes from major market participants are likely concentrated. These areas, known as order blocks, represent price ranges where large players place their orders, potentially signaling a price reversal and movement in the opposite direction. Key Features:
Order Block Identification: Block Master Pro effectively identifies order blocks by pinpointing price ranges where large orders are placed. Th

Introducing Volume Orderflow Profile , a versatile tool designed to help traders visualize and understand the dynamics of buying and selling pressure within a specified lookback period. Perfect for those looking to gain deeper insights into volume-based market behavior! MT5 Version - https://www.mql5.com/en/market/product/122657 The indicator gathers data on high and low prices, along with buy and sell volumes, over a user-defined period. It calculates the maximum and minimum prices during this
Welcome to enhanced pattern detection with the Double Top and Bottom Pattern Scanner ! Transform your trading approach with this powerful MT4 indicator designed for efficient pattern scanning and actionable alerts. Key Features: Advanced Zig Zag Pattern Detection : The Double Top and Bottom Pattern Scanner uses the zig zag pattern to detect tops and bottoms. It identifies points where the price bounces back twice from the same level after a long trend, signaling potential market reversals. Real

ATR Bands with Take-Profit Zones for MT4 The ATR Bands indicator for MT4 is designed to assist traders in managing risk and navigating market volatility. By using the Average True Range (ATR), it helps identify key price levels and set realistic stop-loss and take-profit zones. Key Features: ATR-Based Bands : The indicator calculates dynamic upper and lower bands using ATR. These bands adjust based on price volatility, helping to indicate potential support and resistance levels. Customizable Par
FREE

The indicator calculates a combination of two moving averages and displays their trend in derivative units. Unlike traditional oscillators, the maximum and minimum values in this indicator always correspond to the number of bars you want to track. This allows you to use custom levels regardless of volatility and other factors. The maximum and minimum values are always static and depend only on the initial Bar review settings.
The indicator can be used as an independent trading systemtrading
FREE
Engulfing Pattern is a free indicator available for MT4/MT5 platforms, its work is to provide "alerts" when a "Bullish" or "Bearish engulfing pattern forms on the timeframe. This indicator comes with alerts options mentioned in the parameter section below. Join our MQL5 group , where we share important news and updates. You are also welcome to join our private channel as well, contact me for the private link. Engulfing Pattern Indicator MT5 Other Products Try our Martini EA with 2 years of liv
FREE

This is a very simple multiple moving average indicator.
It can display 12 moving averages. The time axis of the moving averages can be changed in the input field of the indicator. The process is faster than the 12 moving averages included with MT4.
We also have a buffer set up so you can access it from an Expert Advisor. *For advanced users.
If you have any questions or requests, please message me.
Thank you. MT5 Version: https://www.mql5.com/en/market/product/124997
FREE

The indicator is getting the four most important trading sessions: New York London Sydney
Tokyo The indicator auto calculate the GMT time. The indicator has buffers that can be used to get the current session and the GMT.
You can use it as stand alone indicator and you can turn the draw off and call it from your EA. INPUTS Max Day: Max days back to get/draw. London Session On: Show/Hide London Session. New York Session On: Show/Hide New York Session. Sydney Session On: Show/Hide Sydney Session
FREE

The Multi Pairs Forex Indicator is an advanced trading too l that allows traders to track and analyze the performance of multiple currency pairs in real-time on a single chart. It consolidates data from various Forex pairs, providing an at-a-glance overview of market conditions across different currencies and helps you save time. Useful for various trading styles, including scalping, day trading, and swing trading. Whether you're monitoring major pairs like EUR/USD, GBP/USD, or more exotic pair
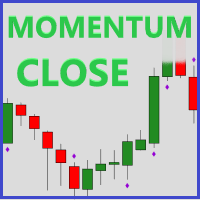
Momentum Close is a useful tool to identify volume based on the strength of a candle close. A strong candle close is when there is a small wick in comparison to the candle body and is a sign that the market will continue in that direction. *This is a NON-repainting indicator*
How this can help you? Identify trend strength Trend confirmation Seeing potential reversals (strong rejection candle) Developing entry and exit strategies Strong confluence to add to your strategy Volume analysis
Featur
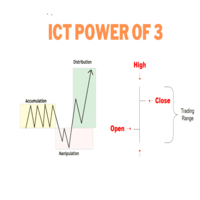
ONLY LOOK TO TRADE DURING TIMES AS SEEN IN SCREENSHOT. START TO LOAD THE INDICATOR BEFORE TO CALCULATE THE BARS SO IT SHOWS THE PHASES ACCORDING TO ICT. 1. London Silver Bullet (3:00 AM - 4:00 AM NY Time) Before 3:00 AM : The market is typically in the Accumulation Phase before the London open, where price consolidates, and large market players accumulate positions. You watch for this quiet consolidation leading up to the manipulation. 3:00 AM - 4:00 AM : Manipulation Phase occurs. During this
MetaTraderマーケットは、履歴データを使ったテストと最適化のための無料のデモ自動売買ロボットをダウンロードできる唯一のストアです。
アプリ概要と他のカスタマーからのレビューをご覧になり、ターミナルにダウンロードし、購入する前に自動売買ロボットをテストしてください。完全に無料でアプリをテストできるのはMetaTraderマーケットだけです。
取引の機会を逃しています。
- 無料取引アプリ
- 8千を超えるシグナルをコピー
- 金融ニュースで金融マーケットを探索
新規登録
ログイン