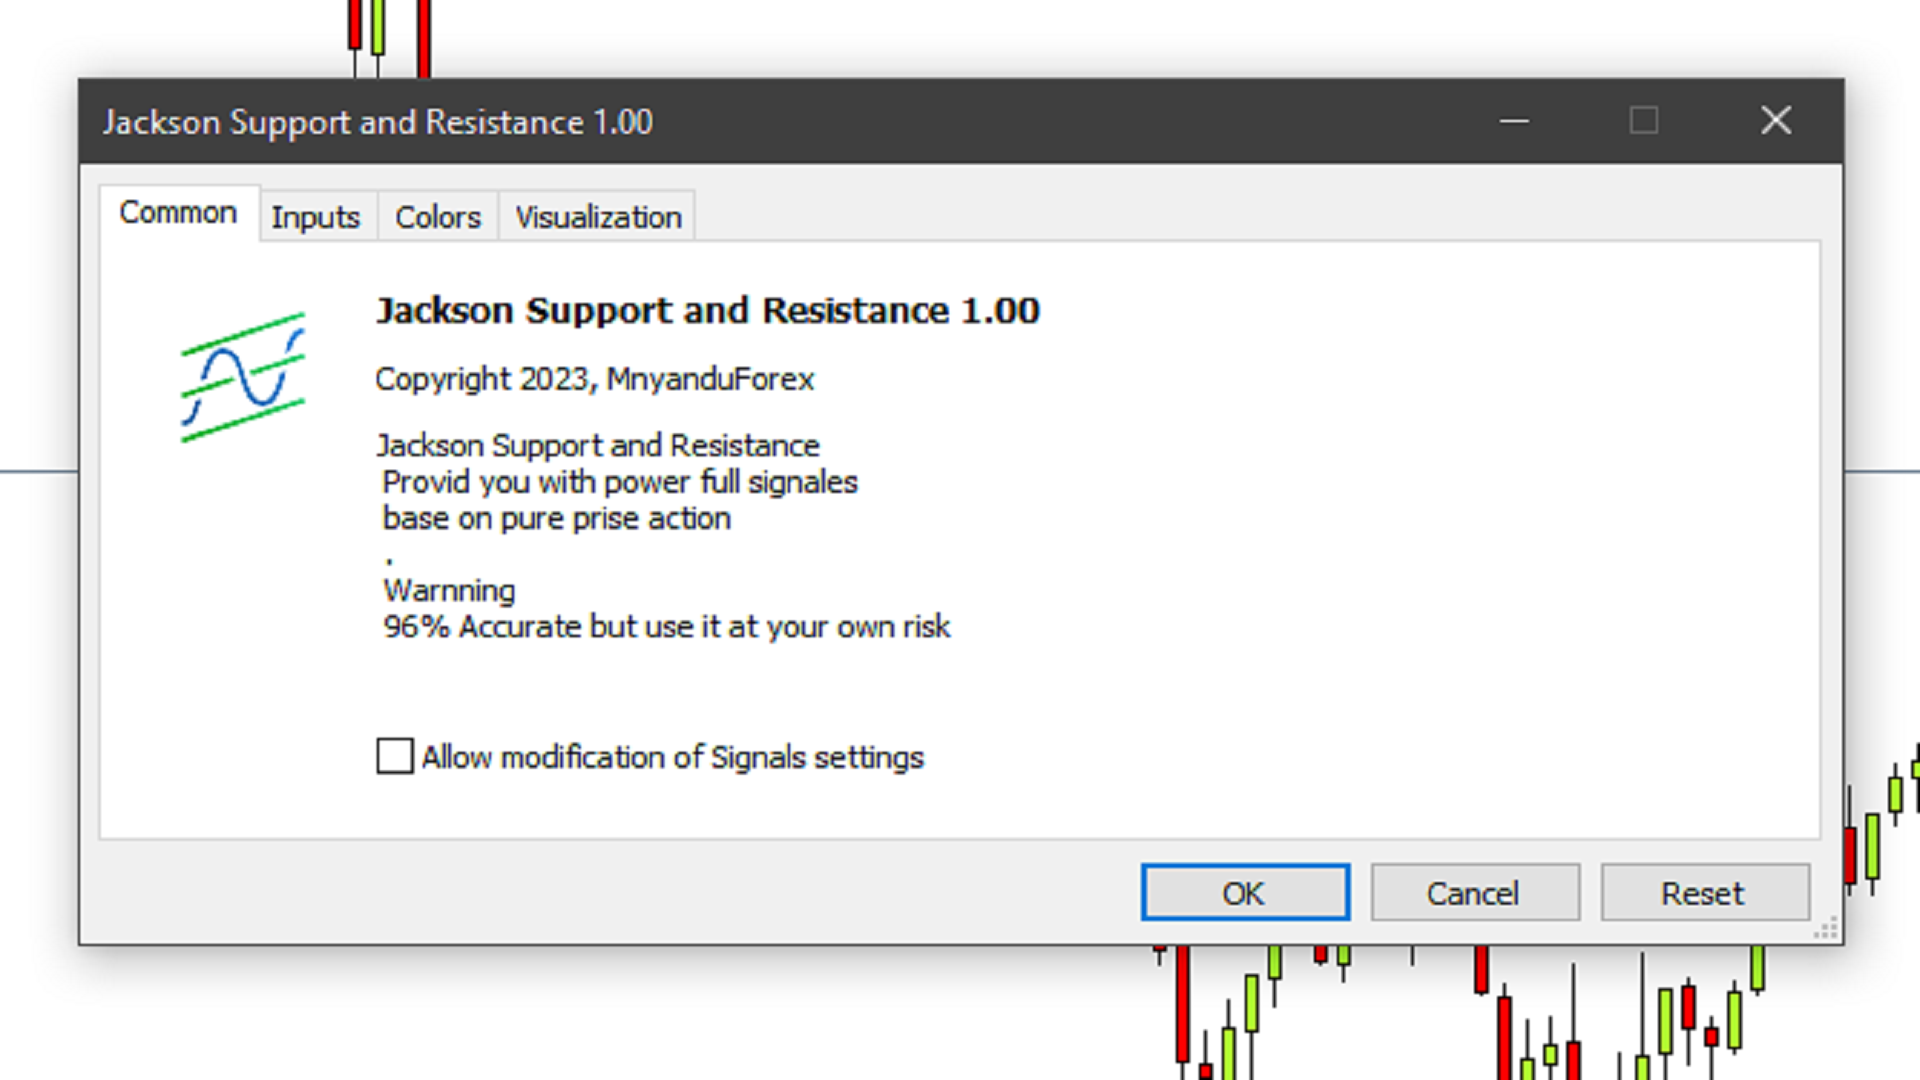
Jackson Support and Resistance
- 指标
- 版本: 1.0

Jackson Support and Resistance it a powerful advance support and resistance indicator which provide signal base on price action, it Design to make things easy for everyone to draw support and resistance. we believe most strategies are built with support and resistance as a foundation .Having support and resistance perfect can be a game change to you way of trading. It flexible to all instrument .don't forget to watch our video on how to us this indicator prefect and progressive.
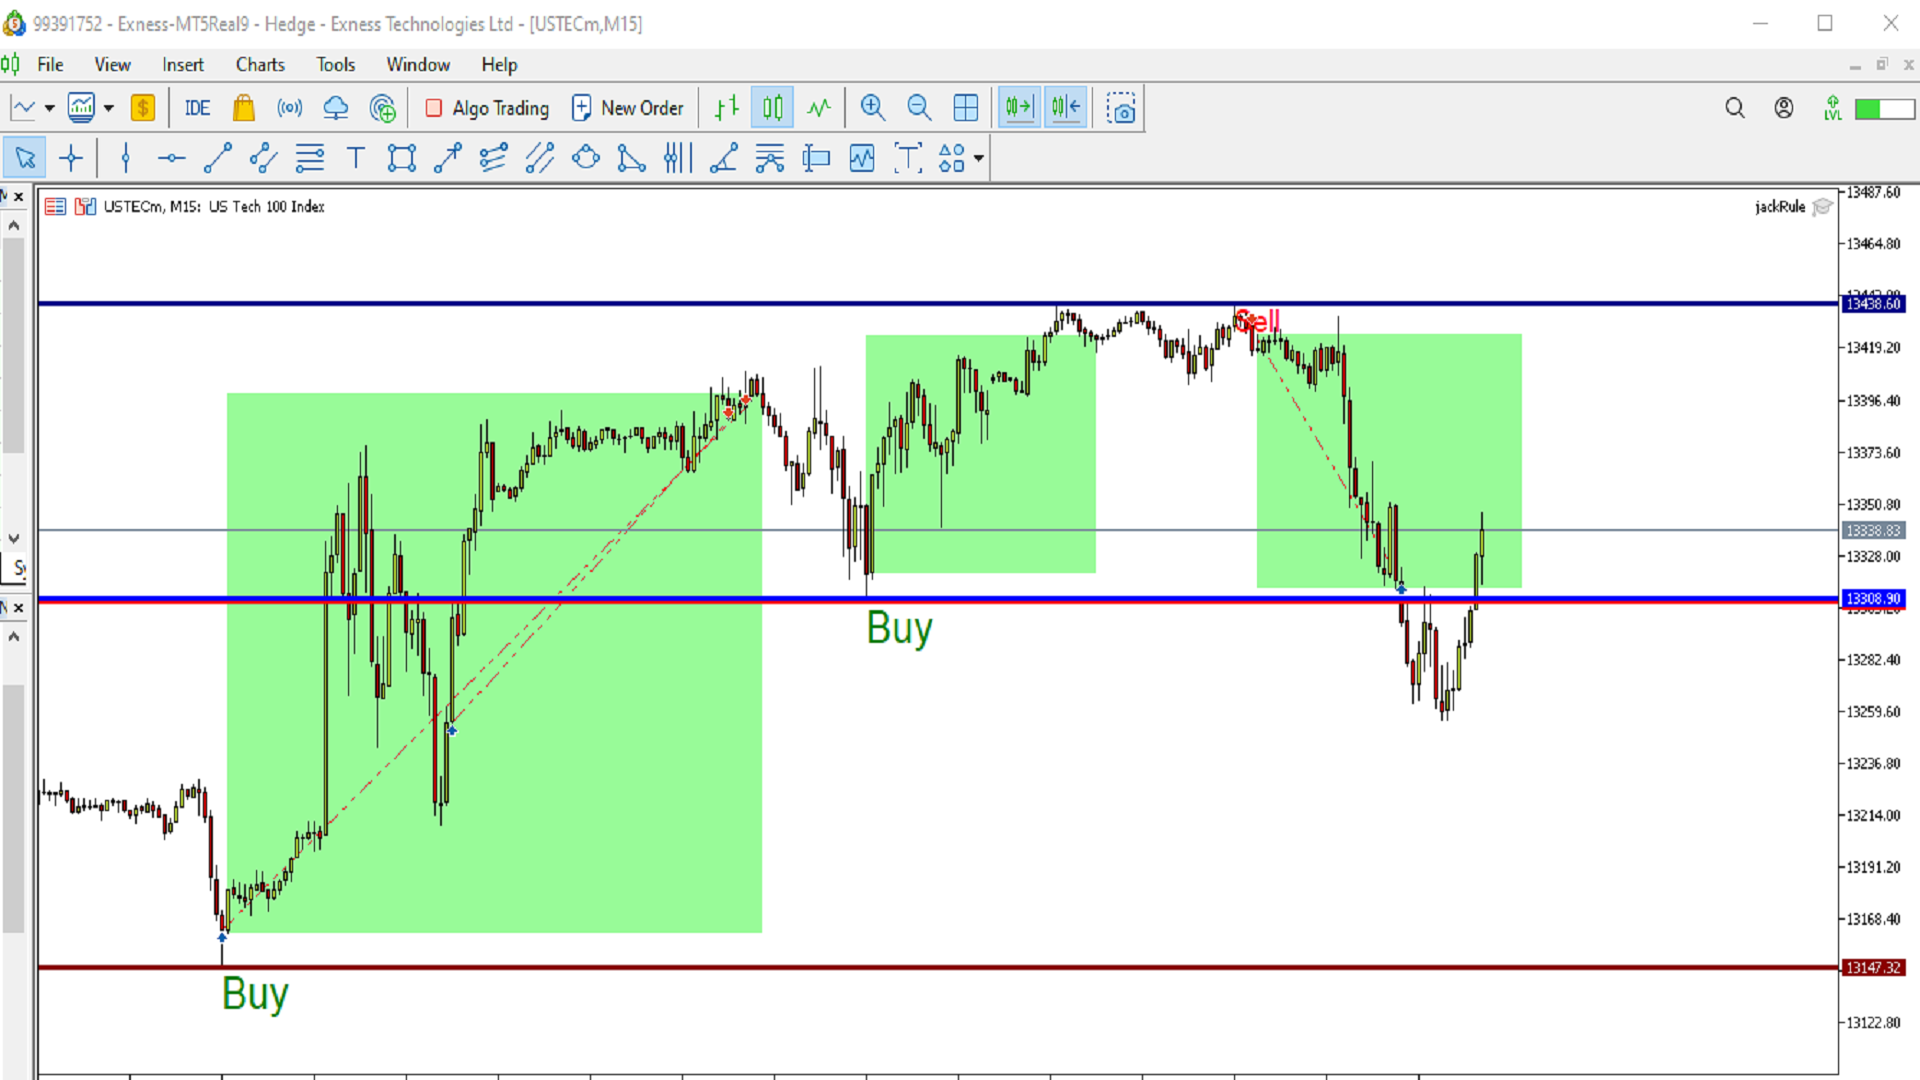


Excelente! Good job! Aumento mi rentabilidad, ya que me indica claramente donde generar una entrada.