TRI Visualizer MT5 – Thermodynamic Market Analysis Overview
The TRI (Thermal Range Indicator) Visualizer Enhanced is a rare market analysis indicator that goes beyond conventional technical analysis, applying principles of thermodynamics from physics. It interprets market price fluctuations as “thermodynamic energy,” enabling the highly accurate detection of subtle market changes that are often overlooked. Innovative Mechanisms 1. Dual Calculation Engines Classic TRI Mode Formula: |Close
Noize Absorption Index - is the manual trading system that measures the difference of pressure between bears forces and bulls forces. Green line - is a noize free index that showing curent situation. Zero value of index shows totally choppy/flat market.Values above zero level shows how powerfull bullish wave is and values below zero measures bearish forces.Up arrow appears on bearish market when it's ready to reverse, dn arrow appears on weak bullish market, as a result of reverse expectation.
Overview Heiken Ashi CE Filtered MT5 is a technical indicator for the MetaTrader 5 platform. It integrates smoothed candlestick charting with a dynamic exit strategy and a customizable trend filter to deliver clear buy and sell signals. The indicator is designed to improve trend detection and signal reliability by reducing market noise. If you want to see more high-quality products or order the development/conversion of your own products, visit my partners' website: 4xDev
Get 10% OFF on manual
SMART ATR GRID PRO++ – Adaptive Grid Intelligence Suite is a next-generation, institutional-grade grid trading indicator engineered for traders who demand precision, adaptability, and comprehensive market structure analysis. By seamlessly integrating Adaptive Volatility Grid System , KAMA Candle Trend Filtering , Multi-Factor Trend Detection (ADX + EMA20/50) , Dynamic Heatmap Zone Engine , and Real-Time Market Regime Classification , this indicator delivers a complete decision-making
CosmiCLab SMC FIBO CosmiCLab SMC FIBO is a professional trading indicator designed for traders who use Smart Money Concepts (SMC), market structure analysis and Fibonacci retracement levels. The indicator automatically detects market swings and builds Fibonacci levels based on the latest impulse movement.
It also identifies market structure changes such as BOS (Break of Structure) and CHOCH (Change of Character), helping traders understand the current market direction. CosmiCLab SMC FIBO also pr
Improved version of the free HMA Trend indicator (for MetaTrader 4) with statistical analysis. HMA Trend is a trend indicator based on the Hull Moving Average (HMA) with two periods. HMA with a slow period identifies the trend, while HMA with a fast period determines the short-term movements and signals in the trend direction.
The main differences from the free version: Ability to predict the probability of a trend reversal using analysis of history data. Plotting statistical charts for analyzi
Overview Cardwell Range Analyze reads the market through an RSI range regime, inspired by Andrew Cardwell's RSI rules, combined with a trend filter. It adds higher timeframe confirmation and an ADX filter to avoid weak, sideways markets. When momentum and trend agree, the indicator prints a Buy or Sell signal and draws a complete trade plan on the chart: Entry, Stop Loss and three Take Profit targets, with shaded risk and reward zones. A compact dashboard summarizes the market state at a glance.
Binary Options Assistant (BOA) Multi Currency Dashboard for Binary Options (MT5) .
You can use any of the BOA Signals Indicators with the dashboard. Just change the BOA Signals Indicator Name in the dashboard settings to the indicator you want to get signals from. For example: CHILL. BLAZE: BOA_BLAZE_Indicator_v1 Strategy : BLW Online Trading Binary Options Strategy (3 Moving Average)
LAVA: BOA_LAVA_Indicator_v1 Strategy: Lady Trader Binary Options Strategy (Bollinger Bands & Stochas
Was: $249 Now: $99 Market Profile defines a number of day types that can help the trader to determine market behaviour. A key feature is the Value Area, representing the range of price action where 70% of trading took place. Understanding the Value Area can give traders valuable insight into market direction and establish the higher odds trade. It is an excellent addition to any system you may be using. Inspired by Jim Dalton’s book “Mind Over Markets”, this indicator is designed to suit the
Price Magnet — Price Density and Attraction Levels Indicator Price Magnet is a professional analytical tool designed to identify key support and resistance levels based on statistical Price Density. The indicator analyzes a specified historical period and detects price levels where the market spent the most time. These zones act as “magnets,” attracting price action or forming a structural base for potential reversals. Unlike traditional Volume Profile tools, Price Magnet focuses on price-time d
No Demand No Supply This indicator identifies No Demand –No Supply candles to your chart and plots volume bars colored according to the signal. It can be applied to all timeframes or to a specific one only. It can also be used as regular volume indicator with exceptional future of WEIGHTED VOLUME. Furthermore is has an alert notification, sound and email when a signals occurs. The indicator does not repaint but the alert will come on two candles back due to the definition of No Demand No Su
Advanced Lot & Profit Monitor PRO is a powerful MT5 indicator that provides real-time monitoring of your trading positions directly on the chart. It displays the number of orders, total lot sizes, and profit (including swap) for Buy and Sell positions separately, as well as the overall account performance. Designed with a clean and customizable interface, this tool helps traders stay in control of their exposure and risk at all times. Key Features: Real-time monitoring of open positions Sepa
GDS Renko Zones Intelligence Renko Zones Indicator MT5 with Score, Freshness and Active Zone Verdict GDS Renko Zones Intelligence is a premium Renko zones indicator for MetaTrader 5. It adds zone score, freshness lifecycle, active zone verdict, Top Zones and flip-level context to Renko support and resistance analysis. Free Renko Zones shows where the zones are. GDS Renko Zones Intelligence helps explain what they mean. The indicator does not give buy or sell signals. It does not predict price mo
ADVANCED FUNCTIONALITIES: Trend Score (0-100) with visual bar Intelligent signals with adjustable strength (1-10) Risk management with automatic TP/SL Audible and visual alerts Price zones with smooth filling Multi-indicator analysis (RSI, ATR, BB, EMAs) DESIGN FEATURES Modern Visual: Smooth and well-spaced lines (EMA with 2-3px width) Vibrant and professional colors (Sky Blue, Orange, Gold) Modern arrows (code 233/234) for buy/sell signals Configurable dark/light theme Adjustable transparency f
Multi Timeframe Smc Bias Finder Trading in alignment with higher timeframe structure is one of the most consistently profitable habits a trader can build. The difficulty has always been execution: switching between timeframes, manually reading structure, and keeping track of whether the Daily, 4-Hour and 1-Hour are all pointing in the same direction before committing to a position. Multi Timeframe Smc Bias Finder resolves that entirely. Three tools in one indicator: A live multi-timeframe bias d
Laguerre SuperTrend Clouds adds an Adaptive Laguerre averaging algorithm and alerts to the widely popular SuperTrend indicator. As the name suggests, Laguerre SuperTrend Clouds (LSC) is a trending indicator which works best in trendy (not choppy) markets. The SuperTrend is an extremely popular indicator for intraday and daily trading, and can be used on any timeframe. Incorporating Laguerre's equation to this can facilitate more robust trend detection and smoother filters. The LSC uses the
SCALPER PRO – Complete Market Intelligence Suite Scalper PRO is a next-generation, all-in-one trading indicator engineered for traders who demand precision, speed, and institutional-grade market analysis. By seamlessly integrating KAMA Adaptive Trend Filtering, ATR Consensus Logic, Smart Money Concepts (SMC), RSI Sentiment Analysis, Williams %R (WPR) Momentum Detection, and Multi-Timeframe Trend Bias , this indicator delivers a complete decision-making framework for scalpers, day traders, and s
CRT Candle Range Theory HTF MT5. Ultimate CRT Indicator: Advanced ICT Concepts and Malaysian SnR Trading System Master the Market Maker's Footprints with the Most Advanced Candle Range Theory Indicator Unlock the true power of Smart Money Concepts (SMC) and trade precisely like the institutions with the Ultimate CRT Indicator . Built exclusively for serious traders, this indicator automates the highly effective Candle Range Theory (CRT) , a core pillar of ICT Concepts (Inner Circle Trader
Divergent Stochastic Filter II Catch Reversals Early, Filter Noise, Trade with Confidence The Edge: Why This Stochastic is Different Every trader knows the Stochastic oscillator. But knowing when to trust its signals, that's the real challenge. The Divergent Stochastic Filter II transforms this classic indicator into a precision reversal detection system by adding critical elements: divergence intelligence, signal filtering and exhaustion detection. While standard Stochastic oscillators fire s
Crash 1000 Scalping Indicator for the Crash 1000 Deriv Synthetic Index. Introduction The Crash 1000 Scalping Indicator is a specialized tool designed for the Crash 1000 index on the Deriv Synthetic market. This indicator is particularly useful for scalping on the M1 timeframe, helping traders to identify precise entry and exit points for buy positions. It is designed to be non-repainting, providing clear signals with audible alerts and push notifications, and is compatible with mobile devices th
Fibo Daily Channel Indicator The Indicator is a powerful tool for traders, providing precise daily support and resistance levels based on Fibonacci retracement and extension calculations. This indicator automatically draws key pivot points (PP, R1, R2, S1, S2) as well as additional extension levels (R3, R4, S3, S4), helping traders identify potential reversal and breakout zones with ease. It includes customizable alerts and push notifications, allowing traders to receive updates whenever the pr
Welcome to ENTRY IN THE ZONE AND SMC MULTI TIMEFRAME Entry In The Zone and SMC Multi Timeframe is a professional trading indicator built on Smart Money Concepts (SMC) , combining market structure analysis with a No Repaint BUY / SELL signal system in a single indicator. It helps traders understand market structure more clearly, identify key price zones, and focus on higher-quality trading opportunities. By combining Multi-Timeframe Analysis , Points of Interest (POIs) , and real-time signals, th
Neuro Poseidon is a new indicator by Daria Rezueva. It combines precise trading signals with adaptive TP/SL levels - creating best possible trades as a result!
Message me and get Neuro Poseidon Assistant as a gift to automize your trading process!
What makes it stand out?
1. Proven profitability on all assets and timeframes
2. Only confirmed BUY and SELL signals present on the chart
3. Adaptive TP & SL levels generated by the software for each trade
4. Easy to understand - suitable for al
ARICoin is a powerful trading companion designed to generate high-probability entry signals with dynamic TP/SL/DP levels based on volatility. Built-in performance tracking shows win/loss stats, PP1/PP2 hits, and success rates all updated live. Key Features: Buy/Sell signals with adaptive volatility bands Real-time TP/SL/DP levels based on ATR Built-in MA Filter with optional ATR/StdDev volatility Performance stats panel (Success, Profit/Loss, PP1/PP2) Alerts via popup, sound, push, or email Cust
Crystal Heikin Ashi Signals - Professional Trend & Signal Detection Indicator Advanced Heikin Ashi Visualization with Intelligent Signal System for Manual & Automated Trading
Final Price: $149 ---------> Price goes up $10 after every 10 sales .
Limited slots available — act fast .
Overview Crystal Heikin Ashi Signals is a professional-grade MetaTrader 5 indicator that combines pure Heikin Ashi candle visualization with an advanced momentum-shift detection system. Designed for both manual traders
ARIPoint is a powerful trading companion designed to generate high-probability entry signals with dynamic TP/SL/DP levels based on volatility. Built-in performance tracking shows win/loss stats, PP1/PP2 hits, and success rates all updated live. Key Features: Buy/Sell signals with adaptive volatility bands Real-time TP/SL/DP levels based on ATR Built-in MA Filter with optional ATR/StdDev volatility Performance stats panel (Success, Profit/Loss, PP1/PP2) Alerts via popup, sound, push, or email Cu
GEM Signal Pro GEM Signal Pro 是一款適用於 MetaTrader 5 的趨勢跟隨指標,專為希望在圖表上獲得更清晰訊號、更有結構的交易設定,以及更實用風險管理的交易者而設計。 它不僅僅顯示一個簡單的箭頭,GEM Signal Pro 還能以更清晰、更易讀的方式呈現完整的交易思路。當條件確認完成後,指標可在圖表上顯示進場價、止損價與止盈目標,幫助交易者更有效率地評估交易設定。 運作方式 該指標首先根據其內部邏輯識別有效的初始訊號。 當確認條件滿足後,GEM Signal Pro 會在圖表上顯示完整的交易設定。這讓交易者可以更清楚地看到交易結構,並減少手動分析與計算的工作量。 圖表上的交易價位 對於已確認的訊號,GEM Signal Pro 可顯示: 進場價
止損價
止盈 1
止盈 2
止盈 3
風險報酬比 這讓交易設定更容易理解,也有助於讓圖表分析更有條理。 內建風險管理 風險管理是此指標設計的重要部分。 止損位基於近期市場結構,結合附近的擺動高低點與可選的 ATR 緩衝距離。這能讓交易價位更貼近當前市場條件,而不只是依賴固定距離。 圖表資訊面板 GEM Si
note: this indicator is for METATRADER4, if you want the version for METATRADER5 this is the link: https://www.mql5.com/it/market/product/108106 TRENDMAESTRO ver 2.5 TRENDMAESTRO recognizes a new TREND from the start, he never makes mistakes. The certainty of identifying a new TREND is priceless. DESCRIPTION TRENDMAESTRO identifies a new TREND in the bud, this indicator examines the volatility, volumes and momentum to identify the moment in which there is an explosion of one or more of these da
SkyHammer Signal Pro Professional No-Repaint Trend Signal Indicator with Locked Entry, SL and TP Levels SkyHammer Signal Pro is a structured trend and momentum signal indicator designed for traders who want clear, fixed, and verifiable trading signals. It works best on lower timeframes such as M1 and M5 . The indicator does not try to predict tops or bottoms. Instead, it waits for confirmed market structure, trend direction, momentum strength, volatility quality, and target space before generati
SMC Pro ToolKit is a professional chart-based Smart Money Concepts indicator for MetaTrader 5. It helps traders read market structure, identify key liquidity areas, organize trade context, and plan setups directly from the chart. This is not a simple buy/sell arrow indicator. It is a complete visual trading toolkit that combines Smart Money Concepts, multi-timeframe analysis, session context, setup planning, risk assistance, and professional dashboard tools in one clean workspace. Watch setup
CRYSTAL QUANTUM PRO Institutional Signal & Trade Intelligence for MetaTrader 5 Final Price: 199 USD ----> Price goes up 10 USD after every 10 sales. Limited launch slots available, act fast. Most indicators give you an arrow and leave you alone. A naked arrow is a gamble. Winning consistently requires CONFLUENCE , a clear STOP and TARGET , and honest PROOF that the system works. Crystal Quantum Pro delivers all three in one clean, no-repaint package. Crystal Quantum Pro is a complete decision sy
The Oracle Pro:用于 MT5 的合成多周期偏向引擎 ️ 夏季上市优惠 — 早期买家可以 199 USD 获得 The Oracle Pro。价格将随关注度上升;最终价格 399 USD。 The Oracle Pro 是一款面向高要求与专业交易者的 MetaTrader 5 高级多周期 偏向引擎 。它以纪律回答一个问题:当前每个周期的方向偏向是什么、强度如何、各周期之间的一致程度如何?一切仅在已收盘的 K 线上计算——绝不重绘。 The Oracle Pro 是一套多因子共识系统。它将专有指标与优化算法整合为单一而精密的共识向量,并在单个指标实例内,跨当前周期与更高周期的堆栈进行读取——而不是在多个图表上堆叠互不相关的工具。 它是 Oracle 共识方法的专业进化版:完整重建为高级操作控制台,面向希望在一个纪律化工作流中获得深度、多周期背景与背离洞察的交易者。 是偏向引擎,而非信号生成器 The Oracle Pro 明确自身定位。它是一款提供纪律化方向背景的 多周期多因子偏向指标 。它 不是 信号生成器:不承诺入场、出场或盈利。偏向是背景——你在其方向上交易自己的设置
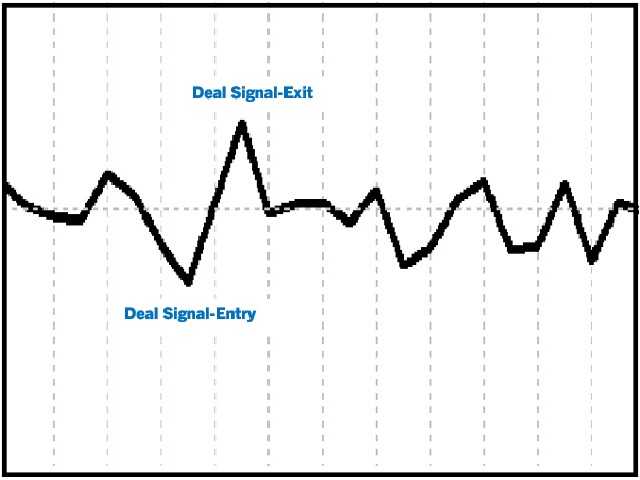
A very Simple Indicator for experienced and professional traders. It indicates direction of trade and provides signals of best deals. Signal is referred here a point on chart where indicator line turns its direction or converges. This indicator finds underlaying trading asset trade direction and indicates best scenarios of trade as described in screenshots. Where it has run for a period of time and converges to best deal scenarios.
Have a Look!
A Good , Easy , Readable and handy indicator for experienced and professional traders. It gives bounded signals between zero and one. Easy for investors to comprehend. It gives near and longer trading outlook to investors and helps them to find good opportunities. Indicator gives zero signal on price downturns and signal value equals to one on price upturns. Once again a new type of indicator and rangebound between zero and one .
A value indicator. It is helping tool to indicate the direction of value gain. A best helping tool to trade value. This indicator is equipped with a colored line and a digital tool to indicate value numerically .
This indicator also helps to indicate value during trends. A study based on this indicator shows value of trade significantly changes during trends best tool to chase the trends.
A basic tool for experienced and professional traders to trade percentile of the value. It indicates both values in the form of digits appeared on the left corner of the screen.
Instructions Manual : First choose your desired symbol and then select this tool. Please be remined that this tool is just a helping tool. its upon trader what he desired so. The function of this tool is just to provide a help in trading.
A technical Indicator Providing Price Convergence Signals along with value for experienced and professional traders. Easy to comprehend, Easy to understand.
This is a helping tool provides best signals. This indicator is designed based on the fundamentals of trade. A very good indicator you can customized its color. A best tool to find trade direction.
An adaptive indicator. It constantly adapts to the trade.
A very good indicator for Experienced and Professional Traders. A practical approach to trading. Easy to understand. A helping tool for traders looking for price movements .
Signals: Signal Number 1: When yellow line which is a signal line crossing the zero line towards downward direction is a selling opportunity. Signal Number 2:
When yellow line which is a signal line crossing the zero line towards upward direction is a buying opportunity.
Un indicador bueno, fácil, legible y práctico. Da señales acotadas entre cero y uno. Fácil de comprender para los inversores. Brinda perspectivas comerciales cercanas y a más largo plazo a los inversores y los ayuda a encontrar buenas oportunidades. El indicador da una señal cero en las caídas de precios y el valor de la señal es igual a uno en las subidas de precios. Una vez más, un nuevo tipo de indicador y rango limitado entre cero y uno.
Sales Sales for seasonal traders.A new type of indicator for Professional and Experienced Traders. Specifically designed for trend identification. A great tool for investors to invest at the right and suitable time for decent trading. You can present it to your potential clients and customers for their satisfaction. A very handy and trendy tool. Easy to read , comprehend and user friendly. By this tool you can easily identify the potential to enter in trading and low potential to exit.
It c
A technical Indicator Providing Price Convergence Signals along with value for experienced and professional traders. Easy to comprehend, Easy to understand.
This is a helping tool provides best signals. This indicator is designed based on the fundamentals of trade. A very good indicator you can customized its color. A best tool to find trade direction.
An adaptive indicator. It constantly adapts to the trade.
A value indicator for experienced and professional traders. It is helping tool to indicate the direction value gain. A best helping tool to trade value. This indicator is equipped with a colored line and a digital tool to indicate value numerically .
This indicator also helps to indicate value during trends. A study based on this indicator shows value of trade significantly changes during trends best tool to cash the trends.
Best helping tool for Professional and Experienced traders. A best Tool To find the trend. Instruction Manual: First Select your desired Symbol. Then attach this tool and wait till it identify the trend for you. Then it will be more feasible to trade.
Once again best tool to trade. Demo version is available you can fully test its functionality. More importantly there are always trend breaks Once Trend break is observed un-attach this tool and then re-attach to get the fresh trend. Precautions:
A basic tool for traders to trade percentile of the value. It indicates both values in the for of digits appeared on the left corner of the screen.
Instructions Manual : First choose your desired symbol and then select this tool. Please be remined that this tool is just a helping tool. its upon trader what he desired so. The function of this tool is just to provide a help in trading.
A very good indicator for experienced and professional traders . A practical approach to trading. Easy to understand. A helping tool for traders looking for price movements .
Signals: Signal Number 1: When yellow line which is a signal line crossing the zero line towards downward direction is a selling opportunity. Signal Number 2:
When yellow line which is a signal line crossing the zero line towards upward direction is a buying opportunity.