Volatility Meter MT4 Edition
- 指标
- 版本: 1.0
- 激活: 5
A very good indicator for Experienced and Professional Traders. A practical approach to trading. Easy to understand. A helping tool for traders looking for price movements .
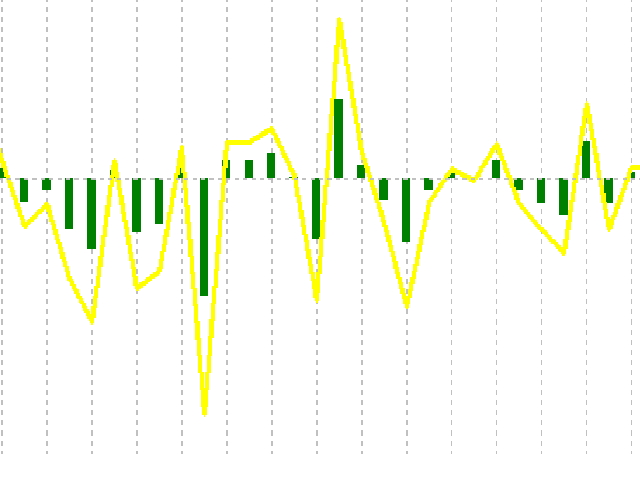
Signals:
Signal Number 1:
When yellow line which is a signal line crossing the zero line towards downward direction is a selling opportunity.
Signal Number 2:
When yellow line which is a signal line crossing the zero line towards upward direction is a buying opportunity.