Noize Absorption Index - is the manual trading system that measures the difference of pressure between bears forces and bulls forces. Green line - is a noize free index that showing curent situation. Zero value of index shows totally choppy/flat market.Values above zero level shows how powerfull bullish wave is and values below zero measures bearish forces.Up arrow appears on bearish market when it's ready to reverse, dn arrow appears on weak bullish market, as a result of reverse expectation.
Overview Heiken Ashi CE Filtered MT5 is a technical indicator for the MetaTrader 5 platform. It integrates smoothed candlestick charting with a dynamic exit strategy and a customizable trend filter to deliver clear buy and sell signals. The indicator is designed to improve trend detection and signal reliability by reducing market noise. If you want to see more high-quality products or order the development/conversion of your own products, visit my partners' website: 4xDev
Get 10% OFF on manual
CosmiCLab SMC FIBO CosmiCLab SMC FIBO is a professional trading indicator designed for traders who use Smart Money Concepts (SMC), market structure analysis and Fibonacci retracement levels. The indicator automatically detects market swings and builds Fibonacci levels based on the latest impulse movement.
It also identifies market structure changes such as BOS (Break of Structure) and CHOCH (Change of Character), helping traders understand the current market direction. CosmiCLab SMC FIBO also pr
Improved version of the free HMA Trend indicator (for MetaTrader 4) with statistical analysis. HMA Trend is a trend indicator based on the Hull Moving Average (HMA) with two periods. HMA with a slow period identifies the trend, while HMA with a fast period determines the short-term movements and signals in the trend direction.
The main differences from the free version: Ability to predict the probability of a trend reversal using analysis of history data. Plotting statistical charts for analyzi
Binary Options Assistant (BOA) Multi Currency Dashboard for Binary Options (MT5) .
You can use any of the BOA Signals Indicators with the dashboard. Just change the BOA Signals Indicator Name in the dashboard settings to the indicator you want to get signals from. For example: CHILL. BLAZE: BOA_BLAZE_Indicator_v1 Strategy : BLW Online Trading Binary Options Strategy (3 Moving Average)
LAVA: BOA_LAVA_Indicator_v1 Strategy: Lady Trader Binary Options Strategy (Bollinger Bands & Stochas
Was: $249 Now: $99 Market Profile defines a number of day types that can help the trader to determine market behaviour. A key feature is the Value Area, representing the range of price action where 70% of trading took place. Understanding the Value Area can give traders valuable insight into market direction and establish the higher odds trade. It is an excellent addition to any system you may be using. Inspired by Jim Dalton’s book “Mind Over Markets”, this indicator is designed to suit the
Price Magnet — Price Density and Attraction Levels Indicator Price Magnet is a professional analytical tool designed to identify key support and resistance levels based on statistical Price Density. The indicator analyzes a specified historical period and detects price levels where the market spent the most time. These zones act as “magnets,” attracting price action or forming a structural base for potential reversals. Unlike traditional Volume Profile tools, Price Magnet focuses on price-time d
No Demand No Supply This indicator identifies No Demand –No Supply candles to your chart and plots volume bars colored according to the signal. It can be applied to all timeframes or to a specific one only. It can also be used as regular volume indicator with exceptional future of WEIGHTED VOLUME. Furthermore is has an alert notification, sound and email when a signals occurs. The indicator does not repaint but the alert will come on two candles back due to the definition of No Demand No Su
Advanced Lot & Profit Monitor PRO is a powerful MT5 indicator that provides real-time monitoring of your trading positions directly on the chart. It displays the number of orders, total lot sizes, and profit (including swap) for Buy and Sell positions separately, as well as the overall account performance. Designed with a clean and customizable interface, this tool helps traders stay in control of their exposure and risk at all times. Key Features: Real-time monitoring of open positions Sepa
This indicator is used to compare the relative strength of the trade on the chart against the other several selected symbols.
By comparing the price movement of each traded variety based on the same base day, several trend lines of different directions can be seen, reflecting the strong and weak relationship between the several different traded varieties, so that we can have a clearer understanding of the market trend. For example, you can apply this indicator on a EurUSD chart and compare it w
ADVANCED FUNCTIONALITIES: Trend Score (0-100) with visual bar Intelligent signals with adjustable strength (1-10) Risk management with automatic TP/SL Audible and visual alerts Price zones with smooth filling Multi-indicator analysis (RSI, ATR, BB, EMAs) DESIGN FEATURES Modern Visual: Smooth and well-spaced lines (EMA with 2-3px width) Vibrant and professional colors (Sky Blue, Orange, Gold) Modern arrows (code 233/234) for buy/sell signals Configurable dark/light theme Adjustable transparency f
Multi Timeframe Smc Bias Finder Trading in alignment with higher timeframe structure is one of the most consistently profitable habits a trader can build. The difficulty has always been execution: switching between timeframes, manually reading structure, and keeping track of whether the Daily, 4-Hour and 1-Hour are all pointing in the same direction before committing to a position. Multi Timeframe Smc Bias Finder resolves that entirely. Three tools in one indicator: A live multi-timeframe bias d
Laguerre SuperTrend Clouds adds an Adaptive Laguerre averaging algorithm and alerts to the widely popular SuperTrend indicator. As the name suggests, Laguerre SuperTrend Clouds (LSC) is a trending indicator which works best in trendy (not choppy) markets. The SuperTrend is an extremely popular indicator for intraday and daily trading, and can be used on any timeframe. Incorporating Laguerre's equation to this can facilitate more robust trend detection and smoother filters. The LSC uses the
# DRAWDOWN INDICATOR V4.0 - The Essential Tool to Master Your Trading
## Transform Your Trading with a Complete Real-Time Performance Overview
In the demanding world of Forex and CFD trading, **knowing your real-time performance** isn't a luxury—it's an **absolute necessity**. The **Drawdown Indicator V4.0** is much more than a simple indicator: it's your **professional dashboard** that gives you a clear, precise, and instant view of your trading account status.
---
## Why This Indicator
Divergent Stochastic Filter II Catch Reversals Early, Filter Noise, Trade with Confidence The Edge: Why This Stochastic is Different Every trader knows the Stochastic oscillator. But knowing when to trust its signals, that's the real challenge. The Divergent Stochastic Filter II transforms this classic indicator into a precision reversal detection system by adding critical elements: divergence intelligence, signal filtering and exhaustion detection. While standard Stochastic oscillators fire s
Crash 1000 Scalping Indicator for the Crash 1000 Deriv Synthetic Index. Introduction The Crash 1000 Scalping Indicator is a specialized tool designed for the Crash 1000 index on the Deriv Synthetic market. This indicator is particularly useful for scalping on the M1 timeframe, helping traders to identify precise entry and exit points for buy positions. It is designed to be non-repainting, providing clear signals with audible alerts and push notifications, and is compatible with mobile devices th
Fibo Daily Channel Indicator The Indicator is a powerful tool for traders, providing precise daily support and resistance levels based on Fibonacci retracement and extension calculations. This indicator automatically draws key pivot points (PP, R1, R2, S1, S2) as well as additional extension levels (R3, R4, S3, S4), helping traders identify potential reversal and breakout zones with ease. It includes customizable alerts and push notifications, allowing traders to receive updates whenever the pr
CyberTradeTHxAI Gold Sniper MT5 Professional Gold Trading Signal Indicator for MetaTrader 5 CyberTradeTHxAI Gold Sniper MT5 is a professional-grade Gold (XAUUSD) trading indicator developed to identify high-probability Buy and Sell opportunities using trend analysis, pullback confirmation, and intelligent market structure detection. Designed for both beginner and advanced traders, the indicator automatically calculates optimal Entry Zones, Stop Loss, and multiple Take Profit levels while provid
Potential Reversal Price (PRP) Indicator - Ultimate Sniper Entries for XAUUSD Discounted Price !! Secure your lifetime access now before it switches to subscription-only ! Welcome to the Potential Reversal Price (PRP) Indicator , your ultimate trading tool designed to catch high-probability market reversals with extreme precision. Built for serious traders who demand accuracy, the PRP Indicator combines advanced market structure analysis with momentum exhaustion to pinpoint the exa
Neuro Poseidon is a new indicator by Daria Rezueva. It combines precise trading signals with adaptive TP/SL levels - creating best possible trades as a result!
Message me and get Neuro Poseidon Assistant as a gift to automize your trading process!
What makes it stand out?
1. Proven profitability on all assets and timeframes
2. Only confirmed BUY and SELL signals present on the chart
3. Adaptive TP & SL levels generated by the software for each trade
4. Easy to understand - suitable for al
Entry In The Zone and SMC Multi Timeframe is a real-time 2-in-1 market analysis tool that combines market structure analysis and a No Repaint BUY / SELL signal system into a single indicator, built on Smart Money Concepts (SMC) — a widely adopted framework used by professional traders to understand market structure. This indicator helps you see the market more clearly, make decisions based on structure rather than guesswork, and focus on high-probability zones where price is more likely to react
The Oracle Pro:MT5向け合成マルチタイムフレーム・バイアスエンジン ️ サマー・ローンチ・オファー — The Oracle Pro を 199 USD で(早期購入者向け)。価格は普及に応じて上昇します。最終価格 399 USD。 The Oracle Pro は、要求の高いプロのトレーダーのために作られた MetaTrader 5 向けのプレミアム・マルチタイムフレーム バイアスエンジン です。ひとつの問いに規律をもって答えます。すなわち、各タイムフレームの現在の方向バイアスは何か、その強さはどれほどか、そしてタイムフレーム同士はどれだけ一致しているか。すべては確定足のみで計算され、リペイントはありません。 The Oracle Pro はマルチファクター・コンセンサス・システムです。独自のインジケーターと最適化されたアルゴリズムを単一の高度なコンセンサス・ベクトルに統合し、それを単一のインジケーター・インスタンス内で現在足と上位足のスタックにわたって読み取ります。複数のチャートにばらばらのツールを積み重ねる代わりに、です。 これは Oracle コンセンサス手法
GEM Signal Pro GEM Signal Pro は、MetaTrader 5 向けのトレンドフォロー型インジケーターです。より明確なシグナル、より整理されたトレードセットアップ、そして実用的なリスク管理をチャート上で確認したいトレーダーのために設計されています。 単純な矢印だけを表示するのではなく、GEM Signal Pro はトレード全体の考え方を、より見やすく分かりやすい形で表示します。条件が確認されると、インジケーターはエントリー価格、ストップロス、利確目標をチャート上に表示し、トレードセットアップをより効率的に確認できるようにします。 動作の仕組み このインジケーターは、まず内部ロジックに基づいて有効なシードシグナルを検出します。 確認条件が満たされると、GEM Signal Pro はチャート上に完全なセットアップを表示します。これにより、トレーダーはトレード構造をより明確に把握し、手作業による分析を減らすことができます。 チャート上のトレードレベル 確認済みシグナルに対して、GEM Signal Pro は以下を表示できます。 エントリー価格
ストップロス
テ
ARIPoint is a powerful trading companion designed to generate high-probability entry signals with dynamic TP/SL/DP levels based on volatility. Built-in performance tracking shows win/loss stats, PP1/PP2 hits, and success rates all updated live. Key Features: Buy/Sell signals with adaptive volatility bands Real-time TP/SL/DP levels based on ATR Built-in MA Filter with optional ATR/StdDev volatility Performance stats panel (Success, Profit/Loss, PP1/PP2) Alerts via popup, sound, push, or email Cu
FX Power: 通貨の強弱を分析して、より賢い取引を実現 概要
FX Power は主要通貨と金の実際の強弱をあらゆる市場状況で理解するための必須ツールです。強い通貨を買い、弱い通貨を売ることで、 FX Power は取引の意思決定を簡素化し、高い確率の取引機会を見出します。トレンドを追従する場合でも、極端なデルタ値を使用して反転を予測する場合でも、このツールはあなたの取引スタイルに完全に適応します。ただ取引するだけではなく、 FX Power で賢く取引をしましょう。
1. なぜ FX Power がトレーダーにとって非常に有益なのか 通貨と金のリアルタイム強弱分析
• FX Power は主要通貨と金の相対的な強弱を計算し、マーケットダイナミクスに関する明確な洞察を提供します。
• どの資産がリードしているか、または後れを取っているかを監視して、取引するペアを賢く選びましょう。 マルチタイムフレームの包括的なビュー
• 短期、中期、長期のタイムフレームで通貨と金の強弱を追跡し、マーケットトレンドに基づいて取引戦略を調整できます。
• スキャルピングからスイングトレード
KURAMA GOLD SIGNAL PRO(MT5版)— 7層フィルター・自動TP/SL・品質スコア・サイン履歴保存搭載 XAUUSD完全トレードシステム
リアルタイムでリペイントしません。サインが出た瞬間、矢印・エントリー・TP・SLはその場で固定され、後から動きません。あなたがトレードするのは、この「リアルタイムで出たサイン」です。さらにv7.20では、実際に通知されたサインを自動保存し、再起動後もそのまま復元します。
購入者限定特典 買い切りライセンスをご購入いただいた方に、AI Zone Radar($59相当)+完全PDFマニュアルを無料プレゼント。本体価格に$59相当の特典が付いてきます。購入後にMQL5でメッセージをお送りください。 AI Zone Radar: https://www.mql5.com/en/market/product/175834
ゴールドトレーダーのコミュニティで実際に使用され、精度と使いやすさで高く評価されています。
あな
BTMM State Engine Pro is a MetaTrader 5 indicator for traders who use the Beat The Market Maker approach: Asian session context, kill zone timing, level progression, peak formation detection, and a multi-pair scanner from a single chart. It combines cycle state logic with a built-in scanner dashboard so you do not need the same tool on many charts at once.
What it does
Draws the Asian session range; session times can follow broker server offset or be set in inputs. Tracks level progression (L
Crystal Heikin Ashi Signals - Professional Trend & Signal Detection Indicator Advanced Heikin Ashi Visualization with Intelligent Signal System for Manual & Automated Trading
Final Price: $149 ---------> Price goes up $10 after every 10 sales .
Limited slots available — act fast .
Overview Crystal Heikin Ashi Signals is a professional-grade MetaTrader 5 indicator that combines pure Heikin Ashi candle visualization with an advanced momentum-shift detection system. Designed for both manual traders
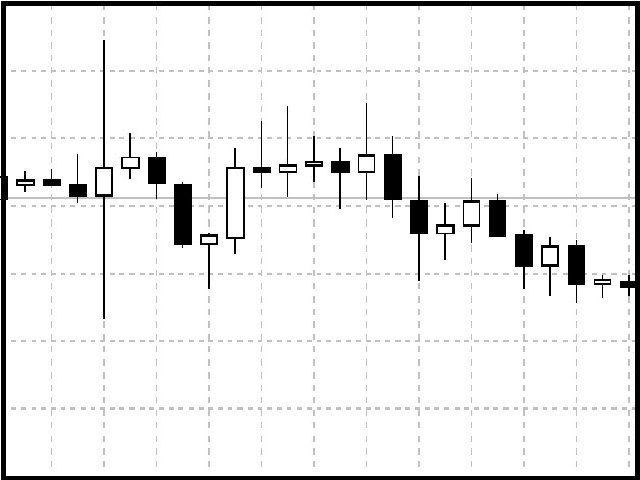
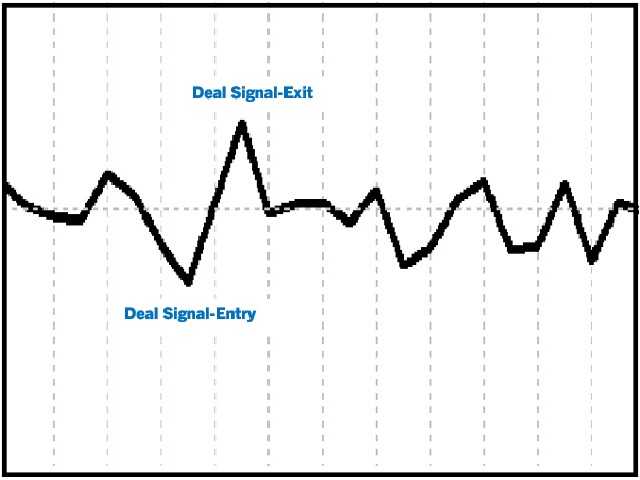
A very Simple Indicator for experienced and professional traders. It indicates direction of trade and provides signals of best deals. Signal is referred here a point on chart where indicator line turns its direction or converges. This indicator finds underlaying trading asset trade direction and indicates best scenarios of trade as described in screenshots. Where it has run for a period of time and converges to best deal scenarios.
Have a Look!
A Good , Easy , Readable and handy indicator for experienced and professional traders. It gives bounded signals between zero and one. Easy for investors to comprehend. It gives near and longer trading outlook to investors and helps them to find good opportunities. Indicator gives zero signal on price downturns and signal value equals to one on price upturns. Once again a new type of indicator and rangebound between zero and one .
A value indicator. It is helping tool to indicate the direction of value gain. A best helping tool to trade value. This indicator is equipped with a colored line and a digital tool to indicate value numerically .
This indicator also helps to indicate value during trends. A study based on this indicator shows value of trade significantly changes during trends best tool to chase the trends.
A basic tool for experienced and professional traders to trade percentile of the value. It indicates both values in the form of digits appeared on the left corner of the screen.
Instructions Manual : First choose your desired symbol and then select this tool. Please be remined that this tool is just a helping tool. its upon trader what he desired so. The function of this tool is just to provide a help in trading.
A technical Indicator Providing Price Convergence Signals along with value for experienced and professional traders. Easy to comprehend, Easy to understand.
This is a helping tool provides best signals. This indicator is designed based on the fundamentals of trade. A very good indicator you can customized its color. A best tool to find trade direction.
An adaptive indicator. It constantly adapts to the trade.
A very good indicator for Experienced and Professional Traders. A practical approach to trading. Easy to understand. A helping tool for traders looking for price movements .
Signals: Signal Number 1: When yellow line which is a signal line crossing the zero line towards downward direction is a selling opportunity. Signal Number 2:
When yellow line which is a signal line crossing the zero line towards upward direction is a buying opportunity.
A Good , Easy , Readable and handy indicator for experienced and professional traders. It gives bounded signals between zero and one. Easy for investors to comprehend. It gives near and longer trading outlook to investors and helps them to find good opportunities. Indicator gives zero signal on price downturns and signal value equals to one on price upturns. Once again a new type of indicator and rangebound between zero and one .
Sales Sales for seasonal traders.A new type of indicator for Professional and Experienced Traders. Specifically designed for trend identification. A great tool for investors to invest at the right and suitable time for decent trading. You can present it to your potential clients and customers for their satisfaction. A very handy and trendy tool. Easy to read , comprehend and user friendly. By this tool you can easily identify the potential to enter in trading and low potential to exit.
It c
A technical Indicator Providing Price Convergence Signals along with value for experienced and professional traders. Easy to comprehend, Easy to understand.
This is a helping tool provides best signals. This indicator is designed based on the fundamentals of trade. A very good indicator you can customized its color. A best tool to find trade direction.
An adaptive indicator. It constantly adapts to the trade.
A value indicator for experienced and professional traders. It is helping tool to indicate the direction value gain. A best helping tool to trade value. This indicator is equipped with a colored line and a digital tool to indicate value numerically .
This indicator also helps to indicate value during trends. A study based on this indicator shows value of trade significantly changes during trends best tool to cash the trends.
Best helping tool for Professional and Experienced traders. A best Tool To find the trend. Instruction Manual: First Select your desired Symbol. Then attach this tool and wait till it identify the trend for you. Then it will be more feasible to trade.
Once again best tool to trade. Demo version is available you can fully test its functionality. More importantly there are always trend breaks Once Trend break is observed un-attach this tool and then re-attach to get the fresh trend. Precautions:
A basic tool for traders to trade percentile of the value. It indicates both values in the for of digits appeared on the left corner of the screen.
Instructions Manual : First choose your desired symbol and then select this tool. Please be remined that this tool is just a helping tool. its upon trader what he desired so. The function of this tool is just to provide a help in trading.
A very good indicator for experienced and professional traders . A practical approach to trading. Easy to understand. A helping tool for traders looking for price movements .
Signals: Signal Number 1: When yellow line which is a signal line crossing the zero line towards downward direction is a selling opportunity. Signal Number 2:
When yellow line which is a signal line crossing the zero line towards upward direction is a buying opportunity.