TRI Visualizer MT5 – Thermodynamic Market Analysis Overview
The TRI (Thermal Range Indicator) Visualizer Enhanced is a rare market analysis indicator that goes beyond conventional technical analysis, applying principles of thermodynamics from physics. It interprets market price fluctuations as “thermodynamic energy,” enabling the highly accurate detection of subtle market changes that are often overlooked. Innovative Mechanisms 1. Dual Calculation Engines Classic TRI Mode Formula: |Close
Noize Absorption Index - is the manual trading system that measures the difference of pressure between bears forces and bulls forces. Green line - is a noize free index that showing curent situation. Zero value of index shows totally choppy/flat market.Values above zero level shows how powerfull bullish wave is and values below zero measures bearish forces.Up arrow appears on bearish market when it's ready to reverse, dn arrow appears on weak bullish market, as a result of reverse expectation.
Overview Heiken Ashi CE Filtered MT5 is a technical indicator for the MetaTrader 5 platform. It integrates smoothed candlestick charting with a dynamic exit strategy and a customizable trend filter to deliver clear buy and sell signals. The indicator is designed to improve trend detection and signal reliability by reducing market noise. If you want to see more high-quality products or order the development/conversion of your own products, visit my partners' website: 4xDev
Get 10% OFF on manual
Premium level is a unique indicator with more than 80% accuracy of correct predictions!
This indicator has been tested for more than two months by the best Trading Specialists!
The author's indicator you will not find anywhere else!
From the screenshots you can see for yourself the accuracy of this tool!
1 is great for trading binary options with an expiration time of 1 candle.
2 works on all currency pairs, stocks, commodities, cryptocurrencies
Instructions:
As soon as the red arrow app
RBreaker Gold Indicators는 금 선물을 위한 단기 데이 트레이딩 전략으로, 추세 추종과 데이 내 반전의 두 가지 거래 방식을 결합합니다. 추세 장에서 수익을 포착할 수 있을 뿐만 아니라, 시장이 반전될 때 적시에 이익을 확정하고 추세에 맞춰 반대 포지션을 잡을 수 있습니다.
이 전략은 미국 잡지 Futures Truth에서 15년 연속으로 가장 수익성 높은 트레이딩 전략 상위 10위 안에 선정되었습니다. 긴 라이프사이클을 자랑하며, 현재까지 국내외에서 널리 사용되고 연구되고 있습니다.
본 지표는 2026년 금 선물의 움직임을 반영하여 14일 ATR 지표를 기반으로 돌파 계수 A, 관찰 계수 B, 반전 계수 R을 보다 합리적인 값으로 정의했습니다. 매우 훌륭한 지표이며, 안정적인 연간 수익성을 달성했습니다. 강력히 추천합니다~
위 지표는 변동성이 높은 상품에 적합하며, 매개변수는 금 선물, 주가 지수 선물 등에 적합합니다. 다른 상품이 필요한 경우 돌파 계수 A
CosmiCLab SMC FIBO CosmiCLab SMC FIBO is a professional trading indicator designed for traders who use Smart Money Concepts (SMC), market structure analysis and Fibonacci retracement levels. The indicator automatically detects market swings and builds Fibonacci levels based on the latest impulse movement.
It also identifies market structure changes such as BOS (Break of Structure) and CHOCH (Change of Character), helping traders understand the current market direction. CosmiCLab SMC FIBO also pr
Improved version of the free HMA Trend indicator (for MetaTrader 4) with statistical analysis. HMA Trend is a trend indicator based on the Hull Moving Average (HMA) with two periods. HMA with a slow period identifies the trend, while HMA with a fast period determines the short-term movements and signals in the trend direction.
The main differences from the free version: Ability to predict the probability of a trend reversal using analysis of history data. Plotting statistical charts for analyzi
Korean 이 보조지표는 차트 패턴 거래를 즐기는 트레이더를 위한 고급 차트 분석 비서 역할을 합니다. 시각적 분석의 부담을 줄이고 수익 창출의 정확성을 높이도록 설계되었습니다. 실제 사용 관점에서 본 이 보조지표의 주요 장점과 특징입니다: 1. 자동 패턴 감지 (Automated Pattern Detection) 시간 절약 및 편향(Bias) 감소: 수동으로 추세선을 그릴 필요가 없습니다. 인디케이터가 가격 스윙(Pivot High/Low)을 검색하고 가격 구조가 조건에 부합할 때 라이징 웨지(Rising Wedge, 상승 쐐기형) 및 폴링 웨지(Falling Wedge, 하락 쐐기형) 구조를 자동으로 그립니다. 모든 상황 포괄: 패턴이 형성되는 중, 브레이크아웃(돌파), 심지어 실패한 패턴까지 감지할 수 있어 시장의 전반적인 흐름을 명확하게 파악할 수 있습니다. 2. 내장된 목표가 및 피보나치 익절 (Built-in Targets & Fibonacci TP) 자동 목표가 계산:
SMC Venom Model BPR 지표는 Smart Money(SMC) 개념 내에서 일하는 트레이더를 위한 전문 도구입니다. 가격 차트에서 두 가지 주요 패턴을 자동으로 식별합니다. FVG (공정 가치 갭)는 3개의 캔들의 조합으로, 첫 번째와 세 번째 캔들 사이에 갭이 있습니다. 이는 볼륨 지원이 없는 레벨 사이에 구역을 형성하여 종종 가격 수정으로 이어집니다. BPR (균형 가격 범위)은 두 개의 FVG 패턴의 조합으로, "브리지"를 형성합니다. 이는 가격이 낮은 볼륨 활동으로 움직일 때 브레이크아웃과 레벨로의 복귀 구역으로, 캔들 사이에 갭을 생성합니다.
이러한 패턴은 거래자가 차트에서 거래량과 가격 역학을 분석하여 주요 지지/저항 수준, 돌파 구역 및 진입 지점을 식별하는 데 도움이 되며, 여기서 대형 시장 참여자와 일반 참여자 간의 상호 작용이 발생합니다. 이 지표는 사각형과 화살표 형태로 패턴을 시각화하며 유연한 경고 설정도 지원합니다.
주요 특징:
패턴 표시 모드
Binary Options Assistant (BOA) Multi Currency Dashboard for Binary Options (MT5) .
You can use any of the BOA Signals Indicators with the dashboard. Just change the BOA Signals Indicator Name in the dashboard settings to the indicator you want to get signals from. For example: CHILL. BLAZE: BOA_BLAZE_Indicator_v1 Strategy : BLW Online Trading Binary Options Strategy (3 Moving Average)
LAVA: BOA_LAVA_Indicator_v1 Strategy: Lady Trader Binary Options Strategy (Bollinger Bands & Stochas
Was: $249 Now: $99 Market Profile defines a number of day types that can help the trader to determine market behaviour. A key feature is the Value Area, representing the range of price action where 70% of trading took place. Understanding the Value Area can give traders valuable insight into market direction and establish the higher odds trade. It is an excellent addition to any system you may be using. Inspired by Jim Dalton’s book “Mind Over Markets”, this indicator is designed to suit the
Price Magnet — Price Density and Attraction Levels Indicator Price Magnet is a professional analytical tool designed to identify key support and resistance levels based on statistical Price Density. The indicator analyzes a specified historical period and detects price levels where the market spent the most time. These zones act as “magnets,” attracting price action or forming a structural base for potential reversals. Unlike traditional Volume Profile tools, Price Magnet focuses on price-time d
No Demand No Supply This indicator identifies No Demand –No Supply candles to your chart and plots volume bars colored according to the signal. It can be applied to all timeframes or to a specific one only. It can also be used as regular volume indicator with exceptional future of WEIGHTED VOLUME. Furthermore is has an alert notification, sound and email when a signals occurs. The indicator does not repaint but the alert will come on two candles back due to the definition of No Demand No Su
Advanced Lot & Profit Monitor PRO is a powerful MT5 indicator that provides real-time monitoring of your trading positions directly on the chart. It displays the number of orders, total lot sizes, and profit (including swap) for Buy and Sell positions separately, as well as the overall account performance. Designed with a clean and customizable interface, this tool helps traders stay in control of their exposure and risk at all times. Key Features: Real-time monitoring of open positions Sepa
This indicator is used to compare the relative strength of the trade on the chart against the other several selected symbols.
By comparing the price movement of each traded variety based on the same base day, several trend lines of different directions can be seen, reflecting the strong and weak relationship between the several different traded varieties, so that we can have a clearer understanding of the market trend. For example, you can apply this indicator on a EurUSD chart and compare it w
Step into the world of Forex trading with confidence, clarity, and precision using Gold Indicator a next-generation tool engineered to take your trading performance to the next level. Whether you’re a seasoned professional or just beginning your journey in the currency markets, Gold Indicator equips you with powerful insights and help you trade smarter, not harder. Built on the proven synergy of three advanced indicators, Gold Indicator focuses exclusively on medium and long-term trends elimina
DYJ BoS 지표는 다음을 포함하여 시장 구조 변화의 필수 요소를 자동으로 식별하고 표시합니다.
구조 돌파(BoS): 가격이 크게 움직여 이전 구조 지점을 돌파할 때 감지됩니다.
상승 추세선과 하락 추세선(UP & DN, 즉 연속적인 신고가와 신저가)을 표시하고, 가격이 이러한 선을 돌파하면 빨간색(BEAR)과 초록색(BULL) 화살표를 표시합니다.
BoS는 일반적으로 가격이 이전 가격 움직임에 의해 확립된 스윙 저점이나 스윙 고점을 확실히 통과할 때 발생합니다. 가격이 스윙 하이보다 높거나 스윙 로우보다 낮게 움직일 경우, 이는 단순히 이전에 형성된 시장 구조를 깨는 것이므로 "브레이크아웃" 구조라고 합니다. 이는 종종 시장 심리와 추세 방향의 변화를 나타내며, 기존 추세가 지속되거나 새로운 추세가 시작됨을 알립니다.
일반적으로 마감 정확도를 높이기 위해 손절매와 이익실현을 설정하지 않는 것이 좋습니다. 최종 포지션은 일반적으로 같은 방향의 다음 돌파점에서 마감되거나 반
ADVANCED FUNCTIONALITIES: Trend Score (0-100) with visual bar Intelligent signals with adjustable strength (1-10) Risk management with automatic TP/SL Audible and visual alerts Price zones with smooth filling Multi-indicator analysis (RSI, ATR, BB, EMAs) DESIGN FEATURES Modern Visual: Smooth and well-spaced lines (EMA with 2-3px width) Vibrant and professional colors (Sky Blue, Orange, Gold) Modern arrows (code 233/234) for buy/sell signals Configurable dark/light theme Adjustable transparency f
Multi Timeframe Smc Bias Finder Trading in alignment with higher timeframe structure is one of the most consistently profitable habits a trader can build. The difficulty has always been execution: switching between timeframes, manually reading structure, and keeping track of whether the Daily, 4-Hour and 1-Hour are all pointing in the same direction before committing to a position. Multi Timeframe Smc Bias Finder resolves that entirely. Three tools in one indicator: A live multi-timeframe bias d
평면 및 추세를 결정하기 위한 표시기. 가격이 2개의 히스토그램과 2개의 선(빨간색 및 파란색) 중 하나보다 낮으면 판매 영역입니다. 이 버전의 표시기를 구매할 때 하나의 실제 계정과 하나의 데모 계정에 대한 MT4 버전 - 선물로(수신하려면 개인 메시지를 작성하세요)! 가격이 2개의 히스토그램과 2개의 선(빨간색 및 파란색) 중 하나보다 높으면 구매 영역입니다. MT4 버전: https://www.mql5.com/en/market/product/3793 가격이 두 라인 사이 또는 히스토그램 영역에 있으면 시장에 명확한 추세가 없습니다. 간단히 말해서 시장은 평평합니다. 표시기의 작업은 스크린샷에 더 명확하게 표시됩니다. 지표는 선행 데이터를 얻는 데 사용할 수 있습니다. 또는 현재 추세의 상태를 확인합니다.
Laguerre SuperTrend Clouds adds an Adaptive Laguerre averaging algorithm and alerts to the widely popular SuperTrend indicator. As the name suggests, Laguerre SuperTrend Clouds (LSC) is a trending indicator which works best in trendy (not choppy) markets. The SuperTrend is an extremely popular indicator for intraday and daily trading, and can be used on any timeframe. Incorporating Laguerre's equation to this can facilitate more robust trend detection and smoother filters. The LSC uses the
# DRAWDOWN INDICATOR V4.0 - The Essential Tool to Master Your Trading
## Transform Your Trading with a Complete Real-Time Performance Overview
In the demanding world of Forex and CFD trading, **knowing your real-time performance** isn't a luxury—it's an **absolute necessity**. The **Drawdown Indicator V4.0** is much more than a simple indicator: it's your **professional dashboard** that gives you a clear, precise, and instant view of your trading account status.
---
## Why This Indicator
Divergent Stochastic Filter II Catch Reversals Early, Filter Noise, Trade with Confidence The Edge: Why This Stochastic is Different Every trader knows the Stochastic oscillator. But knowing when to trust its signals, that's the real challenge. The Divergent Stochastic Filter II transforms this classic indicator into a precision reversal detection system by adding critical elements: divergence intelligence, signal filtering and exhaustion detection. While standard Stochastic oscillators fire s
Trade smarter, not harder: Empower your trading with Harmonacci Patterns This is arguably the most complete harmonic price formation auto-recognition indicator you can find for the MetaTrader Platform. It detects 19 different patterns, takes fibonacci projections as seriously as you do, displays the Potential Reversal Zone (PRZ) and finds suitable stop-loss and take-profit levels. [ Installation Guide | Update Guide | Troubleshooting | FAQ | All Products ]
It detects 19 different harmonic pric
Crash 1000 Scalping Indicator for the Crash 1000 Deriv Synthetic Index. Introduction The Crash 1000 Scalping Indicator is a specialized tool designed for the Crash 1000 index on the Deriv Synthetic market. This indicator is particularly useful for scalping on the M1 timeframe, helping traders to identify precise entry and exit points for buy positions. It is designed to be non-repainting, providing clear signals with audible alerts and push notifications, and is compatible with mobile devices th
WaveTrend Oscillator MT5는 모멘텀 변화와 잠재적인 추세 반전을 식별하여 시장 분석을 향상시키기 위해 설계된 강력한 거래 지표입니다. 모든 수준의 트레이더에게 이상적인 이 도구는 forex, 암호화폐 및 상품을 포함한 다양한 시장에서 과매수 및 과매도 조건에 대한 귀중한 통찰력을 제공합니다. 정확한 매수 및 매도 신호를 생성할 수 있는 능력을 갖춘 WaveTrend Oscillator MT5는 트레이더가 정보에 기반한 결정을 내릴 수 있도록 하여 단기 및 장기 거래 전략 모두에서 성공 확률을 효과적으로 높입니다. MQL 제품 설치 가이드 | MT4/MT5에서 구매한 MQL 제품 업데이트 | 일반 문제 해결 가이드 | 지표 설정 / 가이드 주요 기능 버퍼 통합: 신호 기반 거래 전략을 활용할 수 있도록 지표 값을 접근 가능한 버퍼로 노출합니다. 빠르고 백테스트 가능: MetaTrader의 기본 OnCalculate() 엔진을 기반으로 구축되어 빠른 계산과 전략 테스터
Fibo Daily Channel Indicator The Indicator is a powerful tool for traders, providing precise daily support and resistance levels based on Fibonacci retracement and extension calculations. This indicator automatically draws key pivot points (PP, R1, R2, S1, S2) as well as additional extension levels (R3, R4, S3, S4), helping traders identify potential reversal and breakout zones with ease. It includes customizable alerts and push notifications, allowing traders to receive updates whenever the pr
CyberTradeTHxAI Gold Sniper MT5 Professional Gold Trading Signal Indicator for MetaTrader 5 CyberTradeTHxAI Gold Sniper MT5 is a professional-grade Gold (XAUUSD) trading indicator developed to identify high-probability Buy and Sell opportunities using trend analysis, pullback confirmation, and intelligent market structure detection. Designed for both beginner and advanced traders, the indicator automatically calculates optimal Entry Zones, Stop Loss, and multiple Take Profit levels while provid
Potential Reversal Price (PRP) Indicator - Ultimate Sniper Entries for XAUUSD Discounted Price !! Secure your lifetime access now before it switches to subscription-only ! Welcome to the Potential Reversal Price (PRP) Indicator , your ultimate trading tool designed to catch high-probability market reversals with extreme precision. Built for serious traders who demand accuracy, the PRP Indicator combines advanced market structure analysis with momentum exhaustion to pinpoint the exa
Master Edition은 거래량과 자금 흐름의 관점을 통해 시장 구조를 시각화하도록 설계된 전문가급 분석 도구입니다. 표준 거래량 지표와 달리, 이 도구는 차트에 일일 거래량 프로필을 직접 표시하여 가격 발견이 발생한 위치와 "스마트 머니"가 위치한 곳을 정확하게 볼 수 있게 합니다. 이 Master Edition은 명확성과 속도를 위해 설계되었으며, 로드 시 차트 레이아웃을 즉시 아름답게 만드는 독특한 자동 테마 동기화 시스템을 특징으로 합니다. 주요 기능: 진정한 자금 흐름 계산: 표준 틱 거래량을 넘어섭니다. "Use Money Flow"를 활성화하면 거래량이 가격에 따라 가중치가 부여되어 특정 가격 수준에서의 실제 자본 투입을 드러냅니다. 가치 영역(VA) 시각화: 가치 영역(기본값: 거래량의 70%)을 자동으로 계산합니다. VA Fill: 통제 구역을 즉시 식별하기 위해 가치 영역 배경을 음영 처리합니다. 주요 수준: 통제점(POC), 가치 영역 고점(VAH), 가치 영
Neuro Poseidon is a new indicator by Daria Rezueva. It combines precise trading signals with adaptive TP/SL levels - creating best possible trades as a result!
Message me and get Neuro Poseidon Assistant as a gift to automize your trading process!
What makes it stand out?
1. Proven profitability on all assets and timeframes
2. Only confirmed BUY and SELL signals present on the chart
3. Adaptive TP & SL levels generated by the software for each trade
4. Easy to understand - suitable for al
SuperScalp Pro – 전문 멀티 레이어 컨플루언스 스캘핑 시스템 SuperScalp Pro는 지능형 다중 요소 확인 시스템을 통해 높은 확률의 거래 기회를 식별하도록 설계된 전문적인 다중 컨플루언스 트레이딩 시스템입니다. Supertrend, VWAP, EMA, RSI, ADX, 거래량 분석, 볼린저 밴드 및 MACD 다이버전스를 통합하여 저품질 신호를 필터링하고, 가짜 돌파 신호를 줄이며, 진입 정확도를 향상시킵니다. XAUUSD, BTCUSD 및 주요 Forex 통화쌍에 특별히 최적화된 SuperScalp Pro는 ATR 기반 변동성 로직과 규칙 기반 신호 검증을 통해 변화하는 시장 환경에 적응하며, M1부터 H4까지 다양한 시간대에서 일관되고 객관적인 거래 확인 신호를 제공합니다. 내장된 스마트 제어 패널을 통해 실시간으로 완전한 사용자 설정이 가능하며, 트레이더는 개별 확인 필터를 활성화하거나 비활성화하여 다양한 시장 환경, 거래 스타일 및 위험 선호도에 맞게 시스템
먼저 솔직하게 말하겠습니다.
어떤 인디케이터도 단독으로 당신을 수익성 있게 만들어주지 않습니다. 누군가 그렇게 말한다면, 그는 당신에게 꿈을 파는 것입니다. 완벽한 매수/매도 화살표를 보여주는 모든 인디케이터는 완벽하게 보이도록 만들 수 있습니다 — 단지 올바른 과거 구간을 확대하고 승리한 거래만 캡처하면 됩니다. 우리는 그렇게 하지 않습니다. SMC Intraday Formula는 도구입니다. 시장 구조를 읽고, 가장 높은 확률의 가격 구간을 표시하며, 현재 스마트 머니의 흐름이 어떻게 보이는지 아주 단순한 언어로 보여줍니다. 최종 결정은 여전히 당신이 합니다. 실행도 당신이 합니다. 하지만 이제는 희망이 아니라 정확성으로 거래하게 됩니다. 우리는 이 인디케이터를 지난 약 3년 동안 골드(XAUUSD) 및 주요 외환 통화쌍의 데이 트레이딩 스캘핑에 사용해 왔습니다. M1, M5, M15, M30에서 우리의 핵심 도구입니다. 이 도구는 미래를 예측하려 하지 않습니다 — 지금 형성
이 지표를 구매하신 분께는 다음과 같은 혜택이 무료로 제공됩니다:
각 거래를 자동으로 관리하고, 손절/익절 수준을 설정하며, 전략 규칙에 따라 거래를 종료하는 전용 도우미 툴 "Bomber Utility" 다양한 자산에 맞게 지표를 설정할 수 있는 셋업 파일(Set Files) "최소 위험", "균형 잡힌 위험", "관망 전략" 모드로 설정 가능한 Bomber Utility의 셋업 파일 이 전략을 빠르게 설치, 설정, 시작할 수 있도록 돕는 단계별 영상 매뉴얼 주의: 위의 모든 보너스를 받기 위해서는 MQL5 개인 메시지 시스템을 통해 판매자에게 연락해 주세요. 독창적인 커스텀 지표인 “Divergence Bomber(다이버전스 봄버)”를 소개합니다. 이 지표는 MACD 다이버전스(괴리) 전략을 기반으로 한 올인원(All-in-One) 거래 시스템입니다.
이 기술 지표의 주요 목적은 가격과 MACD 지표 간의 다이버전스를 감지하고, **향후 가격이 어느 방향으로 움직일지를 알려주는
Gann Made Easy 는 mr.의 이론을 사용하여 최고의 거래 원칙을 기반으로 하는 전문적이고 사용하기 쉬운 Forex 거래 시스템입니다. W.D. 간. 이 표시기는 Stop Loss 및 Take Profit Levels를 포함하여 정확한 BUY 및 SELL 신호를 제공합니다. PUSH 알림을 사용하여 이동 중에도 거래할 수 있습니다. 구매 후 거래 방법 안내 및 유용한 추가 지표를 무료로 받으시려면 저에게 연락주세요! 아마도 Gann 거래 방법에 대해 이미 여러 번 들었을 것입니다. 일반적으로 Gann의 이론은 초보자 거래자뿐만 아니라 이미 거래 경험이 있는 사람들에게도 매우 복잡한 것입니다. Gann의 거래 방식은 이론적으로 적용하기 쉽지 않기 때문입니다. 나는 그 지식을 연마하고 Forex 지표에 최고의 원칙을 적용하기 위해 몇 년을 보냈습니다. 표시기는 적용하기가 매우 쉽습니다. 차트에 첨부하고 간단한 거래 권장 사항을 따르기만 하면 됩니다. 지표는 지속적으로 시장 분석
Entry In The Zone and SMC Multi Timeframe is a real-time 2-in-1 market analysis tool that combines market structure analysis and a No Repaint BUY / SELL signal system into a single indicator, built on Smart Money Concepts (SMC) — a widely adopted framework used by professional traders to understand market structure. This indicator helps you see the market more clearly, make decisions based on structure rather than guesswork, and focus on high-probability zones where price is more likely to react
PrimeScalping is a powerful trading companion designed to generate high-probability entry signals with dynamic TP/SL/DP levels based on volatility. Built-in performance tracking shows win/loss stats, PP1/PP2 hits, and success rates — all updated live.
Key Features: Buy/Sell signals with adaptive volatility bands Real-time TP/SL/DP levels based on ATR Built-in MA Filter with optional ATR/StdDev volatility Performance stats panel (Success, Profit/Loss, PP1/PP2) Alerts via popup, sound, push, or e
이 제품은 2026년 시장에 맞게 업데이트되었으며 최신 MT5 빌드에 최적화되었습니다. 가격 업데이트 안내:
Smart Trend Trading System은 현재 $99 에 제공됩니다.
다음 30회 구매 후 가격은 $199 로 인상됩니다. 특별 혜택: Smart Trend Trading System 구매 후 저에게 개인 메시지를 보내시면 Smart Universal EA를 무료 로 받을 수 있으며, Smart Trend 신호를 자동 거래로 전환할 수 있습니다. Smart Trend Trading System은 리페인트 없음, 재그리기 없음, 지연 없음의 완전한 트레이딩 시스템으로, 더 깨끗한 신호, 더 나은 추세 방향, 그리고 더 체계적인 시장 거래 방식을 원하는 트레이더를 위해 제작되었습니다. Online course , manual and [download presets] . 이 시스템은 추세 감지, 반전 구간, Smart Cloud, 트레일링 스톱 로직, 지지와 저항, 캔들
개발자 공지: 149달러 가격의 라이선스가 2 개만 남아 있습니다. 해당 라이선스가 판매되면 가격은 169달러 로 인상됩니다. M1 Quantum 은 M1 전용 전문 트레이딩 시스템으로, 손절(Stop Loss), 익절(Take Profit), 그리고 스마트 자금 관리 기능이 내장된 빠르고 정확한 거래 신호를 제공합니다. M1 Quantum 은 연속 수익 거래 에 집중하여 계좌를 빠르게 성장시키도록 설계된 전문 자금 관리 시스템을 포함하고 있습니다. M1 Quantum 인디케이터 의 주요 기능 M1 타임프레임 및 모든 주요 통화쌍 용으로 설계됨 모든 거래에 손절과 익절 적용 자금 관리 시스템 이 포함되어 트레이더가 쉽게 거래할 수 있도록 안내 높은 승률 및 높은 연속 수익률 리페인트 없음, 지연 없음 모든 트레이더가 쉽게 이해 가능 M1 Quantum 을 사용하려면 M1 Quantum Assistant 가 필요합니다. 이 강력한 도구는 모든 M1 Quantum 구매자에게 무료로 제
소개 Quantum Breakout PRO , 브레이크아웃 존 거래 방식을 변화시키는 획기적인 MQL5 지표! 13년 이상의 거래 경험을 가진 숙련된 트레이더 팀이 개발한 퀀텀 브레이크아웃 PRO 혁신적이고 역동적인 브레이크아웃 존 전략으로 거래 여정을 새로운 차원으로 끌어올리도록 설계되었습니다.
Quantum Breakout Indicator는 5개의 이익 목표 영역이 있는 브레이크아웃 영역의 신호 화살표와 브레이크아웃 상자를 기반으로 한 손절 제안을 제공합니다.
초보자 거래자와 전문 거래자 모두에게 적합합니다.
Quantum EA 채널: 여기를 클릭하세요
중요한! 구매 후 설치 매뉴얼을 받으려면 개인 메시지를 보내주십시오. 추천:
기간: M15 통화쌍: GBPJPY, EURJPY, USDJPY,NZDUSD, XAUUSD 계정 유형: 스프레드가 매우 낮은 ECN, Raw 또는 Razor 브로커 시간: GMT +3 중개인 :
Power Candles V3 - 자체 최적화 강도 지표 파워 캔들 V3는 적용된 모든 차트에서 통화 및 상품의 강세를 실행 가능한 거래 계획으로 전환합니다. 단순히 캔들에 색상을 입히는 대신, 백그라운드에서 실시간 자동 최적화를 수행하여 현재 보고 있는 종목에 대한 최적의 손절매, 익절 및 신호 임계값을 제공합니다. 한 번의 클릭으로 실시간 거래에 적용할 수 있으며, 진입점, 손절매 및 익절 선이 정확한 가격에 맞춰 차트에 표시되고, 방향과 함께 알림이 발령됩니다. 이 도구는 Stein Investments 에코시스템의 일부입니다. 18개 이상의 도구와 함께 당신의 1대1 AI 트레이딩 멘토 Max.
항상 대기 중, 모든 인디케이터를 깊이 있게 이해, 무언가를 차근차근 생각해보고 싶은 순간에 도움을 줍니다. https://stein.investments 에서 만나보세요
매 종가 바마다 3,000회 이상의 트레이딩 시뮬레이션. 9가지 강도 상태. 2가지 전략을 병렬로 테스트.
이 제품은 2026년 시장에 맞게 업데이트되었으며 최신 MT5 빌드에 최적화되었습니다. 가격 업데이트 안내:
Atomic Analyst는 현재 $99 에 제공됩니다.
다음 30회 구매 후 가격은 $199 로 인상됩니다. 특별 혜택: Atomic Analyst 구매 후 저에게 개인 메시지를 보내시면 Smart Universal EA를 무료 로 받을 수 있으며, Atomic Analyst 신호를 자동 거래로 전환할 수 있습니다. Atomic Analyst는 리페인트 없음, 재그리기 없음, 지연 없음의 Price Action 거래 인디케이터로, 수동 거래, 신호 명확성, EA 자동화를 위해 설계되었습니다. User manual: settings, inputs and strategy. & User Manual PDF . 가격 움직임, 강도, 모멘텀, 다중 시간대 방향 및 고급 필터를 분석하여 트레이더가 노이즈를 줄이고 약한 세팅을 피하며 더 체계적인 거래 결정을 내릴 수 있도록
트렌드 캐처 인디케이터
트렌드 캐처 인디케이터는 개발자가 자체 개발한 맞춤형 적응형 트렌드 분석 지표들을 조합하여 시장 가격 움직임을 분석합니다. 단기적인 노이즈를 제거하고 근본적인 모멘텀 강도, 변동성 확대, 가격 구조 움직임에 집중하여 진정한 시장 방향을 파악합니다. 또한 이동 평균, RSI, 변동성 필터와 같은 맞춤형 지표들을 활용하여 가격을 평활화하고 트렌드를 필터링합니다.
실제 운영 모니터링 및 기타 제품은 다음 링크에서 확인하실 수 있습니다: https://www.mql5.com/en/users/mechanic/seller
텔레그램에서는 EA나 설정 파일을 판매하지 않습니다. 사기이니 주의하세요. 모든 설정 파일은 블로그에서 무료로 제공됩니다. 중요! 구매 후 즉시 연락 주시면 사용 방법 및 보너스를 드립니다!
이 지표는 시장에서 관심이 나타나는 영역 을 강조 표시한 후, 주문이 누적되는 영역 을 보여줍니다.
이는 **대규모 오더북(호가창)**처럼 작동합니다.
이것은 거대한 자금 을 위한 인디케이터입니다. 성능은 탁월하며,
시장에서 어떤 관심이 있든 반드시 포착할 수 있습니다 . (이것은 완전히 새로 작성되고 자동화된 버전 입니다 – 이제 수동 분석은 필요하지 않습니다.)
**거래 속도(Transaction Speed)**는 새로운 개념의 인디케이터로,
시장에 대규모 주문이 언제, 어디에 쌓이는지를 보여주며 , 그 이점을 분석합니다.
매우 초기 단계에서 트렌드 전환 을 감지할 수 있습니다.
FX 시장에서 흔히 사용하는 "거래량(volume)"은 오해입니다. 실제로는 시간당 가격 변화량 이므로, 올바른 용어는 거래 속도 입니다.
우리가 어떻게 사고하고, 행동하며, 분석하느냐 가 가장 중요합니다.
분석 패러다임의 전환 은 필수적입니다.
이 인디케이터는 외환 시장에서의 볼륨 개념을 논리적으로
UZFX {SSS} 스캘핑 스마트 시그널 v4.0 MT5는 급변하는 시장에서 정확한 실시간 시그널을 필요로 하는 스캘퍼, 데이 트레이더, 스윙 트레이더를 위해 설계된 리페인팅이 없는 고성능 트레이딩 지표입니다. (UZFX-LABS)에서 개발한 이 지표는 가격 움직임 분석, 추세 확인 및 스마트 필터링을 결합하여 모든 통화 쌍과 시간대에서 높은 확률의 매수 및 매도 신호, 경고 신호, 추세 지속 기회를 생성합니다.
거래에 대한 의구심을 떨쳐버리고, 명확성, 정밀성, 그리고 규율 있는 시장 실행을 원하는 트레이더를 위해 설계된 체계적인 신호 시스템을 따르기 시작하세요. 제 추천* 최적의 시간대: 15분 이상. {H1}이 제가 가장 선호하는 시간대입니다. 그리고 그 결과는 정말 놀라울 정도입니다...!!
주요 기능 업데이트
• 자동 매수 및 매도 신호 감지 • 고급 반전 인식 로직 • 잠재적인 시장 반전 전 조기 경고 신호 • 추세 지속 확인 신호 • 진입, 손절, TP1, TP2,
GoldenX Entry는 MT5용 인디케이터로, 적응형 Smart Entry Trend 알고리즘, 신호 스코어링 시스템, 시장 레짐 감지 기능, 그리고 변동성 필터를 포함합니다. 각 신호에는 계산된 진입 레벨, 3개의 익절(TP1, TP2, TP3) 레벨, 그리고 손절(Stop-Loss) 레벨이 포함됩니다. 이 인디케이터는 다양한 시장 환경에 적응하도록 설계된 다중 분석 레이어 구조 위에 구축되어 있으며, 내장 최적화기와 통계 추적 시스템을 결합합니다. 또한 Risk-to-Reward(RR) 지표와 과거 거래 행동 기반의 정량 분석을 제공합니다. 시작은 간단합니다 — 선택한 타임프레임에서 최적화기를 실행한 뒤 차트에서 바로 인디케이터를 사용하면 됩니다. 핵심 기능
GoldenX Entry는 하나의 차트에서 신호 엔진, 트레이드 관리 기능, 그리고 과거 통계 추적을 통합합니다: - 내장 최적화기: 최적화기는 차트에서 원클릭으로 실행됩니다. 200개의 파라미터 조합을 두 단계 탐색
SuperTrend , RSI , Stochastic 의 힘을 하나의 포괄적인 지표로 결합하여 트레이딩 잠재력을 극대화하는 궁극의 트레이딩 도구 인 Quantum TrendPulse를 소개합니다. 정밀성과 효율성을 추구하는 트레이더를 위해 설계된 이 지표는 시장 추세, 모멘텀 변화, 최적의 진입 및 종료 지점을 자신 있게 식별하는 데 도움이 됩니다. 주요 특징: SuperTrend 통합: 주요 시장 추세를 쉽게 따라가고 수익성의 물결을 타세요. RSI 정밀도: 매수 과다 및 매도 과다 수준을 감지하여 시장 반전 시점을 파악하는 데 적합하며 SuperTrend 필터로 사용 가능 확률적 정확도: 변동성이 큰 시장에서 숨겨진 기회를 찾기 위해 확률적 진동 을 활용하고 SuperTrend의 필터로 사용 다중 시간대 분석: M5부터 H1 또는 H4까지 다양한 시간대에 걸쳐 시장을 최신 상태로 유지하세요. 맞춤형 알림: 맞춤형 거래 조건이 충족되면
FX Trend NG: 차세대 멀티 마켓 트렌드 인텔리전스 개요
FX Trend NG 는 다중 시간 프레임 기반의 전문 트렌드 분석 및 시장 모니터링 도구입니다. 몇 초 만에 전체 시장 구조를 파악할 수 있도록 설계되었습니다. 여러 차트를 일일이 전환할 필요 없이, 어떤 종목이 추세에 있는지, 어디에서 모멘텀이 약화되고 있는지, 그리고 어떤 시간 프레임이 서로 정렬되어 있는지 즉시 확인할 수 있습니다. 출시 기념 특별 혜택 – FX Trend NG 를 $30 (6개월) 또는 $80 평생 라이선스 로 이용할 수 있습니다. 이미 Stein Investments 고객이신가요? -> 메시지를 보내 전용 고객 그룹에 참여하세요. 설정이나 사용 방법이 필요하신가요? -> Stein Investments 공식 페이지 를 방문하세요. 1. FX Trend NG가 특별한 이유 3단계 추세 로직 – 단순한 Buy / Sell이 아닙니다
• 대부분의 지표는 Buy 또는 Sell 두 가지 상태만 제
이 제품은 2026년 시장에 맞게 업데이트되었으며 최신 MT5 빌드에 최적화되었습니다. 가격 업데이트 안내:
Smart Price Action Concepts는 현재 $200 에 제공됩니다.
다음 30회 구매 후 가격은 $299 로 인상됩니다. 특별 혜택: 구매 후 저에게 개인 메시지를 보내시면 무료 보너스 + 선물 을 받을 수 있습니다. 먼저, 이 트레이딩 도구는 리페인트 없음, 재그리기 없음, 지연 없음의 인디케이터이므로 전문적인 트레이딩에 적합하다는 점을 강조하고 싶습니다. Online course , and manual Smart Price Action Concepts Indicator는 초보자와 경험 많은 트레이더 모두에게 매우 강력한 도구입니다. 20개 이상의 유용한 인디케이터를 하나로 결합하고, Inner Circle Trader Analysis와 Smart Money Concepts Trading Strategies 같은 고급 트레이딩 아이디어를 통합합니다. 이 인디
GEM Signal Pro GEM Signal Pro는 MetaTrader 5용 추세추종형 지표로, 차트에서 더 명확한 신호, 더 구조적인 트레이드 설정, 그리고 더 실용적인 리스크 관리를 원하는 트레이더를 위해 설계되었습니다. 단순한 화살표만 표시하는 것이 아니라, GEM Signal Pro는 전체 트레이드 아이디어를 더 깔끔하고 읽기 쉬운 방식으로 보여줍니다. 조건이 확인되면 진입가, 손절가, 목표가를 차트에 표시하여 트레이더가 설정을 더 효율적으로 검토할 수 있도록 도와줍니다. 작동 방식 이 지표는 먼저 내부 로직에 따라 유효한 초기 신호를 식별합니다. 확인 조건이 충족되면, GEM Signal Pro는 차트에 전체 설정을 표시합니다. 이를 통해 트레이더는 거래 구조를 더 명확하게 보고, 수동 분석 작업을 줄일 수 있습니다. 차트에 표시되는 거래 레벨 확인된 신호에 대해, GEM Signal Pro는 다음을 표시할 수 있습니다. 진입가
손절가
목표가 1
목표가 2
목표가 3
손
Trend Sniper X — 개요 Trend Sniper X 는 EMA 필터와 결합된 HTF SuperTrend 엔진을 기반으로 하는 MetaTrader 5용 멀티 타임프레임 추세 추종 지표입니다. 상위 타임프레임의 추세 방향에 따라 현재 타임프레임의 캔들 색상을 변경하고 추세 전환 지점을 BUY/SELL 화살표로 표시합니다. 가격 정보: 현재 가격은 프로모션 가격이며 향후 업데이트 및 새로운 기능 출시 시 변경될 수 있습니다. Code2Profit 채널 멀티 타임프레임 분석으로 시장을 마스터하세요! 기술 사양 플랫폼 MetaTrader 5 지표 유형 멀티 타임프레임 추세 캔들 (SuperTrend 기반) 신호 소스 HTF SuperTrend (ATR 기반) + HTF EMA 필터 작동 타임프레임 독립적으로 선택 가능한 상위 타임프레임(M1~MN1)을 지원하는 모든 차트 타임프레임 주요 상품 외환(Forex), 골드(XAUUSD) 및 기타 CFD 권장 계좌 모든 계좌 유형
The Oracle Pro: Synthetic Multi-Timeframe Bias Engine for MT5 ️ Summer Launch Offer — Get The Oracle Pro for USD 199 (early buyers). Price rises with traction; final price USD 399. The Oracle Pro is a premium multi-timeframe bias engine for MetaTrader 5, built for demanding and professional traders. It answers one question with discipline: what is the directional bias on each timeframe right now, how strong is it, and how much do the timeframes agree? Everything is computed on closed bars only
ARIPoint is a powerful trading companion designed to generate high-probability entry signals with dynamic TP/SL/DP levels based on volatility. Built-in performance tracking shows win/loss stats, PP1/PP2 hits, and success rates all updated live. Key Features: Buy/Sell signals with adaptive volatility bands Real-time TP/SL/DP levels based on ATR Built-in MA Filter with optional ATR/StdDev volatility Performance stats panel (Success, Profit/Loss, PP1/PP2) Alerts via popup, sound, push, or email Cu
Crystal Heikin Ashi Signals - Professional Trend & Signal Detection Indicator Advanced Heikin Ashi Visualization with Intelligent Signal System for Manual & Automated Trading
Final Price: $149 ---------> Price goes up $10 after every 10 sales .
Limited slots available — act fast .
Overview Crystal Heikin Ashi Signals is a professional-grade MetaTrader 5 indicator that combines pure Heikin Ashi candle visualization with an advanced momentum-shift detection system. Designed for both manual traders
안녕하세요, 트레이더 여러분!
많은 개인 투자자들이 느린 웹 스크립트에 의존하고 있습니다. 수익성 있는 거래를 위해서는 체계적인 프레임워크가 필수적입니다.
Astro AI 지표는 단순한 차트 오버레이가 아닙니다. 터미널에서 직접 실행되는 두 개의 에이전트로 구성된 정교한 신경망입니다.
시스템 기술 상세 설명:
1. 에이전트 1: 분석가 (그래픽 신경망 – GNN)
시장은 개별 가격 막대로 이루어진 것이 아니라 상호 연결된 데이터 네트워크입니다.
기능: 에이전트 1은 그래픽 신경망을 사용하여 이러한 복잡하고 비선형적인 관계를 파악합니다.
장점: 기존 지표는 과거 이동 평균만을 고려하는 반면, 저희 GNN은 시장의 심층적인 구조적 관계를 실시간으로 처리하여 개별 트레이더의 거래량이 시장에 큰 영향을 미치기 전에 숨겨진 상관관계를 찾아냅니다.
2. 에이전트 2: 실행기 (근접 전략 최적화 – PPO)
패턴 인식은 절반의 성공일 뿐입니다. 현재 시장 변동에 기반하여 올바른
탁월한 기술적 지표인 Grabber를 소개합니다. 이 도구는 즉시 사용 가능한 “올인원(All-Inclusive)” 트레이딩 전략으로 작동합니다.
하나의 코드 안에 강력한 시장 기술 분석 도구, 매매 신호(화살표), 알림 기능, 푸시 알림이 통합되어 있습니다. 이 인디케이터를 구매하신 모든 분들께는 다음의 항목이 무료로 제공됩니다: Grabber 유틸리티: 오픈 포지션을 자동으로 관리하는 도구 단계별 영상 매뉴얼: 설치, 설정, 그리고 실제 거래 방법을 안내 맞춤형 세트 파일: 인디케이터를 빠르게 자동 설정하여 최고의 성과를 낼 수 있도록 도와줍니다 다른 전략은 이제 잊어버리세요! Grabber만이 여러분을 새로운 트레이딩의 정점으로 이끌어 줄 수 있습니다. Grabber 전략의 주요 특징: 거래 시간 프레임: M5부터 H4까지 거래 가능한 자산: 어떤 자산이든 사용 가능하지만, 제가 직접 테스트한 종목들을 추천드립니다 (GBPUSD, GBPCAD, GBPCHF, AUDCAD, AU
Azimuth Pro V2: Synthetic Fractal Structure and Confirmed Entries for MT5 Overview Azimuth Pro is a multi-level swing structure indicator by Merkava Labs . Four nested swing layers, swing-anchored VWAP, ABC pattern detection, three-timeframe structural filtering, and closed-bar confirmed entries — one chart, one workflow from micro-swings to macro-cycles. This is not a blind signal product. It is a structure-first workflow for traders who care about location, context, and timing. ️ Summer Sale
SmartScalping is a powerful trading companion designed to generate high-probability entry signals with dynamic TP/SL/DP levels based on volatility. Built-in performance tracking shows win/loss stats, PP1/PP2 hits, and success rates — all updated live.
Key Features: Buy/Sell signals with adaptive volatility bands Real-time TP/SL/DP levels based on ATR Built-in MA Filter with optional ATR/StdDev volatility Performance stats panel (Success, Profit/Loss, PP1/PP2) Alerts via popup, sound, push, or e
ScalpPoint is a powerful trading companion designed to generate high-probability entry signals with dynamic TP/SL/DP levels based on volatility. Built-in performance tracking shows win/loss stats, PP1/PP2 hits, and success rates — all updated live. Key Features: Buy/Sell signals with adaptive volatility bands Real-time TP/SL/DP levels based on ATR Built-in MA Filter with optional ATR/StdDev volatility Performance stats panel (Success, Profit/Loss, PP1/PP2) Alerts via popup, sound, push, or emai
BTMM State Engine Pro is a MetaTrader 5 indicator for traders who use the Beat The Market Maker approach: Asian session context, kill zone timing, level progression, peak formation detection, and a multi-pair scanner from a single chart. It combines cycle state logic with a built-in scanner dashboard so you do not need the same tool on many charts at once.
What it does
Draws the Asian session range; session times can follow broker server offset or be set in inputs. Tracks level progression (L
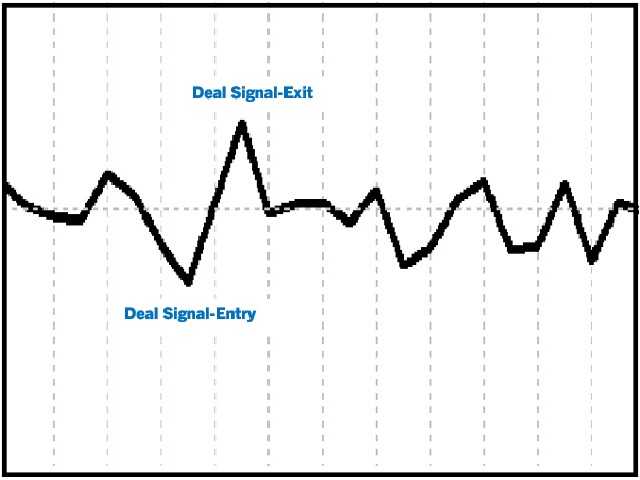
A very Simple Indicator for experienced and professional traders. It indicates direction of trade and provides signals of best deals. Signal is referred here a point on chart where indicator line turns its direction or converges. This indicator finds underlaying trading asset trade direction and indicates best scenarios of trade as described in screenshots. Where it has run for a period of time and converges to best deal scenarios.
Have a Look!
A Good , Easy , Readable and handy indicator for experienced and professional traders. It gives bounded signals between zero and one. Easy for investors to comprehend. It gives near and longer trading outlook to investors and helps them to find good opportunities. Indicator gives zero signal on price downturns and signal value equals to one on price upturns. Once again a new type of indicator and rangebound between zero and one .
A value indicator. It is helping tool to indicate the direction of value gain. A best helping tool to trade value. This indicator is equipped with a colored line and a digital tool to indicate value numerically .
This indicator also helps to indicate value during trends. A study based on this indicator shows value of trade significantly changes during trends best tool to chase the trends.
A basic tool for experienced and professional traders to trade percentile of the value. It indicates both values in the form of digits appeared on the left corner of the screen.
Instructions Manual : First choose your desired symbol and then select this tool. Please be remined that this tool is just a helping tool. its upon trader what he desired so. The function of this tool is just to provide a help in trading.
A technical Indicator Providing Price Convergence Signals along with value for experienced and professional traders. Easy to comprehend, Easy to understand.
This is a helping tool provides best signals. This indicator is designed based on the fundamentals of trade. A very good indicator you can customized its color. A best tool to find trade direction.
An adaptive indicator. It constantly adapts to the trade.
A very good indicator for Experienced and Professional Traders. A practical approach to trading. Easy to understand. A helping tool for traders looking for price movements .
Signals: Signal Number 1: When yellow line which is a signal line crossing the zero line towards downward direction is a selling opportunity. Signal Number 2:
When yellow line which is a signal line crossing the zero line towards upward direction is a buying opportunity.
A Good , Easy , Readable and handy indicator for experienced and professional traders. It gives bounded signals between zero and one. Easy for investors to comprehend. It gives near and longer trading outlook to investors and helps them to find good opportunities. Indicator gives zero signal on price downturns and signal value equals to one on price upturns. Once again a new type of indicator and rangebound between zero and one .
Sales Sales for seasonal traders.A new type of indicator for Professional and Experienced Traders. Specifically designed for trend identification. A great tool for investors to invest at the right and suitable time for decent trading. You can present it to your potential clients and customers for their satisfaction. A very handy and trendy tool. Easy to read , comprehend and user friendly. By this tool you can easily identify the potential to enter in trading and low potential to exit.
It c
A technical Indicator Providing Price Convergence Signals along with value for experienced and professional traders. Easy to comprehend, Easy to understand.
This is a helping tool provides best signals. This indicator is designed based on the fundamentals of trade. A very good indicator you can customized its color. A best tool to find trade direction.
An adaptive indicator. It constantly adapts to the trade.
A value indicator for experienced and professional traders. It is helping tool to indicate the direction value gain. A best helping tool to trade value. This indicator is equipped with a colored line and a digital tool to indicate value numerically .
This indicator also helps to indicate value during trends. A study based on this indicator shows value of trade significantly changes during trends best tool to cash the trends.
Best helping tool for Professional and Experienced traders. A best Tool To find the trend. Instruction Manual: First Select your desired Symbol. Then attach this tool and wait till it identify the trend for you. Then it will be more feasible to trade.
Once again best tool to trade. Demo version is available you can fully test its functionality. More importantly there are always trend breaks Once Trend break is observed un-attach this tool and then re-attach to get the fresh trend. Precautions:
A basic tool for traders to trade percentile of the value. It indicates both values in the for of digits appeared on the left corner of the screen.
Instructions Manual : First choose your desired symbol and then select this tool. Please be remined that this tool is just a helping tool. its upon trader what he desired so. The function of this tool is just to provide a help in trading.
A very good indicator for experienced and professional traders . A practical approach to trading. Easy to understand. A helping tool for traders looking for price movements .
Signals: Signal Number 1: When yellow line which is a signal line crossing the zero line towards downward direction is a selling opportunity. Signal Number 2:
When yellow line which is a signal line crossing the zero line towards upward direction is a buying opportunity.