Trend Complete

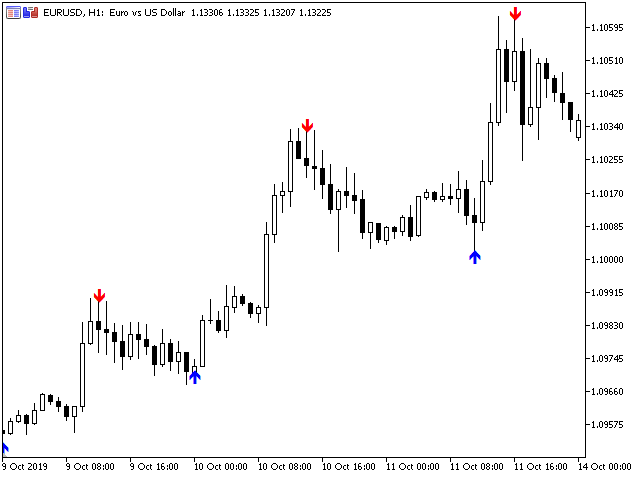
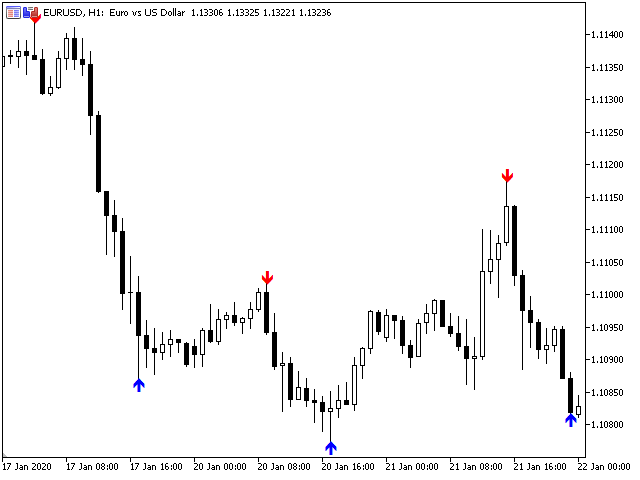
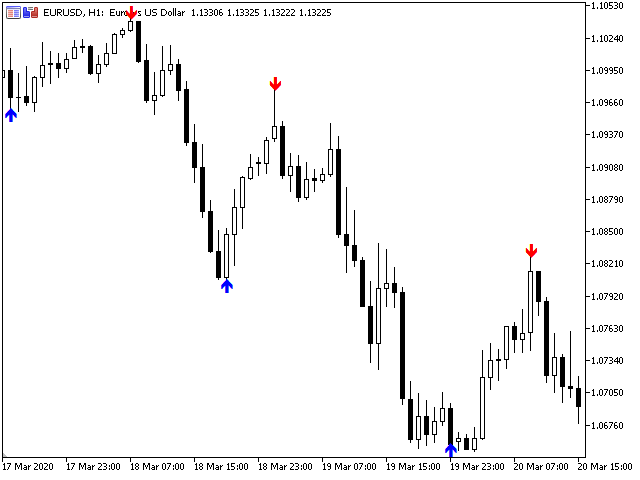
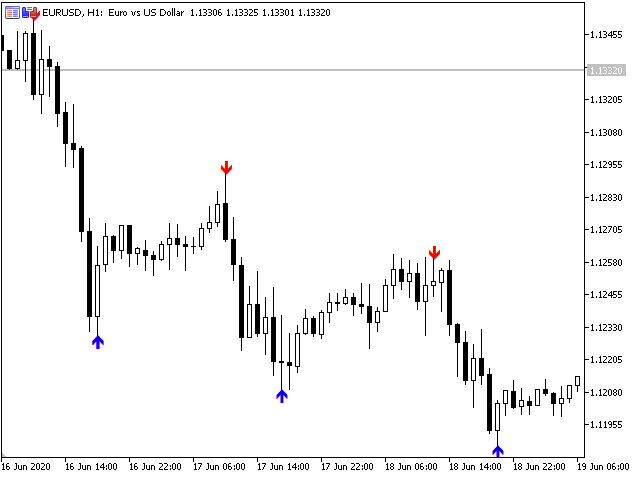
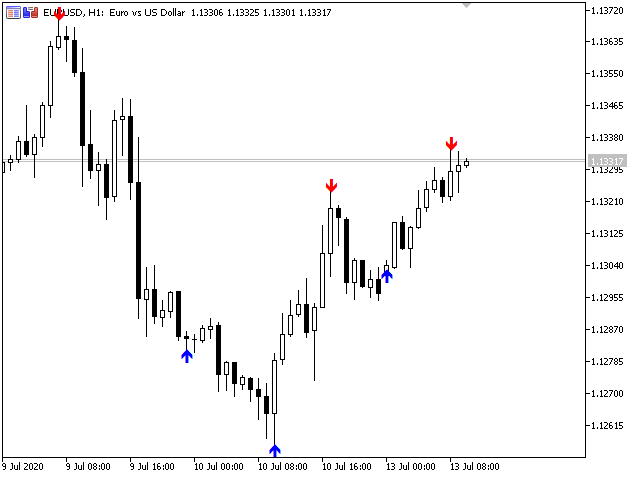
The Trend Complete indicator is a signal indicator and has interesting properties. It should be taken into account that this indicator reflects extremes and should be used as an additional one, and another instrument should be used for the entry point. Searches for and displays pivot points on the price chart. Trend indicators are one of the main tools for analyzing trends in the Forex market. The indicator is able to transmit all types of signals to the user: messages, E-mail and Push!

The goal that was pursued when it was created is to receive signals that will give less noise and respond faster to price changes. The Fixed Trend indicator is a trend indicator that is used to find reversals when its boundaries are broken.
推荐产品
Price Magnet — Price Density and Attraction Levels Indicator Price Magnet is a professional analytical tool designed to identify key support and resistance levels based on statistical Price Density. The indicator analyzes a specified historical period and detects price levels where the market spent the most time. These zones act as “magnets,” attracting price action or forming a structural base for potential reversals. Unlike traditional Volume Profile tools, Price Magnet focuses on price-time d
RBreaker
Zhong Long Wu
RBreaker Gold Indicators 是黄金期货一种短线日内交易策略,它结合了趋势跟踪和日内反转两种交易方式,既能捕捉趋势行情的利润,又能在行情反转时及时止盈并顺势反手。 该策略曾连续15年被美国《Futures Truth》杂志评选为前十大最赚钱的交易策略之一,具有很长的生命周期,至今仍在国内外普遍使用与研究。 本指标结合了2026年期货黄金的走势,依据14日ATR指标,分别定义了突破系数A,观察系数B,反转系数R更合理的数值,非常不错的指标,已实现年稳定盈利,值得推荐~ 以上指标适合高波动品种,参数适合期货黄金,股指期货等,如果需要其他品种行情,需要单独设定 突破系数A,观察系数B,反转系数R,进行回测才能使用。 欢迎指标售后有问题可以加+V:504282029
CosmiCLab FIBO
Kirils Subins
CosmiCLab SMC FIBO CosmiCLab SMC FIBO is a professional trading indicator designed for traders who use Smart Money Concepts (SMC), market structure analysis and Fibonacci retracement levels. The indicator automatically detects market swings and builds Fibonacci levels based on the latest impulse movement. It also identifies market structure changes such as BOS (Break of Structure) and CHOCH (Change of Character), helping traders understand the current market direction. CosmiCLab SMC FIBO also pr
Chỉ báo này sẽ thông báo cho bạn nếu cấu hình xu hướng thành công. Tín hiệu theo xu hướng không nên được tăng theo, nhưng tín hiệu mua ở mức giá thấp theo mô hình giao dịch thông thường của bạn, hoặc tín hiệu bán ở mức giá tốt, là một lựa chọn rất tốt. Hãy thiết lập nó trên khung thời gian lớn hơn và theo dõi các khung thời gian nhỏ hơn, bám sát các xu hướng chính. Tôi thường thiết lập ba khung thời gian gần nhau nhất và không bao giờ đi ngược tín hiệu của INdicator này. INdicator   này không có
The Super Arrow Indicator provides non-repainting buy and sell signals with exceptional accuracy. Key Features No repainting – confirmed signals remain fixed Clear visual arrows: green for buy, red for sell Real-time alerts via pop-up, sound, and optional email Clean chart view with no unnecessary clutter Works on all markets: Forex, gold, oil, indices, crypto Adjustable Parameters TimeFrame Default:   "current time frame" Function:   Sets the time frame for indicator calculation Options:   Can
Automated Trendlines MT5
Georgios Kalomoiropoulos
趋势线是外汇交易中最重要的技术分析工具。不幸的是,大多数交易者没有正确绘制它们。自动趋势线指标是专业交易者的专业工具,可帮助您可视化市场的趋势运动。 有两种类型的趋势线看涨趋势线和看跌趋势线。 在上升趋势中,外汇趋势线是通过价格变动的最低摆动点绘制的。 连接至少两个“最低点”将创建一条趋势线。 在下跌趋势中,趋势线是通过价格走势的最高摆动点绘制的。 连接至少两个“最高点”将创建一条趋势线。 趋势线何时突破? 当看跌蜡烛收于看涨​​趋势线下方并且蜡烛的高点在趋势线上方时,看涨趋势线会被打破。 当看涨蜡烛收于看跌趋势线上方并且蜡烛的低点低于趋势线时,看跌趋势线会被打破。 趋势线何时删除? 当一根完整的蜡烛在看涨趋势线下方形成时,看涨趋势线将被删除。 当完整的蜡烛在看跌趋势线上方形成时,看跌趋势线将被删除。 您可以从输入参数更改看涨和看跌趋势线的颜色和宽度。
Prime Power ML
Artem Koliada
Prime Power ML 是一款先进的货币强度指标,内置两个 ONNX 神经网络模型,在显示信号前先按胜率进行过滤。与传统 CSM 指标显示所有货币背离不同,Prime Power ML 只显示 AI 确认具有统计优势的信号。 工作原理 指标通过对所有 28 个货币对进行 RSI 评分,实时计算 8 种主要货币(USD、EUR、GBP、JPY、AUD、CAD、CHF、NZD)的强度。当两种货币之间出现强度背离时,内置 AI 模型评估 14 个市场特征并为信号分配 Win Probability 分数(0-100%)。 只有满足最低阈值的信号才会显示为 AI TOP SIGNALS — 当前图表上按置信度排序的两个最佳机会。 两个 AI 模型 — 匹配您的时间框架 指标根据图表时间框架自动检测使用哪个模型: 模式 时间框架 训练数据 样本外 Win Rate INTRADAY M1, M5, M15, M30 69,000+ 信号 BUY 56.3% / SELL 62.3% 阈值 0.55 SWING H1, H4, D1 16,000+ 信号 BUY 54.0% / SELL 5
MercariaPattern1-2-3 відстежує рух ціни, знаходить трьоххвильові структури 1-2-3 та підсвічує момент, коли сценарій підтверджується пробоєм ключового рівня. MercariaPattern1-2-3 tracks price movement, detects three-leg 1-2-3 structures and highlights the moment when the scenario is confirmed by a key level breakout. Індикатор збирає локальні свінги в компактну фігуру 0–1–2–3 , чекає підтвердженого пробою та будує стрілку входу з готовими рівнями SL/TP. The indicator combines local swings into a
Multi-Timeframe Money Flow Index (MTF MFI) with Smart Divergence and Dashboard Unlock the flow of institutional money across every timeframe. Are you tired of guessing the trend only to be trapped by a sudden reversal? The Multi-Timeframe Money Flow Index (MTF MFI) is a professional-grade trading tool designed to provide a bird's-eye view of market liquidity and momentum. By aggregating volume-weighted data from W1 down to M1, this indicator eliminates noise and highlights high-probability tra
ATrend
Zaha Feiz
4.83 (18)
ATREND: 工作原理及使用方法 工作原理 “ATREND”指标针对MT5平台设计,旨在通过结合多种技术分析方法为交易者提供强有力的买卖信号。该指标主要利用平均真实波幅(ATR)来测量波动性,并结合趋势检测算法来识别潜在的市场动向。 购买后请留言,您将获得特别的赠品。 主要特点: - 动态趋势检测:该指标评估市场趋势并相应调整信号,帮助交易者与当前市场条件对齐策略。 - 波动性测量:通过使用ATR,该指标衡量市场波动性,这对于确定最佳止损(SL)和止盈(TP)水平至关重要。 - 信号可视化:该指标在图表上直观地表示买卖信号,增强交易者的决策能力。 操作步骤 输入和设置: - 时间框架:此输入允许您设置指标计算的主要时间框架,默认值为15分钟。 - 时间框架2:此输入可用于定义额外分析的辅助时间框架,默认值为1分钟。 - 移动:此参数允许您将指标的计算向回移动,默认值为0。 - SLATR:此输入定义用于根据ATR计算止损水平的乘数,默认值为2.56。 - TPATR:此输入定义用于根据ATR计算止盈水平的乘数,默认值也为2.56。 - AlertsOn:启用或禁用交易信号的警报,
Terra Infinity
Ivan Simonika
Terra Infinity is a flat indicator. This improved version of the CalcFlat indicator has three additional lines that significantly increase its effectiveness. Unlike its predecessor with two static levels, Terra Infinity adds three dynamic lines above the main histogram, which are interpreted as follows: base signal line, minimum signal line, maximum signal line. These lines are formed using the additional parameter Avg, which is the average value of the histogram. Averaging produces a line cl
Double HMA MTF for MT5
Pavel Zamoshnikov
4 (4)
This is an advanced multi-timeframe version of the popular Hull Moving Average (HMA) Features Two lines of the Hull indicator of different timeframes on the same chart. The HMA line of the higher timeframe defines the trend, and the HMA line of the current timeframe defines the short-term price movements. A graphical panel with HMA indicator data from all timeframes at the same time . If the HMA switched its direction on any timeframe, the panel displays a question or exclamation mark with a tex
可以说,这是您可以为MetaTrader平台找到的最完整的谐波价格形成自动识别指标。它检测19种不同的模式,像您一样认真对待斐波那契投影,显示潜在的反转区域(PRZ),并找到合适的止损和获利水平。 [ 安装指南 | 更新指南 | 故障排除 | 常见问题 | 所有产品 ] 它检测19种不同的谐波价格形态 它绘制了主要,衍生和互补的斐波那契投影(PRZ) 它评估过去的价格走势并显示每个过去的形态 该指标分析其自身的质量和性能 它显示合适的止损和获利水平 它使用突破来表明合适的交易 它在图表上绘制所有样式比率 它实现了电子邮件/声音/视觉警报 受斯科特·M·卡尼(Scott M. Carney)的书的启发,该指标旨在满足最纯粹和最熟练的交易者的需求。但是,它采取了一种使交易更容易的方式:在向交易发出信号之前,它会等待Donchian朝正确方向突破,从而使交易信号非常可靠。 斐波那契投影与向量无关 它实现了电子邮件/声音/推送警报 它绘制了ABCD投影 重要提示: 为了符合 Scott M. Carney先生 的商标申诉,某些图案名称已重命名为不言自明的替代方式, Scott M.
This trading indicator is non-repainting, non-redrawing, and non-lagging, making it an ideal choice for both manual and automated trading. It is a Price Action–based system that leverages price strength and momentum to give traders a real edge in the market. With advanced filtering techniques to eliminate noise and false signals, it enhances trading accuracy and potential. By combining multiple layers of sophisticated algorithms, the indicator scans the chart in real-time and translates comple
Renko System
Marco Montemari
This indicator can be considered as a trading system. It offers a different view to see the currency pair: full timeless indicator, can be used for manual trading or for automatized trading with some expert advisor. When the price reaches a threshold a new block is created according to the set mode. The indicator beside the Renko bars, shows also 3 moving averages. Features renko mode median renko custom median renko 3 moving averages wicks datetime indicator for each block custom notification
Gekko RSI Plus
Rodrigo Galeote
This is Gekko's Cutomized Relative Strength Index (RSI), a customized version of the famous RSI indicator. Use the regular RSI and take advantage two entry signals calculations and different ways of being alerted whenever there is potential entry or exit point. Inputs Period: Period for the RSI calculation; How will the indicator calculate entry (swing) signals: 1- Produces Exit Signals for Swings based on RSI entering and leaving Upper and Lower Levels Zones; 2- Produces Entry/Exit Signals for
Maximum Trend Arrows OT MT5
Mulweli Valdaz Makulana
STRICTLY FOR BOOM INDEX ONLY!!!!! Here I bring the Maximum Trend Arrows OT1.0 MT5 indicator. This indicator is made up of a combination of different trend indicators for entries and exits, for entries an orange arrow will paint on the chart below the current market and a red flag for closing of trades and it produces buy arrows only. When the orange arrow appears, it will appear along with it's sound to notify you. The 1H timeframe is recommended, don't use it anywhere else than on the 1H timefr
Hunter trend
Yaroslav Varankin
Hunter Trend: Arrow Indicator for Binary Options Trading Hunter Trend is an arrow indicator designed for trading binary options (turbo options) on the M1 timeframe, allowing for short-term trading opportunities. How to Trade with this Tool: Signals may appear when a candlestick forms. Once such a signal appears, wait for the closure of that candlestick. Upon the opening of a new candlestick, open a trade for 1-2 candlesticks in the indicated direction. In this case, for 1-2 minutes. A blue dot
KasTon Trend System: The Complete 2-in-1 Trading Strategy Identify the Trend, Confirm the Signal, and Trade with Confidence! Do you suffer from confusion while trading? Do you find it difficult to determine the market's direction? Are you tired of losing money on false signals? The KasTon Trend System is here as an integrated solution to all these problems. This is not just an indicator; it is a complete trading strategy built on the synergy of two powerful, custom-built indicators. Our main g
SMC Venom 模型 BPR 指標是針對在智慧貨幣 (SMC) 概念內工作的交易者的專業工具。它會自動辨識價格圖表上的兩種關鍵模式: FVG (公平價值缺口)是三根蠟燭的組合,其中第一根和第三根蠟燭之間存在缺口。它在水平之間形成一個沒有成交量支撐的區域,這通常會導致價格調整。 BPR (平衡價格區間)是兩種 FVG 模式的組合,形成一個「橋樑」 - 當價格以低成交量活動移動時,突破並返回到水平的區域,從而在蠟燭之間產生間隙。 這些模式可協助交易者透過分析圖表上的交易量和價格動態(大型市場參與者和普通參與者之間的互動)來識別關鍵的支撐/阻力位、突破區域和切入點。 此指標以矩形和箭頭的形式可視化模式,也支援靈活的警報設定。 主要特點: 模式顯示模式:選擇顯示 BPR 模式(看漲和看跌)或 FVG 模式(看漲和看跌)。 可以隱藏所有圖表分析模式。 以條數過濾:BPR 結構中 FVG 之間的最小/最大距離。 訊號的附加視覺化: 箭頭有 9 種類型可供選擇(標準、細、分形等)或手動輸入 Wingdings 代碼,其表格可以選擇性地顯示在圖表上。 設定顏色、尺寸及其縮放時相對於價格的動態
Market Overview MT5
Mehran Sepah Mansoor
使用我们的市场强度和情绪指标优化您的交易决策,不再逆势交易! 我们的指标专为重视准确及时信息的严肃交易者精心设计,以非常简单的方式提供 28 种主要货币对的鸟瞰图。该工具可根据货币对的受欢迎程度、看涨或看跌趋势的强度以及买方和卖方的百分比 (MT4 版本) 对货币对进行排名。 功能特点 实时趋势强度: 准确评估每种货币对的趋势强度,为识别交易机会提供可靠指导。 买卖双方分析: 通过我们对每种货币对的买卖双方实力排名,即时洞察市场动态,让您预测重要走势。 交易者兴趣: 获取每种货币对的交易者兴趣和活动数据,帮助您更好地了解新兴趋势和潜在转折点。 直观且可定制的仪表盘: 我们的仪表板易于使用,您可以根据自己的喜好自定义显示,让您对相关信息一目了然。 实时更新: 实时更新让您随时了解市场变化,确保您不会错过任何有利可图的机会。 指标栏 Symbol:  点击此栏,符号将按字母顺序排序。 Popularity:  点击此栏,将按照交易者对该交易货币对的兴趣顺序进行排序。 Strength:  点击此栏,货币对将按照趋势排序(正数表示上升趋势,负数表示下降趋势)。 Buyer/Se
CosmiCLab METEORIT — SMC Fibo ZigZag CosmiCLab METEORIT is a professional Smart Money Concepts indicator designed for traders who want to identify institutional market movements. The indicator combines market structure analysis, liquidity sweeps, automatic Fibonacci levels and a smart ZigZag engine to help traders detect high-probability trading zones. It is designed for intraday trading on M15 and H1 , but also works well on other timeframes. Key Features Smart ZigZag market structure engine
Description CAP Channel & Hull Moving Average Crossing Strategy is a powerful and smart trading indicator designed to identify high-probability market reversals and trend-based entry points . This indicator combines the strength of the CAP Channel and the Hull Moving Average (HMA) to detect price overextension and confirmation-based reversals . When price moves outside the CAP Channel and then returns inside with Hull MA confirmation, the indicator generates accurate BUY and SELL signals . Core
RSI 布林带箭头策略 (RSI Bollinger Bands Arrow Strategy) RSI 布林带箭头策略是一种清晰且有效的技术指标,旨在结合 RSI 和布林带(Bollinger Bands)来识别高概率的反转点。 该策略将 RSI 指标与布林带结合使用: 当价格在 布林带上轨之上 时 卖出 。 当价格在 布林带下轨之下 时 买入 。 只有当两个指标同时确认相同的市场状况时才会生成信号,从而确保更高的准确性并减少错误的入场。 工作原理 买入信号: 价格从布林带 下轨下方向上 穿过。 RSI 向上 穿过定义的 超卖 水平。 图表上出现一个 绿色 的买入箭头。 卖出信号: 价格从布林带 上轨上方向下 穿过。 RSI 向下 穿过定义的 超买 水平。 图表上出现一个 红色 的卖出箭头。 这个简单的策略只有在 RSI 和布林带 同时 处于超买或超卖状态时才会触发,因此非常适合剥头皮(scalping)和短线反转交易。 主要特点 RSI + 布林带的组合确认。 清晰的买入和卖出箭头。 RSI 周期和布林带设置可调节。 直接在图表窗口中工作。 适用于外汇、黄金 (
DYJ TradingView
Daying Cao
5 (1)
DYJ TRADINGVIEW 是一个多指标评级系统,使用评级信号数量和分析工具来发现入场的机会。 DYJ TRADINGVIEW 有10个内置的市场分析指标。 我们使用几种不同的类型,可以很好地相互补充。 使用我们的评级系统关注您喜欢的品种,您可以找到更准确的交易。 参与评级的趋势指标包括 DYJ POWERSIGNAL 、ADX、SMA、布林带。 参与评级的震荡指标包括 MACD、RSI、随机指标、鳄鱼。 当有3个指示器有显示同一方向买入或卖出信号数量大于等于3或更高时,我们开始进入市场交易。 参数 [GENERAL] InpMaxTrendeds = 3 -> 当信号数量大于等于 InpMaxTrendeds 时 此货币对可入场  [TRADINGVIEW]    InpPowerSignalMinPercent = 90   ->   TradeView 最低趋势百分比 InpPowerSignalStrongPercent    =   100   ->   TradeView 强烈趋势百分比 InpPowerSignalMaxPercent   =  100   ->  
极值突破信号 是一种基于价格突破关键支撑和阻力位的交易策略。当价格突破这些极值点时,通常意味着市场趋势发生变化,交易者可捕捉到新的上涨或下跌机会。 参数 extreme radius:极值半径(不同周期可以设置不同参数) 核心原理 支撑与阻力 :价格在支撑或阻力位附近往往受限,突破后可能引发新趋势。 突破确认 :突破后需确认有效性,通常结合成交量或其他指标。 信号类型 买入信号 :价格突破上方阻力位,可能进入上涨趋势。 卖出信号 :价格突破下方支撑位,可能进入下跌趋势。 应用 确认突破 :结合其他技术指标(如成交量、RSI、MACD)确认突破的有效性。 止损止盈 :止损设在突破前的支撑/阻力位,止盈根据市场波动设置。 优缺点 优点 :有助于提前抓住趋势初期,适用多种市场。 缺点 :假突破的风险较高,震荡行情中效果差。 总结 :极值突破信号有助于捕捉新趋势,但需要结合其他指标,避免假突破带来的风险。
Gekko MACD Plus
Rodrigo Galeote
3 (3)
Type: Oscillator This is Gekko's Cutomized Moving Average Convergence/Divergence (MACD), a customized version of the famous MACD indicator. Use the regular MACD and take advantage of several entry signals calculations and different ways of being alerted whenever there is potential entry point. Inputs Fast MA Period: Period for the MACD's Fast Moving Average (default 12); Slow MA Period: Period for the MACD's Slow Moving Average (default 26); Signal Average Offset Period: Period for the Signal A
The RSI Divergence + FVG Signal indicator combines Relative Strength Index (RSI) Divergence with Fair Value Gap (FVG) detection to generate high-probability buy and sell signals based on both momentum shifts and institutional imbalance zones. Core Features: RSI Divergence Detection : Identifies both regular and hidden bullish/bearish divergences between price and RSI. Divergences indicate potential trend reversals or continuation. FVG Zone Recognition : Detects Fair Value Gaps (imbalances caused
该产品的买家也购买
Divergence Bomber
Ihor Otkydach
4.9 (86)
购买该指标的每位用户将额外免费获得以下内容: 原创工具“Bomber Utility”,该工具会自动跟踪每一笔交易,设置止损和止盈点,并根据策略规则自动平仓; 适用于不同交易品种的指标设置文件(Set 文件); 三种不同风险模式下的 Bomber Utility 设置文件:“最低风险”、“平衡风险” 和 “观望策略”; 一套详细的 视频操作手册,帮助您快速完成安装、配置并开始使用本交易系统。 注意: 要获取以上所有赠品,请通过 MQL5 的私人消息系统联系卖家。 我为您介绍原创的自定义指标 “Divergence Bomber”(背离轰炸机),它是一套基于 MACD 背离交易策略 的“全功能”交易系统。 该技术指标的主要任务是识别 价格与 MACD 指标之间的背离,并发出交易信号(包括推送通知),指示未来价格可能的运动方向。平均而言,这些信号的准确率超过 98%。有关该指标如何工作的详细说明,请观看本页面上的视频演示。 该系统使用 止损订单 和 动态回撤平仓机制 来管理交易。 Divergence Bomber 指标的主要特点: 支持交易的品种: AUDCAD、AUDCHF、AUDSG
Entry In The Zone and SMC Multi Timeframe is a real-time 2-in-1 market analysis tool that combines market structure analysis and a No Repaint BUY / SELL signal system into a single indicator, built on Smart Money Concepts (SMC) — a widely adopted framework used by professional traders to understand market structure. This indicator helps you see the market more clearly, make decisions based on structure rather than guesswork, and focus on high-probability zones where price is more likely to react
Azimuth Pro
Ottaviano De Cicco
5 (6)
Azimuth Pro V2:MT5合成分形结构分析与确认入场 概述 Azimuth Pro 是 Merkava Labs 推出的多层级波段结构指标。四层嵌套波段层级、锚定波段的VWAP、ABC形态识别、三时间框架结构过滤以及收盘确认入场——一个图表,一个从微观波段到宏观周期的完整工作流程。 这不是盲目的信号产品。它是一个以结构为先的工作流程,专为重视位置、背景和时机的交易者打造。 V2上市优惠 — Azimuth Pro V2售价USD 399(接下来的100份)。最终价格:USD 499。 1. V2的变化 合成多时间框架引擎 高时间框架分析从零开始重建,采用与Meridian Pro相同的专有合成架构。更清晰的HTF背景、稳定的实时行为、无经典MTF同步问题。合成引擎还解锁了 固定比率时间框架级联 (x2、x3、x4、x6)——不再在经纪商的固定时间框架之间任意跳转,您可以按图表时间框架的固定倍数分析结构,在每个尺度上保持相同的分形关系。 确认入场箭头 作为稳定且可恢复的执行层而设计的收盘确认箭头。当ABC设置形成且自适应确认逻辑在收盘K线上验证方向时,箭头会写入下一根K线的
Quantum TrendPulse
Bogdan Ion Puscasu
5 (23)
介绍 Quantum TrendPulse   ,这是一款终极交易工具,它将 SuperTrend   、   RSI 和 Stochastic 的强大功能整合到一个综合指标中,以最大限度地发挥您的交易潜力。该指标专为追求精准和效率的交易者而设计,可帮助您自信地识别市场趋势、动量变化以及最佳进入和退出点。 主要特点: 超级趋势整合: 轻松跟随当前的市场趋势并乘上盈利浪潮。 RSI 精度: 检测超买和超卖水平,非常适合把握市场逆转时机,可用作 SuperTrend 的过滤器 随机精度: 利用随机振荡在波动的市场中寻找隐藏的机会, 用作超级趋势的过滤器 多时间范围分析: 从 M5 到 H1 或 H4,在不同时间范围内关注市场动态。 可定制的警报: 当您的自定义交易条件得到满足时收到通知,这样您就不会错过任何交易。 无论您是新手还是经验丰富的交易员,   Quantum TrendPulse 都能为您提供所需的优势,帮助您增强策略并自信地进行交易。借助这一强大的指标,将洞察力转化为利润 — 掌控您的交易! ***购买 Quantum TrendPulse,即可免费获得 Quantum Tr
购买此指标即可免费获得我的专业交易管理器。 首先,值得强调的是,这个交易系统是一个非重绘、非重画和非滞后的指标,这使得它非常适合手动和机器人交易。 在线课程,手册和下载预设。 “智能趋势交易系统 MT5”是专为新手和经验丰富的交易者量身定制的综合交易解决方案。它结合了超过 10 个优质指标,具有 7 多个强大的交易策略,使其成为适用于各种市场条件的多功能选择。 趋势跟随策略:提供精确的入场和止损管理,以有效地跟随趋势。 反转策略:识别潜在的趋势反转,使交易者能够利用区域市场的机会。 剃头策略:专为快速准确的日内交易和短期交易而设计。 稳定性:所有指标都不会重绘、不会重画和不会滞后,确保可靠的信号。 定制:支持自定义策略,以满足个人交易偏好。超过 7 种策略和组合可帮助您找到最佳策略。 信号清晰度:提供箭头信号,以指示清晰的入场和退出点。 实时警报:通过交易进出警报使交易者保持了解。 深入分析:提供更高时间框架的趋势分析和实时交易监控。 自适应颜色编码:利用蜡烛颜色编码来显示成交量、趋势和反转蜡烛信号。通过蜡烛颜色分析市场方向。 “智能趋势交易系统 MT5”赋予交易者必要的工具,以便在
OmniSync Projection
Antonio-alin Teculescu
5 (1)
Chronos Fractal Engine is an innovative price projection indicator for MetaTrader 5, designed to transform your technical analysis by intelligently identifying and projecting historical price patterns. Built upon an advanced correlation algorithm and the fractal principles of the market, this powerful tool visualizes potential future price movements, giving you a unique edge in your trading decisions. What is Chronos Fractal Engine? At its core, the Chronos Fractal Engine employs a sophisticat
FX Trend MT5 NG
Daniel Stein
5 (4)
FX Trend NG:新一代多市场趋势智能分析工具 概述 FX Trend NG 是一款专业的多时间周期趋势分析与市场监控工具,帮助您在几秒钟内全面了解市场结构。 无需在多个图表之间来回切换,您可以立即看到哪些品种处于趋势中、哪里动能正在减弱,以及哪些时间周期之间存在强烈共振。 限时发布优惠 – 仅需 $30(6个月) 或 $80 终身授权 即可拥有 FX Trend NG 。 已经是 Stein Investments 客户? -> 发送消息 以获取专属客户群访问权限。 需要帮助或安装指导? -> 请访问 Stein Investments 官方页面 。 1. FX Trend NG 的核心优势 三状态趋势逻辑 —— 不只是 Buy 或 Sell • 大多数指标仅显示两种状态:Buy 或 Sell。 • FX Trend NG 增加第三种状态: Fade 。 • Fade 表示趋势强度正在减弱,在完全反转之前提前发出信号。 这种结构化逻辑让您看到趋势变化过程,而不仅仅是简单方向信号。 多时间周期分析(M1 至 MN1) • 从短线交易到中长线交易全面覆盖。 • 快速识别趋势
介绍     Quantum Breakout PRO   ,突破性的 MQL5 指标,正在改变您交易突破区域的方式!由拥有超过13年交易经验的资深交易员团队开发,     量子突破 PRO     旨在通过其创新和动态的突破区域策略将您的交易之旅推向新的高度。 量子突破指标将为您提供带有 5 个利润目标区域的突破区域的信号箭头,以及基于突破框的止损建议。 它既适合新手交易者,也适合专业交易者。 量子 EA 通道:       点击这里 重要的!购买后请私信我领取安装手册。 建议: 时间范围:M15 货币对:GBPJPY、EURJPY、USDJPY、NZDUSD、XAUUSD 账户类型:ECN、Raw 或 Razor,点差极低 经纪商时间:GMT +3 经纪商:IC Markets、Pepperstone with Raw 和 Razor 的点差最低 规格: 不重漆! 最多 5 个建议利润目标区域 建议止损水平 可定制的盒子。您可以设置自己的 Box Time Start 和 Box Time End。 接触 如果您有任何疑问或需要帮助,请通过私人消息与我联系。
Grabber System MT5
Ihor Otkydach
4.83 (23)
向您介绍一款优秀的技术指标——Grabber,它是一套即开即用的“全包式”交易策略。 在一个代码中集成了强大的市场技术分析工具、交易信号(箭头)、提醒功能和推送通知。 每位购买该指标的用户还可免费获得以下内容: Grabber辅助工具:用于自动管理已开仓位 视频操作指南:逐步教学如何安装、设置和使用该指标进行交易 原创Set文件:可快速自动配置,帮助实现最佳交易效果 忘掉其他策略吧!只有Grabber能够真正激励你在交易中攀登新高峰! Grabber策略的主要特点: 交易周期:从M5到H4 适用资产:任意,但我推荐我亲自测试过的品种(GBPUSD、GBPCAD、GBPCHF、AUDCAD、AUDUSD、AUDSGD、AUDCHF、NZDUSD、NZDCAD、EURCAD、EURUSD、EURAUD、EURGBP、EURCHF、USDCAD、USDSGD) 交易时间:全天候 24/7 交易效果:我分享自己的真实交易结果,并在此教学如何操作: https://www.mql5.com/ru/market/product/134563?source=Site+Market+MT5+Indic
CGE Trading Suite
Carl Gustav Johan Ekstrom
5 (2)
Institutional-Grade Analytics for MT5 C GE Trading Suite delivers the analytical edge typically reserved for professional trading desks. The platform integrates a full suite of analytical tools into one seamless workflow: dynamic grid mapping, liquidity behavior analysis, ECM, trend lines, MIDAS, trade cycles, and directional channel projections. Together, these provide a unified view of market structure and momentum. Directional clarity is further enhanced by the capital flow index, which meas
Power Bar MT5
Daniel Stein
在冒真金白银之前, 先看看哪种策略真正适合你的品种。 Power Bar 可在任何品种和任何时间周期上检测 极端价格K线 , 然后即时回测3种不同的交易策略, 让你并排比较胜率、盈亏比和收益。全部集成在一个交互式面板中。 无需猜测。无需过度拟合。只看数据。 Power Bar 有何独特之处? 大多数指标只给你一个信号, 让你猜测它是否有效。Power Bar 更进一步: 它用 三种策略 测试每个信号并展示统计数据。一键切换 FlipFlop、Momentum 和 Reversal, 即刻看到数据变化。 FlipFlop - 始终持仓。信号入场, 反向信号出场。我们的研究表明, 这在 US30、US500 和 DAX 等趋势性指数上效果最佳。 Momentum - 顺信号方向交易。基于 ATR 的固定 SL/TP。适用于趋势延续形态的均衡方法。 Reversal - 逆信号交易(反向操作)。我们的回测显示, 在 JPY 外汇交叉盘上胜率超过 70%, 因为极端K线标志着衰竭而非延续。 更改参数, 即时查看结果 无需打开指标属性。直接在面板中通过 +/- 按钮调整 ATR 倍数、周期、
Atomic Analyst MT5
Issam Kassas
3.94 (31)
首先值得强调的是,该交易指标是非重绘、非延迟的指标,这使其成为手动和机器人交易的理想选择。 用户手册:设置、输入和策略。 Atomic Analyst是一种PA价格行动指标,利用价格的力量和动量来寻找市场上更好的机会。配备了高级过滤器,可帮助去除噪音和假信号,并提高交易潜力。使用多层复杂的指标,Atomic Analyst扫描图表,并将复杂的数学计算转化为任何初学者都能理解并用来做出一致交易决策的简单信号和颜色。 “Atomic Analyst”是专为新手和经验丰富的交易者量身定制的综合交易解决方案。它将高级指标和一流功能融合为一体的交易策略,使其成为所有类型交易者的多功能选择。 日内交易和剥头皮策略:专为快速准确的日内交易和短期交易而设计。 日内和摆动交易策略:可用作追求价格大幅波动的日内和摆动交易者的可靠工具。 多货币和市场:凭借其可靠的精度,在不同的工具和市场上运作。 多个时间框架:可在多个时间框架上使用,性能良好。 稳定性:所有指标均不重绘、不重绘和不滞后,确保可靠的信号。 信号清晰度:提供箭头信号,用于清晰的入场和出场点。 实时警报:通过交易入场、SL和TP警报通知交易者
Meridian Pro
Ottaviano De Cicco
5 (1)
Meridian Pro:MT5专业多时间框架趋势矩阵 概览 Meridian Pro 是 Merkava Labs 推出的多时间框架趋势矩阵,将方向状态、强度、动量条件和矩阵一致性压缩到一个紧凑面板中。一个自适应引擎,从M1到W1一致应用。无需逐品种调参。无需堆叠指标。一个结构化读数覆盖所有资产和所有时间框架。 上市优惠 — Meridian Pro 优惠价 USD 99 (限时)。常规价格:USD 149 。 1. Meridian Pro 为何不同 一个引擎,而非互不相连的指标仪表盘 许多MTF仪表盘只是在各时间框架重复原始指标状态。Meridian Pro在整个矩阵中使用一个自适应趋势引擎,面板中的每一行都来自同一个结构化框架。这使其读取快速、使用简洁,在真实图表条件下实用。 合成时间框架架构 Meridian Pro不依赖常规的零售MTF方法,而是从 M1数据 构建统一的内部矩阵结构。无经典MTF同步问题。无因脆弱的高时间框架拼接导致的重绘或延迟。无因不稳定时间框架依赖导致的面板冻结。在不同高时间框架数据质量的经纪商之间具有更好的稳健性。 2. 面板显示内容 Bias — 每
Btmm state engine pro
Garry James Goodchild
5 (4)
BTMM State Engine Pro is a MetaTrader 5 indicator for traders who use the Beat The Market Maker approach: Asian session context, kill zone timing, level progression, peak formation detection, and a multi-pair scanner from a single chart. It combines cycle state logic with a built-in scanner dashboard so you do not need the same tool on many charts at once. What it does Draws the Asian session range; session times can follow broker server offset or be set in inputs. Tracks level progression (L
FX Power MT5 NG
Daniel Stein
5 (31)
FX Power:分析货币强度,助您做出更明智的交易决策 概述 FX Power 是一款专业工具,帮助您全面了解主要货币和黄金在任何市场条件下的真实强度。通过识别强势货币用于买入,弱势货币用于卖出, FX Power 简化了交易决策,并帮助您发现高概率的交易机会。不论您是想跟随趋势还是通过极端的 Delta 值预测反转,这款工具都能完美适应您的交易风格。别再盲目交易——用 FX Power 让您的交易更加智慧。 1. 为什么 FX Power 对交易者极具价值 实时货币和黄金强度分析 • FX Power 实时计算并显示主要货币和黄金的相对强度,助您全面了解市场动态。 • 监控领先或落后资产,轻松识别值得交易的货币对。 全面的多时间框架视图 • 跟踪短期、中期和长期时间框架的货币和黄金强度,以便将您的交易策略与市场趋势保持一致。 • 无论是快进快出的短线交易还是更长期的投资策略, FX Power 都能为您提供所需的信息。 Delta 动态分析用于趋势和反转 • 极端 Delta 值常常预示反转机会,而平缓的 Delta 变化则确认趋势延续。 • 使用 Delta 分析,轻
ARICoins
Temirlan Kdyrkhan
ARICoin is a powerful trading companion designed to generate high-probability entry signals with dynamic TP/SL/DP levels based on volatility. Built-in performance tracking shows win/loss stats, PP1/PP2 hits, and success rates all updated live. Key Features: Buy/Sell signals with adaptive volatility bands Real-time TP/SL/DP levels based on ATR Built-in MA Filter with optional ATR/StdDev volatility Performance stats panel (Success, Profit/Loss, PP1/PP2) Alerts via popup, sound, push, or email Cust
ARIPoint
Temirlan Kdyrkhan
ARIPoint is a powerful trading companion designed to generate high-probability entry signals with dynamic TP/SL/DP levels based on volatility. Built-in performance tracking shows win/loss stats, PP1/PP2 hits, and success rates all updated live. Key Features: Buy/Sell signals with adaptive volatility bands Real-time TP/SL/DP levels based on ATR Built-in MA Filter with optional ATR/StdDev volatility Performance stats panel (Success, Profit/Loss, PP1/PP2) Alerts via popup, sound, push, or email Cu
SignalTech MT5 is a trading system for EURUSD, USDCHF, USDJPY, AUDUSD, NZDUSD, EURJPY, AUDJPY, NZDJPY, CADJPY H2 and H3 Timeframe.  It can generate signals with Buy/Sell Arrows and Pop-Up/Sound Alerts. Each signal has clear Entry and Stop Loss levels, which should be automatically flagged on the chart, as well as potential Targets 1, 2, and 3. The Entry and TP levels are fixed after the trade is taken. The exit level is dynamic. If there are signs of a potential short-term trend reversal, the
Blahtech Supply Demand MT5
Blahtech Limited
4.54 (13)
Was: $299  Now: $99  Supply Demand uses previous price action to identify potential imbalances between buyers and sellers. The key is to identify the better odds zones, not just the untouched ones. Blahtech Supply Demand indicator delivers functionality previously unavailable on any trading platform. This 4-in-1 indicator not only highlights the higher probability zones using a multi-criteria strength engine, but also combines it with multi-timeframe trend analysis, previously confirmed swings a
Volume flow Profile
Israr Hussain Shah
大师版是一款专业级的分析工具,旨在通过成交量和资金流向的视角来可视化市场结构。与标准的成交量指标不同,该工具直接在图表上显示每日成交量分布,让您准确看到价格发现发生的位置以及“聪明钱”的定位。 此大师版专为清晰度和速度而设计,具有独特的自动主题同步系统,加载后即刻美化您的图表布局。 主要特点: 真实资金流向计算: 超越标准的跳动量。启用“Use Money Flow”时,成交量按价格加权,揭示了特定价格水平的实际资金投入。 价值区域 (VA) 可视化: 自动计算价值区域(默认为成交量的70%)。 VA填充: 为价值区域背景着色,以便即时识别控制区域。 关键水平: 清晰标记控制点 (POC)、价值区域高点 (VAH) 和价值区域低点 (VAL)。 专业标记系统: 扫描概况结构以识别关键交易区域: HVN (高成交量节点): 接受和盘整区域(支撑/阻力)。 LVN (低成交量节点): 拒绝区域或“快速通过”区域。 所有标记均向右绘制延长线,便于监控。 Delta 背离(左侧直方图): 左侧直方图可视化每个级别的买卖压力对比。这有助于识别隐藏的背离——即价格可能上涨,但卖家在这些水平上激进打
RelicusRoad Pro MT5
Relicus LLC
5 (24)
RelicusRoad Pro: 量化市场操作系统 终身访问限时 70% 折扣 - 加入 2,000+ 交易员社区 为什么大多数交易者即使拥有“完美”指标也会失败? 因为他们在真空中交易 单一概念 。没有背景的信号是赌博。要持续获胜,您需要 共振 (CONFLUENCE) 。 RelicusRoad Pro 不是一个简单的箭头指标。它是一个完整的 量化市场生态系统 。它描绘价格运行的“公允价值之路”,区分市场噪音和真实的结构性突破。 停止猜测。开始用机构级“路”逻辑进行交易。 核心引擎:“Road” (路) 算法 系统的核心是 Road Algo ,一个实时适应市场条件的动态波动率通道。它投射出 安全线 (平衡) 和价格可能反转的 扩展水平 。 Simple Road: 典型市场的标准结构映射。 Smooth Road: 针对震荡盘整的降噪计算。 Breakout Road: 专为识别波动率扩张和爆发性走势而调整。 1. 算法动量与确认 我们的“剥头皮箭头”不只是简单的交叉。它们利用 高阶多项式逻辑 过滤噪音,确保信号与主周期一致。我们检测动量、价格行为和 Road 结构汇聚的精确入场
首先,值得强调的是,这个交易工具是非重绘、非重画和非滞后的指标,非常适合专业交易。 在线课程,用户手册和演示。 智能价格行动概念指标是一个非常强大的工具,既适用于新手,也适用于经验丰富的交易者。它将超过20个有用的指标合并到一个指标中,结合了高级交易思想,如内圈交易员分析和智能资金概念交易策略。该指标侧重于智能资金概念,提供有关大型机构交易方式的见解,帮助预测它们的动向。 它在流动性分析方面尤其擅长,有助于理解机构的交易方式。它擅长预测市场趋势,并仔细分析价格波动。通过将您的交易与机构策略对齐,您可以更准确地预测市场走向。该指标多才多艺,擅长分析市场结构,识别重要的订单区块,并识别各种模式。 它擅长识别BOS和CHoCH等模式,理解动量的转变,并突出显示供需强劲的关键区域。它还擅长发现强大的不平衡,并分析价格创造更高高点或更低低点的模式。如果您使用斐波那契回撤工具,该指标可以满足您的需求。它还可以识别相等的高点和低点,分析不同的时间框架,并通过仪表板显示数据。 对于使用更高级策略的交易者,该指标提供了工具,如公平价值差指标和优惠和折扣区域的识别。它特别关注高时间框架订单区块,并
CRT Multi-Timeframe Market Structure & Liquidity Sweep Indicator Non-Repainting | Multi-Asset | MT4 Version Available MT4 Version: https://www.mql5.com/en/market/product/162556 Full Setup Guide: https://www.mql5.com/en/blogs/post/767525 Indicator Overview CRT Ghost Candle HTF Fractal is a complete institutional-grade market structure toolkit for MetaTrader 5. It projects higher-timeframe candle structure, CRT trap levels, session levels, previous period highs and lows, pivot points, and a real
Gartley Hunter Multi
Siarhei Vashchylka
5 (11)
Gartley Hunter Multi - An indicator for searching for harmonic patterns simultaneously on dozens of trading instruments and on all possible timeframes. Manual (Be sure to read before purchasing) | Version for MT4 Advantages 1. Patterns: Gartley, Butterfly, Shark, Crab. Bat, Alternate Bat, Deep Crab, Cypher 2. Simultaneous search for patterns on dozens of trading instruments and on all possible timeframes 3. Search for patterns of all possible sizes. From the smallest to the largest 4. All fou
Bill Williams Advanced
Siarhei Vashchylka
5 (11)
Bill Williams Advanced is designed for automatic chart analysis using Bill Williams' "Profitunity" system. The indicator analyzes four timeframes at once. Manual (Be sure to read before purchasing) Advantages 1. Analyzes the chart using Bill Williams' "Profitunity" system. Signals are displayed in a table in the corner of the screen and on the price chart. 2. Finds all known AO and AC signals, as well as zone signals. Equipped with a trend filter based on the Alligator. 3. Finds "Divergence Bar
Basic Supply Demand Dashboard MT5
Mehran Sepah Mansoor
5 (1)
该仪表盘可根据您对所选符号的交易策略,以剥头皮和长期模式在图表上发现并显示供需区。此外,仪表盘的扫描模式可帮助您一目了然地检查所有需要的符号,不错过任何合适的仓位/ MT4 版本 免费指标: Basic Supply Demand 功能 允许您查看多个货币对的交易机会,为您提供所有货币对的清晰简明视图,并根据其与供需区的接近程度进行排序 可定制设置,从颜色到检测参数,满足您的特定需求 主要输入 Indicator mode : 选择指标模式或具有新功能的面板模式 Symbols : 从 "28 种主要货币对 "或 "选定符号 "中进行选择 Selected Symbols : 您希望监控的符号,用逗号分隔("EURUSD,GBPUSD,XAUUSD")。如果您的经纪商对货币对有后缀或前缀,您必须在以下两个参数中添加(货币对前缀或货币对后缀) Trading Style : 选择剥头皮或长期模式 Allowed Deviation : 该参数允许修改需求或供应区域的精确度(数值越小,精确度越高) Zone   thickness : 通过该参数可以修改需求和供应区域的厚度。
Currency Strength Dashboard Pro
Anastasia Danilova
5 (1)
Currency Strength Dashboard Pro 适用于 MetaTrader 5 的专业级实时货币强度分析面板。 该指标同时对 8 种主要货币 (EUR、USD、GBP、JPY、CHF、AUD、CAD、NZD)进行强度计算,并基于 28 个货币对 在多个时间周期上进行分析和显示。 该面板让交易者能够 一眼看清整个市场状况 —— 无需额外计算,也无需在多个图表之间切换。 计算方法 该指标基于一种 先进的数学货币强度计算方法 ,相比许多类似指标常用的 RSI 方法 ,具有更高的准确性和客观性。 该方法同时分析 全部 28 个货币对之间的关系 ,从而提供更清晰、更无偏差的市场真实强弱对比。 实时分析面板 主表格显示 8 种货币 的完整数据: Rank(排名) — 按整体强度排序, 1 为最强,8 为最弱 。 Strength(强度) — 当前货币强度的数值。 Change(变化) — 与上一根K线相比的强度变化。 Slope(斜率) — 强度趋势方向:上升、下降或横盘。 时间周期数据(M15、H1、H4、D1) — 各时间周期的独立强度值。 Composite(综合值) —
Trend indicator AI mt5
Ramil Minniakhmetov
5 (16)
趋势人工智能指标是一个伟大的工具,将加强交易者的市场分析结合趋势识别与可操作的进入点和逆转警报。 该指标使用户能够自信和精确地驾驭外汇市场的复杂性 除了主要信号,趋势Ai指标识别在回调或回调期间出现的次要入口点,使交易者能够利用既定趋势内的价格修正。 重要优势: *MT4及MT5工程 *明确买入或卖出信号 ·不重绘 *适用于所有资产 小心我不卖EA或设置电报它骗局. 所有设置免费在这里的博客。  重要! 购买后立即与我联系,以获得指示和奖金! 真实的操作监控以及我的其他产品可以在这里找到: https://www.mql5.com/en/users/mechanic/seller&nbsp ; 设置和输入: 建议为所有资源设置默认设置。 第...
MACD 日內趨勢 PRO 是通過改編自 Gerald Appel 在 1960 年代創建的原始 MACD 而開發的指標。 通過多年的交易,觀察到通過使用斐波那契比例更改 MACD 的參數,我們可以更好地呈現趨勢運動的連續性,從而可以更有效地檢測價格趨勢的開始和結束。 由於其檢測價格趨勢的效率,還可以非常清楚地識別頂部和底部的背離,從而更好地利用交易機會。 特徵 MACD 日內趨勢 PRO 指標適用於任何貨幣對、任何時間範圍以及 Renko 圖表。 可以通過選擇 6 種模式來設置趨勢檢測速度: 最快的 快速地 普通的 減緩 最慢 資源 它有 6 個可配置的警報: MACD回調信號線 MACD穿越信號線 MACD穿過零水平 信號線過零電平 MACD 變化趨勢顏色 信號線變化趨勢顏色 對於每個警報,可以配置: 彈出 聲音(有 13 種聲音可用。) 智能手機通知 彈出窗口和聲音 彈出窗口和智能手機通知 聲音和智能手機通知 彈出窗口、聲音和智能手機通知 與智能交易系統或其他指標集成 有 8 個緩衝區可用於訪問和與專家顧問或其他指標集成,即使關閉警報,它們也會被填滿,它們是: 緩衝
RFI levels PRO MT5
Roman Podpora
3.67 (3)
该指标能够准确显示反转点和价格回落区域。     行业领军人物 。您能洞察新趋势的形成,并以最高的精准度做出决策,掌控每一笔交易。 VERSION MT4     -    与……结合时,展现其最大潜力     趋势线专业版   指标 该指标显示的内容: 新趋势开始时的反转结构和反转水平及其激活。 显示屏   获利了结   和   止损   风险回报比最低的水平     RR 1:2       。 具有智能减值逻辑的止损。 显示指定指标中两种趋势类型的反转形态。 指标: 根据     趋势线     (全球趋势变化) 潮流专业版     (趋势快速变化) 简单有效   扫描器   实时趋势(新增)。 多时间框架工具筛选。 展示   利润   在 LOGIC AI 信号之后。 以下列出今日走势积极的金融工具。(RB键) 能够为终端启用通知(警报)功能,并向移动设备推送通知。 逻辑人工智能     — 利用人工智能寻找最佳切入点。 只有在启用 MTF(多时间框架分析)模式时,该功能才可用。 兼容性。 当与趋势线指标结合使用时,该指标能发挥其最大潜力。 这     RFI LEVELS
作者的更多信息
ZenTrend
Oleksii Ferbei
ZenTrend — Adaptive Trend Indicator for MetaTrader 5 ZenTrend is an innovative trend indicator for MetaTrader 5 that plots a flexible and informative trend line on the chart, based on adaptive moving average calculations. This tool is ideal for traders seeking precise and timely identification of trend direction on any financial market: forex, stocks, indices, cryptocurrencies, and commodities. Key Features of ZenTrend 1. Four Types of Moving Averages Supported ZenTrend allows you to choose fro
Trend Detects
Oleksii Ferbei
The intelligent algorithm of the Trend Detects indicator shows the points of potential market reversal. Strategy for trend trading, filtering market noise and all the necessary functions built into one tool! The system itself shows in the form of arrows when to buy and when to sell. Uses only one parameter for settings. Simple, visual and effective trend detection. Most often, a good trend is visible on the price chart visually. But an experienced trader must clearly understand the current bal
Trend Ex
Oleksii Ferbei
Trend Ex is an author’s indicator of which you will not find anywhere else. This indicator allows you to find the most likely points of a trend reversal, a trend indicator for the MetaTrader 4 trading platform. A simple but effective system for determining the forex trend. From the screenshots you can see for yourself the accuracy of this tool. It works on all currency pairs, stocks, raw materials, cryptocurrencies. An alert system (alert, email notifications) will help to monitor several trad
Determined Trend
Oleksii Ferbei
Determined Trend is a direction indicator for determining a trend. You need to understand that any dial indicator is just a visual waveform. As a rule, such Forex indicators contain a whole trading system, process information from several technical instruments and the appearance of its “arrow”? final calculation result. The indicator itself evaluates how strong a signal appears in the market, signals about it, and the trader can only make a trading decision. The Determined Trend indicator vis
Reflector
Oleksii Ferbei
Reflector is an auxiliary tool for technical analysis, which helps to determine the direction of the trend: either upward or downward price movement on the selected trading instrument. The indicator is an indicator of a trend type; it smooths out price fluctuations during signal formation by averaging data. The indicator uses calculations designed to smooth out sharp fluctuations that do not affect the overall picture of price movement. A trend can be increasing (bullish trend) and decreasing
Icebreaker
Oleksii Ferbei
Icebreaker trend indicator provides an opportunity to classify the direction of price movement, determining its strength. The solution to this problem helps to enter the market on time. You can not only see the direction of the trend but also the levels by which you can work. The indicator determines the prevailing trend in the price chart. But not only, but also analyzes the price movement, and indicate the points of possible reversals. This contributes to the quick and optimal opening of buy
Unexpected
Oleksii Ferbei
The Unexpected indicator is surprisingly easy to use. You will appreciate the simplicity of the indicator in the very first days of trading. If you correctly determine the beginning of the trend, the result of the transaction will be appropriate. Trading based on trend indicators is the simplest and often the most effective. If you use a live binary options chart as a base, the chances of success are even higher. This indicator can track the steady price movement in a certain direction. In thi
Fact
Oleksii Ferbei
Fact shows favorable moments for entering the market. The indicator can work both for entry points, and as the filter. Uses two settings. This is a hybrid trend indicator, as it is based on the signals of elementary indicators and a special algorithm for analysis. The intelligent indicator algorithm accurately detects the trend, filters market noise and generates input signals. The indicator uses a color alarm: blue - when changing from descending to ascending, and red - on the contrary, to d
Troopers
Oleksii Ferbei
All the points of intersection of the Troopers indicator will be points at which the trend direction changes. Sharp price fluctuations are ignored as well as noise around average prices. Signal points, where the color changes, can be used as potential market reversal points. The indicator tracks the market trend with very high reliability. This development can be used both for long-term trading and for pipsing on small periods. The indicator algorithm implements a kind of technical analysis base
Primary Trend
Oleksii Ferbei
Primary Trend is a handy tool if you are used to trading on a clean chart, but sometimes you need to take a look at Primary Trend. The Primary Trend indicator studies price action as a collection of price and time vectors, and uses the average vector to determine the direction and strength of the market. This indicator highlights the short-term direction and strength of the market. The indicator is not redrawn. The indicator implements a breakout strategy. The arrows show the direction of the ma
Your Chance
Oleksii Ferbei
The Your Chance indicator studies price action as a collection of price and time vectors, and uses the average vector to determine the direction and strength of the market. It also estimates the market trend based on rough measurements of price movement. This indicator is confirming and can be especially useful for traders looking for price movements. This indicator highlights the direction and strength of the market and can be used to trade price fluctuations.
Unexpected Decision is a trend indicator that uses an original calculation algorithm. This is a new product that allows you to identify the current market phase (uptrend, downtrend or flat). The indicator is applicable for any data and periods. The middle of the trend wave, as well as the edges, are places of special heat and market behavior; when writing the indicator, an attempt was made to implement precisely finding the middle. This indicator paints arrows in different colors depending on th
Trend Analytics
Oleksii Ferbei
Trend Analytics is a technical analysis indicator that allows you to determine with sufficient probability when a trend and its direction or flat prevail in the foreign exchange market. The indicator is built on special algorithms. The dignity of which you see in the screenshots. The indicator can work on any timeframe, but to minimize the likelihood of false signals, you should set a timeframe from H15 and higher. In this case, you should use a small stop loss to protect against false signals.
The Trends Definitive indicator does not redraw and does not lag, it shows points for entering the market, points of potential market reversal. Uses one parameter for settings. Currency pairs never rise or fall in a straight line. Their ups and downs are interspersed with pullbacks and reversals. Every rise and every fall is reflected in your emotional state: hope is replaced by fear, and when it passes, hope appears again. The market uses your fear to prevent you from taking advantage of a st
Progres
Oleksii Ferbei
The Progres indicator uses calculations designed to smooth out sharp fluctuations that do not affect the overall picture of price movement. This is an auxiliary tool for technical analysis, which helps to determine the direction of the trend: either upward or downward price movement on the selected trading instrument. The indicator is a trend-type indicator; it smooths out price fluctuations during signal formation by averaging data. The trend can be ascending (bullish) and decreasing (bearis
Trends Target
Oleksii Ferbei
Trend Target analyzes the main parameters of Forex, helps to obtain information about the current position of all market transactions for a particular asset. Trend Target makes it possible to classify the direction of price movement by determining its strength. Solving this problem helps to enter the market on time. You can not only see the direction of the trend, but also the levels that you can work with. The indicator also allows plotting levels. Quickly identifies support and resistance li
Compasss
Oleksii Ferbei
The principle is very simple, practical and effective - they are implemented in the Compass indicator, which will help traders to protect their deposit from loss. This is one of the implementations of the indicator for protecting a position from loss. Similar implementations exist, this is not a complex algorithm. The indicator uses a series of moving averages, which, with a given Length step, form the resulting lines that are displayed on the price chart as blue and red lines. These lines are t
Consequence
Oleksii Ferbei
The Consequence indicator determines the moments of the trend reversal and the direction of its movements. He will provide you with everything you need to overcome the losses due to human emotions. Consequence is equipped with the most advanced, adaptable and profitable trading algorithms. It's time to stop wandering in the dark and gain a clear vision of goals in intraday trading, for which this indicator was created. One of the secrets of short-term trading is knowing when to enter a trade.
Star 4D
Oleksii Ferbei
The peculiarity of Star 4D is the presence of a signal for entry / exit - the indicator line denotes "buy" or "sell" signals in a certain color. The accuracy of this signal is quite acceptable, see and judge for yourself. Star 4D is also good for getting out of position. The indicator almost completely captures the trend, but filters must be used during a flat. When entering a position, you will always follow the trend. This great property makes Star 4D more attractive.
Ferbey
Oleksii Ferbei
The intelligent algorithm of the Ferbey indicator shows potential reversal points of the market with a high probability. The Ferbey indicator is perfect for trend trading! If you trade with the trend, then a trading strategy based on this indicator will suit you perfectly. The indicator filters out market noise, practically all and all the necessary functions for working on a thread are built into one tool. Works on all currency pairs and on all timeframes, the indicator setting is at your req
Trend Regulator
Oleksii Ferbei
Most often, a good trend is visible on a price chart visually. But an experienced trader should clearly understand the current balance of power in the market before entering. The Trend Regulator indicator will help the trader to make decisions by helping him with the appropriate signals. The intelligent algorithm of the Trend Regulator indicator shows the points of potential market reversal. A strategy for trading with the trend, filtering market noise and all the necessary features built into o
Identify Take
Oleksii Ferbei
4.5 (2)
Identify Take - trend trading strategy, market noise filtering and all necessary functions built into one tool! The system itself shows in the form of arrows when to buy and when to sell. Uses only one setting parameter. Simple, visual and effective trend detection. The intelligent algorithm of the Identify Take indicator shows the points of a potential market reversal. Most often, a good trend can be seen visually on the price chart. But an experienced trader must clearly understand the curre
Easys Trends
Oleksii Ferbei
The Easy Trends indicator gives the trader the ability to visually determine which trend will be present at a particular time interval. It smooths out price fluctuations during signal formation by averaging the data. This is an auxiliary tool for technical analysis, which helps to determine the exact direction of the trend: either upward or downward movement of the price of a trading instrument. Although the indicator lags a little, it still generates the most reliable signals that a trader ca
Reversal Prices
Oleksii Ferbei
Reversal Prices is an indicator that has a fairly powerful and effective mechanism for adapting to changing market conditions. Reversal Prices - the new word in trend detection! With the development of information technology and a large number of participants, financial markets are less and less amenable to analysis by outdated indicators. Conventional technical analysis tools, such as the Moving Average or Stochastic, in their pure form are not able to determine the direction of the trend or it
The new Analytical Concentration leading trend indicator uses adaptive anti-aliasing. It allows you to enter the market early. Indicator of a sharp turn to a dynamic change of direction. The Analytical Concentration indicator gives the trader the ability to visually determine which trend will be present at a particular time interval. An indicator that has a sufficiently powerful and effective mechanism for adapting to changing market conditions. A new word in trend detection! It smooths out pr
Trend Protection Indicator Uses one parameter for settings. Currency pairs never rise or fall in a straight line. Their ups and downs are interspersed with pullbacks and reversals. The indicator does not redraw and does not lag, it shows points for entering the market, points of potential market reversal. Every rise and every fall is reflected in your emotional state: hope gives way to fear, and when it passes, hope reappears. The market uses your fear to prevent you from taking advantage of a
Pyro Trend
Oleksii Ferbei
Pyro Trend is a new product that allows you to identify the current market phase (uptrend, downtrend or flat). The indicator is applicable for any data and periods. The middle of the trend wave, as well as the edges, are places of special heat and market behavior; when writing the indicator, an attempt was made to implement precisely finding the middle. Pyro Trend is a trend indicator that uses an original calculation algorithm. This indicator paints arrows in different colors depending on the
Trinitron
Oleksii Ferbei
Индикатор Trinitron создан для того чтобы отображать тренд в наглядном виде. Одним из главных определений для мониторинга рынка валют является тренд. Тренд - это устойчивое направление движения цены. Для его нахождения индикатор использет расчёты, призванные сглаживать резкие колебания, не влияющие на общую картину движения цены. Тренд может быть возрастающим (бычий тренд) и убывающий (медвежий тренд). В большинстве случаев тренд растёт долго и резко падает, но во всём бывают исключения. На дв
Explosive Trend
Oleksii Ferbei
The indicator analyzes the chart as a mathematical function with X-time and Y-price axes. Time is presented in bars, price in pips. The purpose of the analysis is to give the user a signal to action at the moment when the function forms a recoilless movement in one direction over a certain period of time. The indicator parameters must be selected for each currency pair, since the price function is formed differently for each currency pair. Shows favorable moments for entering the market with a
Trend Navigato
Oleksii Ferbei
The Forex indicator   TrendNavigator   is a technical indicator. TrendNavigator is a tool that allows traders employing this strategy to better understand what is happening in the market and predict in which direction the price will continue to move. The indicator's values are calculated based on price movements of the currency pair or any other financial asset. Within the scope of technical analysis, the TrendNavigator indicator is used by traders to forecast future price values or the overall
筛选:
无评论
回复评论