Analytical Concentration
- 指标
- 版本: 1.2
- 激活: 5

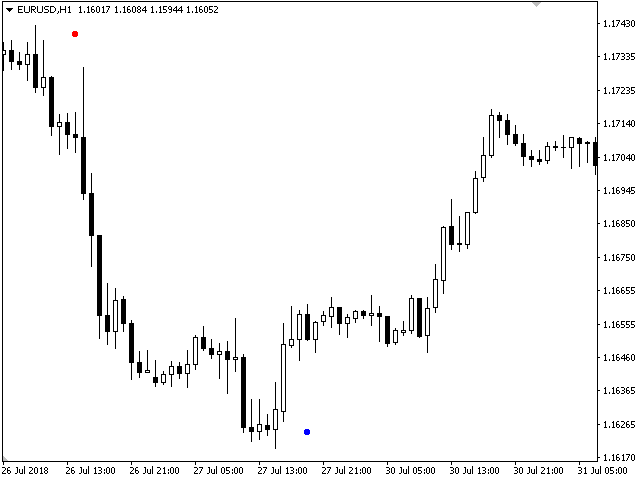
The new Analytical Concentration leading trend indicator uses adaptive anti-aliasing. It allows you to enter the market early. Indicator of a sharp turn to a dynamic change of direction. The Analytical Concentration indicator gives the trader the ability to visually determine which trend will be present at a particular time interval. An indicator that has a sufficiently powerful and effective mechanism for adapting to changing market conditions.
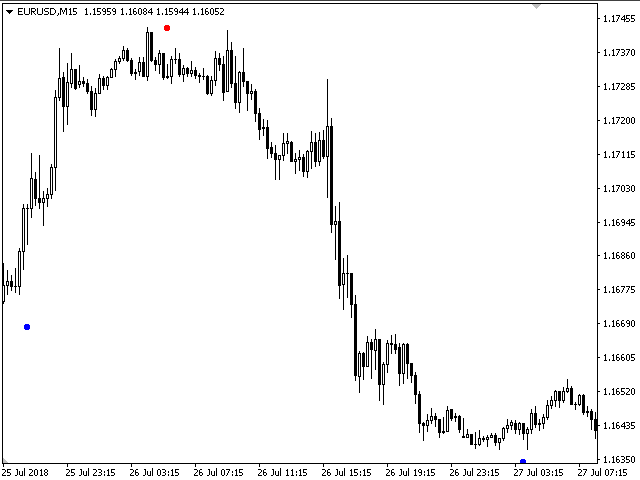
A new word in trend detection! It smooths out price fluctuations during signal formation by averaging the data. This is an auxiliary tool for technical analysis, which helps to determine the exact direction of the trend: either upward or downward movement of the price of a trading instrument. With the development of information technology and a large number of participants, financial markets are less and less amenable to analysis by outdated indicators.
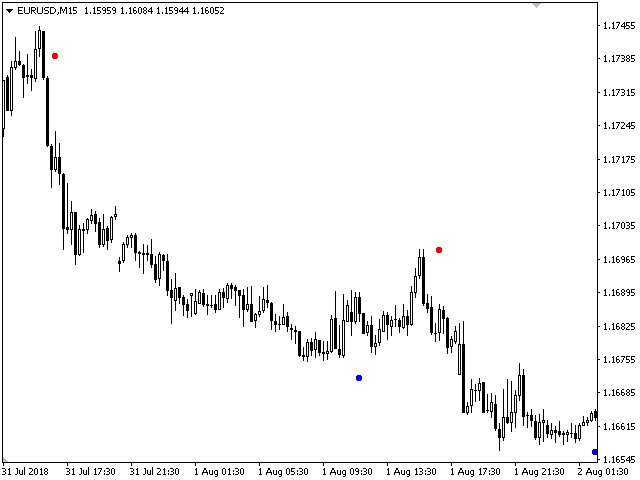
Conventional technical analysis tools, such as the Moving Average or Stochastic, in their pure form are not able to determine the direction of the trend or its reversal. The Analytical Concentration indicator generates the most reliable signals that a trader can safely rely on. It is also very convenient to use it as a trailing indicator.