Reversal Prices

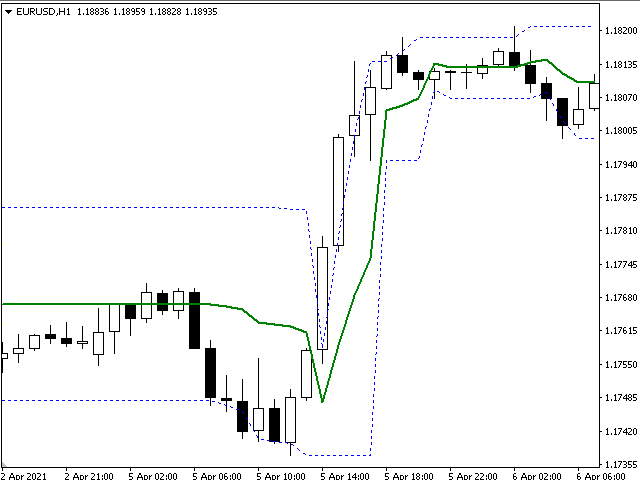
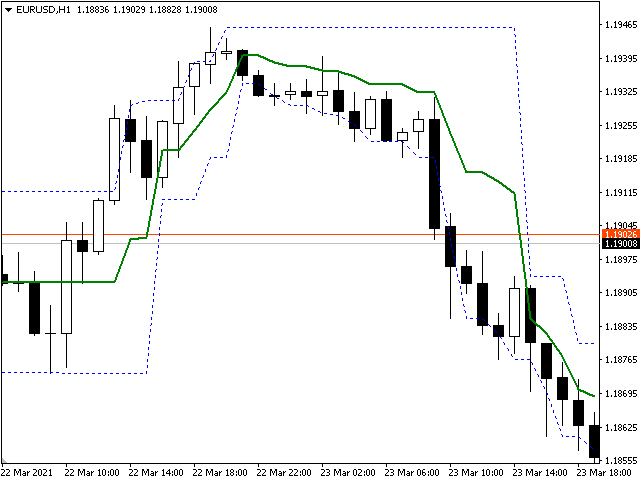
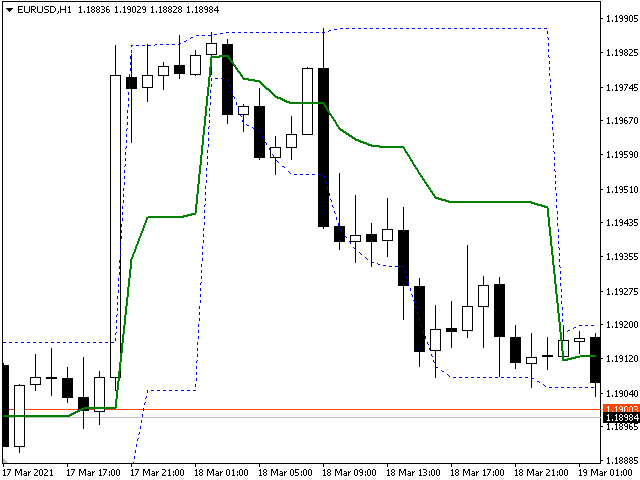
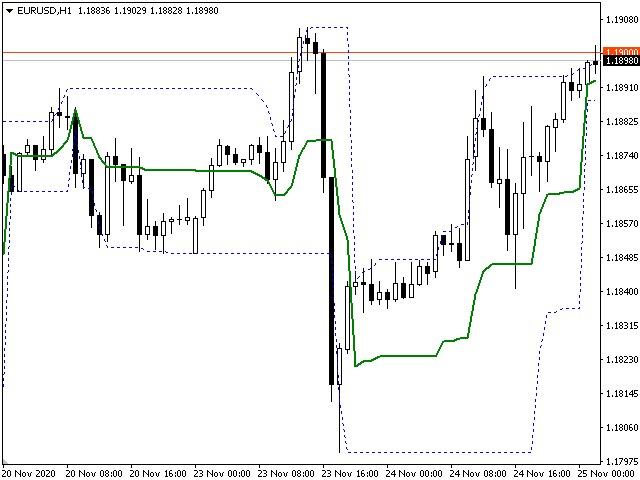
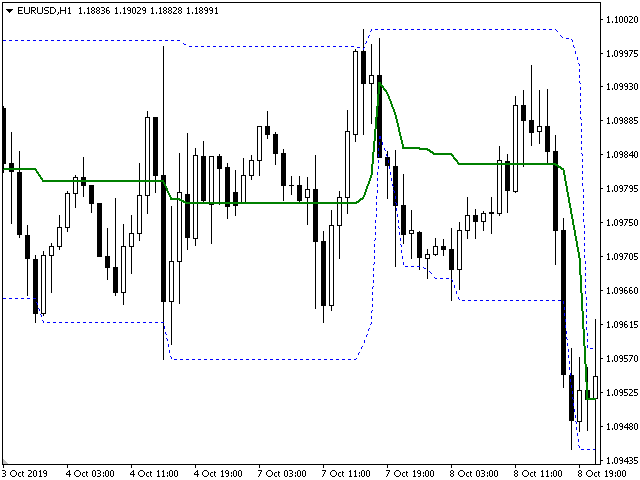
Reversal Prices is an indicator that has a fairly powerful and effective mechanism for adapting to changing market conditions. Reversal Prices - the new word in trend detection! With the development of information technology and a large number of participants, financial markets are less and less amenable to analysis by outdated indicators. Conventional technical analysis tools, such as the Moving Average or Stochastic, in their pure form are not able to determine the direction of the trend or its reversal. The new leading trend indicator uses adaptive four-level anti-aliasing. It allows you to enter the market early. Indicator of a sharp turn to a dynamic change of direction.
推荐产品
Auto Fibo Pro m
DMITRII GRIDASOV
“Auto FIBO Pro” Crypto_Forex 指标 - 是交易中的绝佳辅助工具! - 指标自动计算并放置在图表斐波那契水平和局部趋势线(红色)上。 - 斐波那契水平指示价格可能反转的关键区域。 - 最重要的水平是 23.6%、38.2%、50% 和 61.8%。 - 您可以将其用于反转剥头皮或区域网格交易。 - 还有很多机会可以使用 Auto FIBO Pro 指标来改进您当前的系统。 - 它具有信息价差掉期显示 - 它显示所连接的外汇对的当前价差和掉期。 - 显示屏还显示账户余额、净值和保证金。 - 可以将信息价差掉期显示定位在图表的任何角落: 0 - 左上角,1 - 右上角,2 - 左下角,3 - 右下角。 点击这里查看高质量的交易机器人和指标! 这是仅在此 MQL5 网站上提供的原创产品。
Alpha Trend sign Alpha Trend sign 是我么长期以来非常受欢迎的交易工具,它可以验证我们的交易系统,并且明确的提示交易信号,并且信号不会漂移。 主要功能: •  根据市场显示活跃区域,根据指标可以很直观的判断当前行情是属于趋势行情,还是震荡行情。    并根据指标的指示箭头切入市场,绿色箭头提示买入,红色箭头提示卖出。 •  建议使用5分钟以上的时间周期进行交易,避免因为小周期波动出现频繁的交易信号。 •  您也可以开启信号提示,以免错过最佳的交易时机。 •  本指标不但可以很好的预测趋势行情,也可以在宽幅震荡行情中获利。 •  本指标本着大道至简的原则,适合不同阶段的交易者使用。 注意事项: •  Alpha Trend sign 有明确的进出场信号,不建议逆势操作,以免造成损失。 •  Alpha Trend sign 是特别成熟的指标,我们团队人手一个,使用它可以实现稳定盈利。     
The indicator detects and displays М. Gartley's Butterfly pattern. The pattern is plotted by the extreme values of the ZigZag indicator (included in the resources, no need to install). After detecting the pattern, the indicator notifies of that by the pop-up window, a mobile notification and an email. The pattern and wave parameters are displayed on the screenshots. The default parameters are used for demonstration purposes only in order to increase the amount of detected patterns. Parameters z
The indicator detects and displays Shark harmonic pattern (see the screenshot). The pattern is plotted by the extreme values of the ZigZag indicator (included in the resources, no need to install). After detecting the pattern, the indicator notifies of that by a pop-up window, a mobile notification and an email. The indicator highlights the process of the pattern formation and not just the complete pattern. In the former case, it is displayed in the contour triangles. After the pattern is comple
基于具有标准参数的MACD指标波 在最后两个MACD波上分别对正面和负面交易斐波纳契水平, 如果负波浪在MACD指标上结束,则颜色为绿色, 如果正波在MACD指标上结束,那么颜色为红色。 Wave的终止标准是两个滴答,MACD的符号不同。 在最近四次MACD波浪中绘制趋势线。 与专家合作很好  Figures MACD   https://www.mql5.com/ru/market/product/42031 更多截图: https://www.mql5.com/ru/charts/10581596/audusd-h1-alpari-international https://www.mql5.com/ru/charts/10631979/usdjpy-m1-alpari-international https://www.mql5.com/ru/charts/10628704/gbpusd-m15-alpari-international
Trend Ray
Andriy Sydoruk
The indicator shows the potential trend direction by cyclical-wave dependence. Thus, all the rays of the intersection will be optimal rays, in the direction of which the price is expected to move, taking into account the indicator period. Rays can be used as a direction for potential market movement. But we must not forget that the approach must be comprehensive, the indicator signals require additional information to enter the market.
The indicator detects and displays 3 Drives harmonic pattern (see the screenshot). The pattern is plotted by the extreme values of the ZigZag indicator (included in the resources, no need to install). After detecting the pattern, the indicator notifies of that by a pop-up window, a mobile notification and an email. The indicator highlights the process of the pattern formation and not just the complete pattern. In the former case, it is displayed in the contour triangles. After the pattern is com
High Low Open Close MT4
Alexandre Borela
4.81 (21)
如果你象这个项目一样,就有5个饥饿审查。 这项指标采用了既定价格的公开、高、低价和关闭价格 可以对特定时间区加以调整。 许多机构和专业人士都认为这些是重要的。 贸易商可以为你了解他们可能更进一步的地点, 积极。 现有期间为: 前一日。 前一星期。 曾任Month。 曾任。 前一年。 或: 目前日。 目前周。 目前 Month。 目前配额。 今年。
FREE
VSA Histogram
Richard Bystricky
VSA - P (Volume Spread Analysis) Period-Based Histogram is a tool that visually represents market volume dynamics using Volume Spread Analysis principles, with a focus on highlighting key volume changes over specific time periods. The histogram captures changes in volume and price spread relationships in real-time, enabling traders to detect early signals of accumulation, distribution, and shifts in buying or selling pressure. Indicator is non repainting and working with real-time on tick data.
The   Trendlines Oscillator   helps traders identify trends and momentum based on the normalized distances between the current price and the most recently detected bullish and bearish trend lines. The indicator features bullish and bearish momentum, a signal line with crossings, and multiple smoothing options. USAGE The   Trendlines Oscillator   works by systematically: Identifying pivot highs and lows. Connecting pivots to form bullish (support) and bearish (resistance) trendlines. Measuring
Vanexio
Sayan Vandenhout
VANEXIO USES THE TREND WAVE INDICATOR AND IT CAN IDENTIFY THE BEGINNING AND THE END OF A NEW WAVE TREND MOVEMENT. AS AN OSCILLATOR, THE INDICATOR IDENTIFIES THE OVERBOUGHT AND OVERSOLD ZONES. IT WORKS GREAT TO CATCH THE SHORT TERM PRICE REVERSALS AND USES A MARTINGALE STRATEGY TO CLOSE ALL TRADES IN PROFIT. USE DEFAULT SETTINGS ON H1 OR HIGHER TIME FRAME ON ANY PAIR FOR MORE ACCURATE TRADES WHY THIS EA : Smart entries calculated by 5 great strategies The EA can be run on even a $20000 acco
FREE
Volume Compair
Thiago Pereira Pinho
专业累计德尔塔与成交量中位线指标 通过这款强大的成交量分析工具,追踪 真实的买卖压力 。 成交量比较指标 (Volume Compare Indicator) 结合了 累计德尔塔 (Cumulative Delta) 和 成交量中位线 (Volume Medians) ,帮助您识别机构活动、失衡以及潜在的反转。 主要特点: 累计德尔塔直方图 – 实时可视化净买入成交量与净卖出成交量。 买入/卖出成交量中位线 – 显示平均买入和卖出成交量水平的水平线。 智能成交量分类 – 分隔: 强劲买入(绿色) – 看涨压力。 强劲卖出(红色) – 看跌压力。 买入成交量中位线(蓝色线) – 典型买入量的参考。 卖出成交量中位线(橙色线) – 典型卖出量的参考。 可自定义参数 – 调整 CDIPeriod 和 CDIRange 以设置敏感度。 EMA 平滑成交量 – 减少噪音,使信号更清晰。 如何帮助交易者: 发现机构活动 – 异常的成交量尖峰指示大玩家进场。 确认突破/反转 – 强烈的德尔塔背离警告假动作。 基于成交量的支撑/阻力 – 中位线充当动态
FX Flow
Eva Stella Conti
FX Flow   indicator can be used as an anticipator of the next trend, preferably confirmed by Price Action or another oscillator (RSi, Stochastic ..). It takes the money flows of the major currencies USD EUR GBP AUD NZD CAD CHF JPY into account, and processes them. Excellent tool for indices, but also for correlations between currencies. Works on each timeframes.  Blue line: Bull market Yellow line: Bear market Note : if the indicator opens the window, but does not draw lines, load the historie
Market Profile 3
Hussien Abdeltwab Hussien Ryad
3 (2)
Market Profile 3 MetaTrader 4 indicator  — is a classic Market Profile implementation that can show the price density over time, outlining the most important price levels, value area, and control value of a given trading session. This indicator can be attached to timeframes between M1 and D1 and will show the Market Profile for daily, weekly, monthly, or even intraday sessions. Lower timeframes offer higher precision. Higher timeframes are recommended for better visibility. It is also possible t
FREE
History Pattern Search
Yevhenii Levchenko
该指标建立当前报价,可以与历史报价进行比较,并在此基础上进行价格走势预测。指示器有一个文本字段,用于快速导航到所需日期。 选项: 符号 - 选择指标将显示的符号; SymbolPeriod - 选择指标从中获取数据的时段; IndicatorColor - 指示器颜色; HorisontalShift - 由指标绘制的报价移动指定的柱数; Inverse - true 反转引号,false - 原始视图; ChartVerticalShiftStep - 图表垂直移动(键盘上的向上/向下箭头); 接下来是文本字段的设置,您可以在其中输入日期,您可以通过按“回车”立即跳转到该日期。 接下来是文本字段的设置,您可以在其中输入日期,您可以通过按“回车”立即跳转到该日期。
FlatBreakout
Aleksei Vorontsov
FlatBreakout (Free Version) Flat Range Detector and Breakout Panel for MT4 — GBPUSD Only FlatBreakout is the free version of the professional FlatBreakoutPro indicator, specially designed for flat (range) detection and breakout signals on the GBPUSD pair only. Perfect for traders who want to experience the unique fractal logic of FlatBreakout and test breakout signals on a live market without limitations. Who Is This Product For? For traders who prefer to trade breakout of flat ranges (breakout,
FREE
新的、更準確的 Xmaster 指標版本。來自世界各地的 200 多名交易者在他們的 PC 上對該指標的不同組合進行了 15,000 多次測試,以獲得最有效和最準確的公式。在這裡,我們向您展示“Xmaster 公式指標外匯無重繪”指標,它顯示準確的信號且不重繪。該指標還通過電子郵件和推送向交易者發送信號。隨著每個新報價的到來,它不斷地通過超過 75 個參數分析市場,並向交易者顯示準確的買入和賣出信號。此外,在該指標的幫助下,您可以看到趨勢現在朝著哪個方向發展,以便在正確的方向上進行交易。 新的“Xmaster 公式指標外匯無重繪”指標如何工作,它與舊版本有何不同? 首先,它是最優化的市場分析算法,已被全球不同交易者測試超過 15,000 次。 其次,該指標配備了針對錯誤信號的獨特算法過濾器,這使其成為每個交易者非常有用的工具。它特別適合使用剝頭皮策略進行交易,因為了解價格的每日方向非常重要。而這個新指標很好地說明了這一點。 第三,與舊版本不同,這個新指標“Xmaster 公式指標外匯無重繪”向電子郵件發送信號並推送。為您的交易策略配備如此專業的工具,您一定會在交易中獲得巨大優勢,並能
Smart FVG 指标 MT4 – MetaTrader 4 高级公平价值缺口检测 Smart FVG 指标为 MetaTrader 4 提供专业的公平价值缺口(Fair Value Gap,FVG)检测、监控和告警功能,所有信息都直接显示在图表上。它将基于 ATR 的过滤与结构感知逻辑相结合,帮助你去除噪音、适应流动性,并只保留最关键的不平衡区域,从而做出更加精确的交易决策。 主要优势 精准的 FVG 检测:识别真正的市场低效,而不仅仅是简单的 K 线价格跳空。 基于 ATR 的自适应精度:根据不同市场与周期自动过滤低质量信号。 实时有效性跟踪:当价格填补或突破缺口时,相关区域会被自动延伸、调整或删除。 高度可视化与自定义:可根据任何模板自定义颜色、线型和填充样式。 实用告警功能:对新出现、被填补或被突破的 FVG 提供实时通知。 性能优化:轻量化设计,适合多品种、多周期同时扫描。 工作原理 将指标加载到任意 MT4 品种与时间周期图表上。 算法会扫描历史与实时 K 线,标出当前有效的 FVG 区域。 ATR 逻辑会根据当前波动率和流动性动态调整检测条件。 当价格完全回补缺口
FREE
Trend PA
Mikhail Nazarenko
5 (3)
The Trend PA indicator uses   Price Action   and its own filtering algorithm to determine the trend. This approach helps to accurately determine entry points and the current trend on any timeframe. The indicator uses its own algorithm for analyzing price changes and Price Action. Which gives you the advantage of recognizing, without delay, a new nascent trend with fewer false positives. Trend filtering conditions can be selected in the settings individually for your trading style. The indicator
PZ Penta O MT4
PZ TRADING SLU
2.33 (3)
The Penta-O is a 6-point retracement harmonacci pattern which usually precedes big market movements. Penta-O patterns can expand and repaint quite a bit. To make things easier this indicator implements a twist: it waits for a donchian breakout in the right direction before signaling the trade. The end result is an otherwise repainting indicator with a very reliable trading signal. The donchian breakout period is entered as an input. [ Installation Guide | Update Guide | Troubleshooting | FAQ | A
FREE
Scalping Binary Option Pro is an arrow indicator that is completely free from repainting . Although it may work incorrectly in strategy testers, its signals remain relevant for real trading. Signals: A red arrow pointing down indicates a selling opportunity, while a green arrow pointing up indicates a buying opportunity. Settings: All you need to adjust are the colors of the signal arrows and the sound alert for signal notifications. Usage Recommendations: It is best to use the indicator on hig
Magic Balance
Daniil Evstratenko
The indicator shows which trading pairs, strategies, robots and signals that you use are profitable and which are not. The statistic of trades and balance graph are displayed in the account currency and pips - to switch simply click on the graph. button "$"(top left) - minimize/expand and move the indicator panel button ">"(bottom right) - stretching and resetting to the original size Statistic of trades 1 line - account balance, current profit and lot of open trades; 2 line - the number of all
Koala Supply Demand
Ashkan Hazegh Nikrou
5 (2)
介绍 MetaTrader 4 的 Koala 供需指标(我们鼓励您分享您的评论或反馈 - 无论是正面的还是负面的 - 以便其他交易者可以从您的经验中受益。): 欢迎使用 Koala 供需指标。该指标设计用于识别不间断的供应和需求区域,有助于交易者将市场视为区域,您可以看到价格如何尊重一些强大的区域,该指标还可以在这些区域内形成价格行动信号时显示给您。 加入  Koala Trading Solution 频道  在 mql5 社区中获取有关所有 Koala 产品的最新消息,加入链接如下: https://www.mql5.com/en/channels/koalatradingsolution https://www.mql5.com/en/blogs/post/755700 重要提示 :此产品包含免费的专家顾问(EA)。购买后,请在MQL5 Messenger上与我联系,以获取与指标关联的免费EA。 重要提示: 从1.2版本开始,此指标是多时间框架供需指标,用户可以通过点击按钮在不同时间框架间切换。 主要特点: 图上回测功能:通过独特的图上回测功能体验分析的未来。只需单击图表
FREE
Divergent Accuracy
Yaroslav Varankin
The Divergent Accuracy indicator is designed to identify discrepancies on the price chart of a currency pair. The Divergent Accuracy indicator recognizes bullish and bearish divergences, and can also output a signal that a divergence has been detected... In addition to identifying divergences, the indicator works with overbought and oversold levels, and also shows arrows to enter the market...
AP VWAP Bands Pro (MT4) Volume-weighted average price with ±σ bands for clear intraday bias, mean-reversion zones, and dynamic support/resistance. Works on crypto (incl. BTC), FX, indices, and metals. Uses tick-volume when real volume isn’t available. What it shows VWAP line (volume-weighted mean price). Two envelopes around VWAP (default ±1σ and ±2σ) to highlight balance vs. extension. Reset modes: Day, Week, or Anchor Time (HH:MM) to start VWAP where you need it (e.g., exchange open). Why
FREE
OrderBlock TS Roman
Vladislav Vlastovskii
3.8 (5)
Индикатор строит блоки заказов (БЗ) по торговой системе (ТС) Романа. Поиск блоков осуществляется одновременно на двух таймфремах: текущем и старшем (определяемым в настройках). Для оптимизации и игнорирования устаревших блоков в настройках задается ограничение количества дней в пределах которых осуществляется поиск блоков. Блоки строятся по правилам ТС состоящем из трех шагов: какую свечу вынесли (что?); какой свечой вынесли (чем?); правило отрисовки (как?).
FREE
Free automatic fibonacci
Tonny Obare
4.67 (49)
Free automatic Fibonacci is an indicator that automatically plots a Fibonacci retracement based on the number of bars you select on the BarsToScan setting in the indicator. The Fibonacci is automatically updated in real time as new highest and lowest values appears amongst the selected bars. You can select which level values to be displayed in the indicator settings. You can also select the color of the levels thus enabling the trader to be able to attach the indicator several times with differe
FREE
The Range Directional Force Indicator is designed to help traders analyze market trends, reversals, and directional strength. It focuses on price movements within defined ranges, identifying key moments when the market is gaining momentum or preparing for a shift. By dividing the chart into dynamic price ranges, the indicator detects critical support and resistance levels. It calculates the directional force of price movements, highlighting potential entry and exit points based on market sentim
Diamond Trend
Segundo Calvo Munoz
Indicator which identifies Trend and also buy/sell opportunities. Use for entries aligned to the Trend.  Although Diamond Trend is very accurate identifying entry points, it is always recommended to use a support indicator in order to reconfirm the operation. Remind to look for those Assets and Timeframes which best fit to your trader behavior/need... Valid for Scalping and Long Term operations. Please, set up a Bars Chart to be able to visualize the indicator properly...  ...And remind to give
Tipu Heikin Ashi Panel
Kaleem Haider
4.56 (18)
Tipu Heikin-Ashi Panel is the modified version of the original Heiken Ashi indicator published by MetaQuotes here . A professional version of this indicator is available here . Features An easy to use Panel that shows the Heiken Ashi trend of selected timeframe. Customizable Buy/Sell alerts, push alerts, email alerts, or visual on-screen alerts. Customizable Panel. The panel can be moved to any place on the chart or minimized to allow more space. Heikin means "the average", and Ashi means "foot
FREE
该产品的买家也购买
Meravith
Ivan Stefanov
5 (1)
该指标从每个点分析成交量,并计算该成交量的市场疲劳水平。 它由三条线组成: 牛市成交量疲劳线 熊市成交量疲劳线 表示市场趋势的线。该线根据市场是熊市还是牛市变化颜色。 您可以从任何选择的起点分析市场。一旦达到成交量疲劳线,确定一个新的起点来开始下一次分析。 您可以分析任何内容——趋势和修正。一个好的方法是每次当它达到趋势线或形成顶部或底部时移动指标。 趋势线与某一成交量疲劳线之间的距离越大,说明该方向的成交量越大。 趋势线可以作为开单的位置,而疲劳线则用于收集利润。 该系统非常独特,但又极其直观。 市场上没有类似的产品。 使用没有限制。可以在所有市场和所有时间框架中应用。 重要提示:在MetaTrader4测试器中检查时,双击紫色线条,然后左右移动它以分析市场。 如有任何问题,请随时联系我。
Scalper Inside PRO
Alexey Minkov
4.74 (69)
An exclusive indicator that utilizes an innovative algorithm to swiftly and accurately determine the market trend. The indicator automatically calculates opening, closing, and profit levels, providing detailed trading statistics. With these features, you can choose the most appropriate trading instrument for the current market conditions. Additionally, you can easily integrate your own arrow indicators into Scalper Inside Pro to quickly evaluate their statistics and profitability. Scalper Inside
目前八折优惠! 对任何新手或专家交易者来说都是最好的解决方案! 这个仪表板软件适用于28种货币对。它基于我们的两个主要指标(高级货币强度28和高级货币冲动)。它对整个外汇市场提供了一个伟大的概述。它显示高级货币强度值,货币运动速度和28个外汇对在所有(9)时间段的信号。想象一下,当你可以使用图表上的单一指标观察整个市场,以确定趋势和或剥头皮的机会时,你的交易将得到改善 我们已经在这个指标中建立了一些功能,使你更容易识别强势和弱势货币,同时识别和确认潜在的交易。该指标以图形方式显示货币的强势或弱势是增加还是减少,以及它在所有时间段的表现。 增加的新功能是动态市场斐波那契水平,它适应当前的市场条件变化,这是一个已经在我们的高级货币强度28和高级货币冲动指标中使用的成熟的加分项。 在交易时,总是将弱势货币和强势货币配对,这个新指标将帮助你做到这一点。 用户手册:点击这里  https://www.mql5.com/en/blogs/post/708783 特点  显示每个时间段的ACS28和GAP-speed(冲动)的货币强度值。 列:颜色代码以7种颜色显示货币强度:强势
Currency Strength Exotics
Bernhard Schweigert
4.88 (33)
目前8折优惠! 对任何新手或专家交易者来说都是最好的解决方案! 这个指标是专门用来显示任何符号的货币强度,如异国货币对、商品、指数或期货。它是同类产品中的第一个,任何符号都可以添加到第9行,以显示黄金、白银、石油、DAX、US30、MXN、TRY、CNH等的真实货币强度。这是一个独特的、高质量的、负担得起的交易工具,因为我们已经纳入了一些专有的功能和一个新的公式。想象一下,你的交易将如何改善,因为你能够准确地确定新趋势或剥头皮机会的触发点? 用户手册:点击这里   https://www.mql5.com/en/blogs/post/708876 它适用于所有时间框架。你将很快能够看到TREND! 根据新的基础算法设计,它使识别和确认潜在交易变得更加容易。这是因为它以图形方式显示了8种主要货币和一种符号的强弱。 该指标显示了8种主要货币(澳元加元瑞士法郎欧元英镑日元新西兰美元)的强弱线,再加上一个符号! 该指标显示了符号的真实价值。例如:对于XAUUSD(黄金):价格以美元报价。如果黄金在上涨,你怎么能知道是黄金的强势还是美元的弱势?只有当黄金走强时,我们才会进行交易。该指
本指标是实践实战交易完善的波浪自动分析的指标 !  案例... 注: 波浪分级用西方叫法不习惯,因受到缠论(缠中说禅)命名方式习惯的影响,我是将基础波浪命名为 笔 ,将二级波段命名为 段 ,同时具有趋势方向的段命名为 主趋段 (以后笔记中都是这种命名方式,先告知大家),但是算法上和缠论关系不大切勿混淆.反映的是本人分析盘面总结的 千变万化纷繁复杂的运行规律 . 对波段进行了标准化定义,不再是不同人不同的浪  ,   对人为干扰的画法进行了排除,在严格分析进场起到了关键的作用 . 使用这个指标,等于将交易界面提升美感,抛弃最原始的K线交易带你进入新的交易层次.如果不是为了交易,在宣传上也将使客户观感提升层次. 指标内容: 1. 基础波浪 (笔) : 首先我们找出了价格波动过程中的基础波动拐点,当然他的有序性低,为下一步的计算提供基础. 2. 二级波段( 段 ) :在基础波浪的基础上,通过算法分析得到层级更明显的二级波段,二级波段为波浪提供了分析基础 3. 波浪( 浪 ): 有着更清晰的趋势,更清晰直观的方向.分析一个波浪是否延续,需要看二级波段的形态,分析二级的构成,可以得出波浪后
Looking for a powerful yet lightweight swing detector that accurately identifies market structure turning points? Want clear, reliable buy and sell signals that work across any timeframe and any instrument? Buy Sell Arrow MT Swing is built exactly for that — precision swing detection made simple and effective. This indicator identifies Higher Highs (HH) , Higher Lows (HL) , Lower Highs (LH) , and Lower Lows (LL) with remarkable clarity. It is designed to help traders easily visualize market str
Dynamic Forex28 Navigator
Bernhard Schweigert
4.43 (7)
Dynamic Forex28 Navigator - 下一代外汇交易工具。 当前 49% 折扣。 Dynamic Forex28 Navigator 是我们长期流行的指标的演变,将三种功能合二为一: 高级货币强度 28 指标 (695 条评论)+ 高级货币 IMPULSE 带警报 (520 条评论)+ CS28 组合信号(奖励)。 有关指标的详细信息 https://www.mql5.com/en/blogs/post/758844 下一代强度指标提供什么? 您喜欢的原始指标的一切,现在通过新功能和更高的精度进行了增强。 主要特点: 专有货币强度公式。  所有时间范围内的平滑和准确的强度线。 非常适合识别趋势和精确进入。 动态市场斐波那契水平(市场斐波那契)。  此指标独有的独特功能。 斐波那契应用于货币强度,而不是价格图表。 适应实时市场活动以获得准确的反转区域。 实时市场动量。  第 9 行显示市场是活跃还是被动。 对于定时交易至关重要。 全面的警报和显示。  每种货币最强的买入和卖出动量。 ​​28 对的双重动量买入和卖出。 超买/超卖警告外部范围和止损。 反转
ACB Breakout Arrows
KEENBASE SOFTWARE SOLUTIONS
4.15 (34)
ACB Breakout Arrows 指标通过识别一种特殊的突破形态,为交易者提供关键的入场信号。该指标持续扫描图表中某一方向上趋于稳定的动能,并在主要行情启动之前给出准确的进场信号。  点击此处获取多品种、多周期扫描仪 - ACB Breakout Arrows MT4 专用扫描仪 主要功能 指标自动提供止损和止盈位置。 配备 MTF 多周期扫描仪面板,可跟踪所有时间周期的突破信号。 适用于日内交易者、波段交易者和剥头皮交易者。 采用优化算法,提高信号准确性。 提供特殊目标线,用于设置快速平仓点或无损平移位(Quick Profit Line)。 包括胜率、成功率、平均收益等表现分析指标。 不重绘,信号一旦出现即保持不变。 交易确认 -  建议结合使用 ACB Trade Filter 指标 以过滤低质量信号。 强买入: 上箭头 + 绿色柱状图 + 多头趋势。 强卖出: 下箭头 + 红色柱状图 + 空头趋势。 避免交易 :当柱状图为灰色且趋势为震荡时。 (可选) -  建议使用 KT  支撑与阻力位指标  来避免在关键支撑/阻力区域附近开仓。此类交易可能迅速转为亏损,造成不必
Entry Points Pro
Yury Orlov
4.62 (172)
这是一款 MT4 的趋势指标,可提供准确的入场交易信号,且无重绘或延迟。 它可应用在任何金融资产:外汇、加密货币、贵金属、股票、指数。 最好的结果出现在 M15+ 的时间帧内。 指标的 MT5 版本 重要! 购买后请联系我,以便获取详细指南和奖励。 视频 (6:22) - 一个信号赢取的利润等于指标价格的三倍。 视频 (4:44) - 它如何在测试器中工作,我的提示和技巧。 视频 (1:44) - 有关它如何处理加密货币和指数的几句话。 大多数交易者在 Entry Points Pro 指标的帮助下,在第一个交易周内就改善了他们的交易结果。 Entry Points Pro 指标的益处 入场信号无重绘或延迟 如果信号出现,并得到确认(如果信号所在烛条已收盘),则它不会再消失;不像是重绘指标,它会导致重大的财产损失,因为它们可以在显示信号后再将其删除。 无差错开仓 指标算法可令您找到入场交易(买入或卖出资产)的理想时机,从而提高每位交易者的成功率。 Entry Points Pro 可操作任何资产 它允许您在 MT4 平台上交易任何经纪商提供的加密货币、股票、金属、指数、商品
Hidden Cycles
Lev Vladimirovic Marushkin
5 (1)
Black Friday Sale – Limited Time! Grab Hidden Cycles for only $129 (regular price $179 ). This is your chance to boost your strategy with a powerful, easy-to-use cycle-based trading tool. Offer ends soon — don’t miss it! Based on Universal Laws — NOT Some Guy’s Algorithm: Let the market adjust to the Hidden Cycles Geometry — not the other way around. Most indicators are based on a man-made formula. They often lag, fail over time, or need constant re-optimization.  Hidden Cycles is different.
Adaptive Volatility Range
Stanislav Konin
5 (3)
Adaptive Volatility Range [AVR] is a powerful tool for identifying key trend reversal points. AVR accurately reflects the Average True Range (ATR) of volatility, taking into account the Volume-Weighted Average Price (VWAP). The indicator adapts to any market volatility by calculating the average volatility over a specific period, ensuring a stable rate of profitable trades. You receive not just an indicator but a professional automated trading system , AVR-EA . Advantages: Automated Trading Sys
Royal Wave Pro M4
Vahidreza Heidar Gholami
5 (3)
Royal Wave is a Trend-Power oscillator which has been programmed to locate and signal low-risk entry and exit zones. Its core algorithm statistically analyzes the market and generates trading signals for overbought, oversold and low volatile areas. By using a well-designed alerting system, this indicator makes it easier to make proper decisions regarding where to enter and where to exit trades. Features Trend-Power Algorithm Low risk Entry Zones and Exit Zones Predictions for Overbought and Over
RelicusRoad Pro
Relicus LLC
4.63 (106)
您有多少次购买了一个交易指标,它拥有 出色的回测 、 实盘账户表现证明 以及惊人的数据和 无处不在的统计数据 ,但使用后您却 最终爆仓 ? 您不应该只相信一个信号本身,您需要知道它最初为何出现,而这正是 RelicusRoad Pro 最擅长的! 用户手册 + 策略 + 培训视频 + 带 VIP 权限的私人群组 + 提供移动版本 一种全新的市场视角 RelicusRoad 是外汇、期货、加密货币、股票和指数领域 全球最强大、最好的交易指标 ,为交易者提供 账户增长 所需的所有信息和工具。我们提供 技术分析 和 交易计划 ,帮助 每一位交易者成功 ,无论是 初学者 还是 高级交易者 。 它是一个 关键交易指标 ,提供足够的信息来 预测 未来市场。我们相信一个 完整的解决方案 ,而不是图表上几个毫无意义的不同指标。这是一个 一体化指标 ,显示 信号 、 箭头 + 价格行为 信息,这些信息 无与伦比 且 非常准确 。   RelicusRoad 利用机器学习(AI)技术,为交易者提供必要的信息和工具,帮助他们成为成功且消息灵通的交易者。   利用领先指标预测未来价格 几乎 所有技术指标
OrderFlow Absorption – 專業級MT4買賣差與吸收訊號指標 釋放真正訂單流分析的力量,OrderFlow Absorption 是MetaTrader 4上最強大的買賣差(Delta)直方圖與吸收訊號指標。專為想看清每一個價格波動背後真相的交易者設計,這個工具揭示了隱藏的買賣壓力與推動市場的吸收事件。 功能特色 買賣差直方圖視覺化:   以清晰的色彩直方圖即時顯示買方與賣方壓力。 吸收訊號偵測:   先進邏輯自動辨識多空吸收事件,及早預警潛在反轉。 圖表標記:   吸收訊號直接標示於主圖表,方便視覺辨識。 彈出式警報:   新吸收訊號出現時即時通知。 自訂門檻:   過濾弱訊號,專注高勝率機會。 資源管理:   高效運算,適用於大型圖表也能流暢運行。 全品種兼容:   適用於任何商品與週期,包括外匯、指數、商品等。 簡易整合:   參數簡單,快速上手與調整。 OrderFlow Absorption 的邏輯說明 OrderFlow Absorption 採用專利演算法,能在沒有完整Tick數據的情況下,估算每根K棒的買賣壓力(Delta)。它分析成交量、價格行為、K
Dynamic Scalper System
Vitalyi Belyh
5 (1)
“ Dynamic Scalper System ”指标专为在趋势波内进行剥头皮交易而设计。 已在主要货币对和黄金上进行测试,并可与其他交易工具兼容。 提供顺势短线建仓信号,并提供额外的价格变动支持。 指标原理: 大箭头决定趋势方向。 在趋势波内,我们采用一种生成小箭头形式的剥头皮交易信号的算法。 红色箭头代表看涨方向,蓝色箭头代表看跌方向。 敏感的价格变动线会沿着趋势方向绘制,并与小箭头信号协同作用。 信号运作方式如下:当线在适当时刻出现时,将形成入场信号;在出现线时,持仓;线完成后,平仓。 建议的操作时间范围为M1 - H4。 箭头在当前K线上方形成,如果下一根K线已开仓,则不会重新绘制上一根K线上方的箭头。 输入参数 Trend Wave Period - 趋势方向(大箭头)的周期,改变趋势波的时间间隔。值 1 表示趋势方向的最长持续时间,参数值越大,持续时间越短。 Scalper Arrows Period - 信号箭头(小箭头)的计算周期,改变入场信号的生成频率。值 3 表示最频繁的生成频率,参数值越大,箭头频率越低,准确度越高。 这些参数可以根据不同的时间范
PZ Swing Trading
PZ TRADING SLU
5 (3)
Swing Trading 是第一个旨在检测趋势方向的波动和可能的反转波动的指标。它使用在交易文献中广泛描述的基准摆动交易方法。该指标研究多个价格和时间向量,以追踪总体趋势方向,并检测市场超卖或超买并准备好进行修正的情况。 [ 安装指南 | 更新指南 | 故障排除 | 常见问题 | 所有产品 ] 市场波动的利润不会被窃取 指示器始终显示趋势方向 彩色价格带代表机会基准 彩色虚线表示可能的反转波动 该指标分析其自身的质量和性能 它实现了一个多时间仪表板 可定制的趋势和波动周期 它实现了电子邮件/声音/推送警报 指示器为非重涂或重涂 什么是摇摆交易 摇摆交易是一种尝试在一天到一周内从证券中获得收益的交易方式,尽管某些交易最终可以保持更长的寿命。摇摆交易者使用技术分析来买入弱点和卖出力量,并有耐心等待这些机会的发生,因为在发生一波抛售浪潮之后购买证券而不是陷入抛售更有意义。 机会基准 关于历史数据的大量研究证明,适合于波动交易的市场倾向于在基线价格带上下交易,基线价格带由图表显示,使用平均真实区间计算得出。波动交易者使用基线,该策略是购买常态和卖出躁狂,或做空常态并掩盖沮丧。在没有疲
The BB Reversal Arrows technical trading system has been developed to predict reverse points for making retail decisions. The current market situation is analyzed by the indicator and structured for several criteria: the expectation of reversal moments, potential turning points, purchase and sale signals. The indicator does not contain excess information, has a visual understandable interface, allowing traders to make reasonable decisions. All arrows appear to close the candle, without redrawin
Full Scalping Signal
Leandro Bernardez Camero
FullScalping 是一款 不重绘、不回绘 的指标,专为在任何市场中生成 持续不断的剥头皮入场信号 而设计。非常适合追求激烈行情的激进交易者! 加入频道,获取独家信息和更新: https://www.mql5.com/en/channels/forexnewadvisor 你会注意到它 几乎在每根K线 上都会给出信号,要么是确认趋势,要么是提示关键回调。就像一个全天候运行的雷达为你指引方向。 它是如何工作的?非常简单: 红色箭头 进场 做空 蓝色箭头 进场 做多 始终顺应整体趋势方向进行交易,积极获取 每单15到20点 的利润,并在市场剧烈反转之前迅速退出。 信号 持续不断 ,让你永远不会错过交易机会。目标是通过以下方式实现 高频剥头皮交易 : 大手数交易 低点差(显示在左下角) 宽止损,设在上一次趋势反转附近 你可以观看 实时交易视频 了解操作过程,但它使用起来非常简单,安装完成后即可上手。 它会重绘或回绘吗? 对于箭头类指标,大家最关心的问题之一就是它是否 重绘 或 回绘 。而对于 FullScalping 来说,答案非常明确: 此指标 不会重绘 这意味着
NAM Order Blocks
NAM TECH GROUP, CORP.
3.67 (3)
MT4多時限訂單塊檢測指示器。 特徵 -在圖表控制面板上完全可自定義,提供完整的交互。 -隨時隨地隱藏和顯示控制面板。 -在多個時間範圍內檢測OB。 -選擇要顯示的OB數量。 -不同的OB用戶界面。 -OB上的不同過濾器。 -OB接近警報。 -ADR高低線。 -通知服務(屏幕警報|推送通知)。 概括 訂單塊是一種市場行為,它指示從金融機構和銀行收取訂單。著名的金融機構和中央銀行帶動了外匯市場。因此,交易者必須知道他們在市場上正在做什麼。當市場建立訂單塊時,它會像發生大多數投資決策的範圍一樣移動。 訂單建立完成後,市場將朝著上升和縮小的方向發展。訂單大宗交易策略的關鍵術語是它包括機構交易者正在做的事情。由於它們是主要的價格驅動因素,因此包括機構交易在內的任何策略都可以。 您將在任何時間範圍內實時看到訂單塊,使用我們的控制面板,您將能夠在所選的歷史記錄週期內檢測常規,拒收和未大寫的訂單塊。 現在您可以接收到訂單塊接近警報,我們在MT4上顯示屏幕通知,並將通知推送到您的手機!
The Nihilist 5.0 Indicator includes Forexalien and Nihilist Easy Trend trading strategies and systems. It is composed of an MTF Dashboard where you can analyze the different input possibilities of each strategy at a glance. It has an alert system with different types of configurable filters. You can also configure which TF you want to be notified on your Metatrader 4 platform and Mobile application The indicator has the option to view how could be a TP and SL by using ATR or fixed points, even w
Introducing the Delta Volume Profile Indicator - Unleash the Power of Institutional Precision!  Technical Indicator: Are you ready to trade like the pros? The Delta Volume Profile Indicator is no ordinary tool. It’s a high-precision, cutting-edge indicator that puts the power of institutional-grade trading in your hands. This unique indicator analyses delta volume distribution in real-time, revealing the market's hidden buy/sell imbalances that the biggest financial institutions rely on to antic
Trend Lines PRO
Roman Podpora
5 (1)
趋势线专业版   这是一个专业的工具,可以 自动运行。     揭示真相   转折点   和   重入   主要参与者,并且还展示了更高时间框架的全球水平,这使其成为全面市场分析的必备工具。 得益于可靠的市场噪音过滤和精心设计的算法,信号保持稳定且不会重绘。这使得交易者能够对所接收数据的客观性和决策的正确性充满信心。 适用于寻求可靠趋势分析工具的初学者和经验丰富的交易者。 当与 RFI levels PRO 指标 结合使用时,该指标可发挥其最大潜力 。 该指标以 BOS 线的形式准确地显示了趋势和倾向的真实变化。 您可以立即看到市场真正发生转变的关键点——没有噪音和虚假信号。 它显示了 BOS 线路整个生命周期中的重入和补给区域。 所有点都标有数字——2、3、4等等。 这可以帮助你了解哪些大玩家正在回归并积蓄力量,以便你可以朝着他们的方向努力。 该指标不会重新绘制或重新计算信号——所有计算仅在K线收盘时执行。 图表上会显示水平线和信号,确保完全的可靠性和透明度。 优势 该指标通过BOS线显示真实的趋势变化,使您能够轻松区分重要的趋势反转和市场噪音。它使用三个信号强度级别:
介绍 ON Trade Waves Patterns Harmonic Elliot Wolfe,这是一款高级指标,旨在使用手动和自动方法检测各种市场模式。以下是它的工作原理: 谐波模式: 该指标可以识别出现在您图表上的谐波模式。这些模式对于练习谐波交易理论的交易者非常重要,正如Scott Carney的书《谐波交易第1卷和第2卷》所描述的那样。无论您是手动绘制它们还是依赖自动检测,ON Trade Waves Patterns都可以胜任。 控制面板: 我们配备了一个用户友好的控制面板,它会保存您的图表和时间帧设置,使您可以轻松切换不同配置。您甚至可以最小化它以最大化图表空间。如果您更喜欢使用其他分析工具,只需单击关闭按钮即可隐藏所有指标数据。 模板保存: 当您自定义设置或添加其他指标,如移动平均线或布林带时,该指标会自动保存您的模板。这意味着您可以随时轻松加载您喜欢的设置。 优化显示: 对于Windows 10用户,我们建议调整您的DPI设置以获得高清设备上的最佳屏幕体验。右键单击MetaTrader图标,选择“兼容性”,然后选择“更改高DPI设置”,将其设置为“系统(增强)”。
KT Trend Trading Suite MT4
KEENBASE SOFTWARE SOLUTIONS
KT Trend Trading Suite 是一款多功能指标,它结合了趋势跟随策略和多个突破点作为入场信号。 当新趋势形成后,该指标会提供多个入场机会,让交易者能够顺势而为。为了避免不重要的入场点,还引入了回调阈值的概念。 MT5版本可在此处获取  https://www.mql5.com/en/market/product/46270 功能特点 将多种市场动态纳入一个公式中,以清晰展现市场趋势。 绘制矩形框标记入场信号,并配合局部高点和低点进行定位。 指标会自动评估自身信号的准确性,并提供多个简明的性能指标。 内置多周期仪表盘,扫描所有可用时间周期,并显示每个周期内的趋势方向。 输入参数 History Bars:   用于分析历史信号的K线数量。  Signals Period:   整数值,决定入场信号的强度。 Pullback Depth:   整数值,决定趋势继续前常见的回调深度。 Trend Period:   整数值,用于判断主要趋势方向。 Show MTF Dashboard:   显示/隐藏多周期扫描仪表盘。 Performance Analysis:
The Super Arrow Indicator provides non-repainting buy and sell signals with exceptional accuracy. Key Features No repainting – confirmed signals remain fixed Clear visual arrows: green for buy, red for sell Real-time alerts via pop-up, sound, and optional email Clean chart view with no unnecessary clutter Works on all markets: Forex, gold, oil, indices, crypto Adjustable Parameters TimeFrame Default: "current time frame" Function: Sets the time frame for indicator calculation Options: Can be set
Beast Super Signal
Dustin Vlok
4.73 (89)
正在寻找可以帮助您轻松识别有利可图的交易机会的强大外汇交易指标? Beast Super Signal 就是您的不二之选。 这个易于使用的基于趋势的指标持续监控市场状况,寻找新的发展趋势或跳入现有趋势。当所有内部策略一致且彼此 100% 融合时,Beast Super Signal 会发出买入或卖出信号,无需额外确认。当您收到信号箭头警报时,只需买入或卖出。 购买后给我留言,让我加入我的私人 VIP 群组! (仅限购买完整产品)。 购买后给我发消息以获取最新的优化设置文件。 此处提供 MT5 版本。 在此处 获取 Beast Super Signal EA。 查看评论部分以查看最新结果! Beast Super Signal 根据您偏好的 1:1、1:2 或 1:3 风险回报率建议入场价、止损和获利水平,让您放心交易。这个 Beast Super Signal 是 100% 不可重新绘制的,这意味着它永远不会重新计算或重新绘制,每次都能为您提供可靠的信号。 Beast Super Signal 指标适用于所有时间范围,包括货币对、指数、商品和加密货币对。 Beast Su
GOLD Impulse with Alert
Bernhard Schweigert
4.64 (11)
这个指标是我们2个产品 Advanced Currency IMPULSE with ALERT  +   Currency Strength Exotics 的一个超级组合。 它适用于所有时间框架,并以图形方式显示8种主要货币和一种符号的强势或弱势冲动! 该指标专门用于显示任何符号的货币强度加速,如黄金、异国货币对、商品、指数或期货。这是它的第一个指标,任何符号都可以被添加到第9行,以显示黄金、白银、石油、DAX、US30、MXN、TRY、CNH等的真实货币强度加速(冲动或速度)。 建立在新的基础算法上,它使识别和确认潜在的交易更加容易。这是因为它以图形方式显示了一种货币的强势或弱势是否正在加速,并测量了这种加速的速度--把它想象成你汽车中的速度表。当你加速时,事情显然会发生得更快,这在外汇市场上也是一样的,即如果你配对的货币正在向相反的方向加速,你就会发现一个潜在的有利可图的交易。 动态市场斐波那契28水平被用作警报触发器,将适应市场活动。如果冲动击中黄色触发线,你将收到警报。然后你就知道作为一个交易员应该做什么。货币对和方向已经给出。只需点击警报按钮,就可以切换到该货
Volatility Trend System - a trading system that gives signals for entries. The volatility system gives linear and point signals in the direction of the trend, as well as signals to exit it, without redrawing and delays. The trend indicator monitors the direction of the medium-term trend, shows the direction and its change. The signal indicator is based on changes in volatility and shows market entries. The indicator is equipped with several types of alerts. Can be applied to various trading ins
Elliott Wave Trend MT4
Young Ho Seo
4 (7)
Elliott Wave Trend was designed for the scientific wave counting. This tool focuses to get rid of the vagueness of the classic Elliott Wave Counting using the guideline from the template and pattern approach. In doing so, firstly Elliott Wave Trend offers the template for your wave counting. Secondly, it offers Wave Structural Score to assist to identify accurate wave formation. It offers both impulse wave Structural Score and corrective wave Structure Score. Structural Score is the rating to sh
PZ Divergence Trading
PZ TRADING SLU
5 (2)
棘手的发现和频率稀缺是最可靠的交易方案之一。该指标使用您喜欢的振荡器自动查找并扫描常规和隐藏的发散。 [ 安装指南 | 更新指南 | 故障排除 | 常见问题 | 所有产品 ] 容易交易 发现常规和隐藏的分歧 支持许多知名的振荡器 根据突破实现交易信号 显示适当的止损和获利水平 可配置的振荡器参数 可自定义的颜色和尺寸 按条形过滤大小差异 实现绩效统计 它实现了电子邮件/声音/视觉警报 为了提供广阔的市场前景,可以使用不同的振荡器在同一张图表中多次加载该指标,而不会产生干扰。该指标支持以下振荡器: RSI CCI MACD OSMA 随机 动量 很棒的振荡器 加速器振荡器 威廉姆斯百分比范围 相对活力指数 由于差异可能会扩大很多,尤其是在外汇市场中,因此该指标产生了转折:它在等待交易突破之前等待donchian突破确认差异。最终结果是带有非常可靠的交易信号的重新粉刷指示器。 输入参数 幅度:用于寻找差异的之字形周期 振荡器-选择要加载到图表的振荡器。 突破期-交易信号的突破期,以柱为单位。 发散类型-启用或禁用发散类型:隐藏,常规或两者。 最小散度单位为条形-最小散度单位为条形
作者的更多信息
Trend Detects
Oleksii Ferbei
The intelligent algorithm of the Trend Detects indicator shows the points of potential market reversal. Strategy for trend trading, filtering market noise and all the necessary functions built into one tool! The system itself shows in the form of arrows when to buy and when to sell. Uses only one parameter for settings. Simple, visual and effective trend detection. Most often, a good trend is visible on the price chart visually. But an experienced trader must clearly understand the current bal
Trend Ex
Oleksii Ferbei
Trend Ex is an author’s indicator of which you will not find anywhere else. This indicator allows you to find the most likely points of a trend reversal, a trend indicator for the MetaTrader 4 trading platform. A simple but effective system for determining the forex trend. From the screenshots you can see for yourself the accuracy of this tool. It works on all currency pairs, stocks, raw materials, cryptocurrencies. An alert system (alert, email notifications) will help to monitor several trad
Determined Trend
Oleksii Ferbei
Determined Trend is a direction indicator for determining a trend. You need to understand that any dial indicator is just a visual waveform. As a rule, such Forex indicators contain a whole trading system, process information from several technical instruments and the appearance of its “arrow”? final calculation result. The indicator itself evaluates how strong a signal appears in the market, signals about it, and the trader can only make a trading decision. The Determined Trend indicator vis
Reflector
Oleksii Ferbei
Reflector is an auxiliary tool for technical analysis, which helps to determine the direction of the trend: either upward or downward price movement on the selected trading instrument. The indicator is an indicator of a trend type; it smooths out price fluctuations during signal formation by averaging data. The indicator uses calculations designed to smooth out sharp fluctuations that do not affect the overall picture of price movement. A trend can be increasing (bullish trend) and decreasing
Icebreaker
Oleksii Ferbei
Icebreaker trend indicator provides an opportunity to classify the direction of price movement, determining its strength. The solution to this problem helps to enter the market on time. You can not only see the direction of the trend but also the levels by which you can work. The indicator determines the prevailing trend in the price chart. But not only, but also analyzes the price movement, and indicate the points of possible reversals. This contributes to the quick and optimal opening of buy
Unexpected
Oleksii Ferbei
The Unexpected indicator is surprisingly easy to use. You will appreciate the simplicity of the indicator in the very first days of trading. If you correctly determine the beginning of the trend, the result of the transaction will be appropriate. Trading based on trend indicators is the simplest and often the most effective. If you use a live binary options chart as a base, the chances of success are even higher. This indicator can track the steady price movement in a certain direction. In thi
Fact
Oleksii Ferbei
Fact shows favorable moments for entering the market. The indicator can work both for entry points, and as the filter. Uses two settings. This is a hybrid trend indicator, as it is based on the signals of elementary indicators and a special algorithm for analysis. The intelligent indicator algorithm accurately detects the trend, filters market noise and generates input signals. The indicator uses a color alarm: blue - when changing from descending to ascending, and red - on the contrary, to d
Troopers
Oleksii Ferbei
All the points of intersection of the Troopers indicator will be points at which the trend direction changes. Sharp price fluctuations are ignored as well as noise around average prices. Signal points, where the color changes, can be used as potential market reversal points. The indicator tracks the market trend with very high reliability. This development can be used both for long-term trading and for pipsing on small periods. The indicator algorithm implements a kind of technical analysis base
Primary Trend
Oleksii Ferbei
Primary Trend is a handy tool if you are used to trading on a clean chart, but sometimes you need to take a look at Primary Trend. The Primary Trend indicator studies price action as a collection of price and time vectors, and uses the average vector to determine the direction and strength of the market. This indicator highlights the short-term direction and strength of the market. The indicator is not redrawn. The indicator implements a breakout strategy. The arrows show the direction of the ma
Your Chance
Oleksii Ferbei
The Your Chance indicator studies price action as a collection of price and time vectors, and uses the average vector to determine the direction and strength of the market. It also estimates the market trend based on rough measurements of price movement. This indicator is confirming and can be especially useful for traders looking for price movements. This indicator highlights the direction and strength of the market and can be used to trade price fluctuations.
Unexpected Decision is a trend indicator that uses an original calculation algorithm. This is a new product that allows you to identify the current market phase (uptrend, downtrend or flat). The indicator is applicable for any data and periods. The middle of the trend wave, as well as the edges, are places of special heat and market behavior; when writing the indicator, an attempt was made to implement precisely finding the middle. This indicator paints arrows in different colors depending on th
Trend Analytics
Oleksii Ferbei
Trend Analytics is a technical analysis indicator that allows you to determine with sufficient probability when a trend and its direction or flat prevail in the foreign exchange market. The indicator is built on special algorithms. The dignity of which you see in the screenshots. The indicator can work on any timeframe, but to minimize the likelihood of false signals, you should set a timeframe from H15 and higher. In this case, you should use a small stop loss to protect against false signals.
The Trends Definitive indicator does not redraw and does not lag, it shows points for entering the market, points of potential market reversal. Uses one parameter for settings. Currency pairs never rise or fall in a straight line. Their ups and downs are interspersed with pullbacks and reversals. Every rise and every fall is reflected in your emotional state: hope is replaced by fear, and when it passes, hope appears again. The market uses your fear to prevent you from taking advantage of a st
Progres
Oleksii Ferbei
The Progres indicator uses calculations designed to smooth out sharp fluctuations that do not affect the overall picture of price movement. This is an auxiliary tool for technical analysis, which helps to determine the direction of the trend: either upward or downward price movement on the selected trading instrument. The indicator is a trend-type indicator; it smooths out price fluctuations during signal formation by averaging data. The trend can be ascending (bullish) and decreasing (bearis
Trends Target
Oleksii Ferbei
Trend Target analyzes the main parameters of Forex, helps to obtain information about the current position of all market transactions for a particular asset. Trend Target makes it possible to classify the direction of price movement by determining its strength. Solving this problem helps to enter the market on time. You can not only see the direction of the trend, but also the levels that you can work with. The indicator also allows plotting levels. Quickly identifies support and resistance li
Compasss
Oleksii Ferbei
The principle is very simple, practical and effective - they are implemented in the Compass indicator, which will help traders to protect their deposit from loss. This is one of the implementations of the indicator for protecting a position from loss. Similar implementations exist, this is not a complex algorithm. The indicator uses a series of moving averages, which, with a given Length step, form the resulting lines that are displayed on the price chart as blue and red lines. These lines are t
Consequence
Oleksii Ferbei
The Consequence indicator determines the moments of the trend reversal and the direction of its movements. He will provide you with everything you need to overcome the losses due to human emotions. Consequence is equipped with the most advanced, adaptable and profitable trading algorithms. It's time to stop wandering in the dark and gain a clear vision of goals in intraday trading, for which this indicator was created. One of the secrets of short-term trading is knowing when to enter a trade.
Star 4D
Oleksii Ferbei
The peculiarity of Star 4D is the presence of a signal for entry / exit - the indicator line denotes "buy" or "sell" signals in a certain color. The accuracy of this signal is quite acceptable, see and judge for yourself. Star 4D is also good for getting out of position. The indicator almost completely captures the trend, but filters must be used during a flat. When entering a position, you will always follow the trend. This great property makes Star 4D more attractive.
Ferbey
Oleksii Ferbei
The intelligent algorithm of the Ferbey indicator shows potential reversal points of the market with a high probability. The Ferbey indicator is perfect for trend trading! If you trade with the trend, then a trading strategy based on this indicator will suit you perfectly. The indicator filters out market noise, practically all and all the necessary functions for working on a thread are built into one tool. Works on all currency pairs and on all timeframes, the indicator setting is at your req
Trend Regulator
Oleksii Ferbei
Most often, a good trend is visible on a price chart visually. But an experienced trader should clearly understand the current balance of power in the market before entering. The Trend Regulator indicator will help the trader to make decisions by helping him with the appropriate signals. The intelligent algorithm of the Trend Regulator indicator shows the points of potential market reversal. A strategy for trading with the trend, filtering market noise and all the necessary features built into o
Identify Take
Oleksii Ferbei
4.5 (2)
Identify Take - trend trading strategy, market noise filtering and all necessary functions built into one tool! The system itself shows in the form of arrows when to buy and when to sell. Uses only one setting parameter. Simple, visual and effective trend detection. The intelligent algorithm of the Identify Take indicator shows the points of a potential market reversal. Most often, a good trend can be seen visually on the price chart. But an experienced trader must clearly understand the curre
Easys Trends
Oleksii Ferbei
The Easy Trends indicator gives the trader the ability to visually determine which trend will be present at a particular time interval. It smooths out price fluctuations during signal formation by averaging the data. This is an auxiliary tool for technical analysis, which helps to determine the exact direction of the trend: either upward or downward movement of the price of a trading instrument. Although the indicator lags a little, it still generates the most reliable signals that a trader ca
The new Analytical Concentration leading trend indicator uses adaptive anti-aliasing. It allows you to enter the market early. Indicator of a sharp turn to a dynamic change of direction. The Analytical Concentration indicator gives the trader the ability to visually determine which trend will be present at a particular time interval. An indicator that has a sufficiently powerful and effective mechanism for adapting to changing market conditions. A new word in trend detection! It smooths out pr
Trend Protection Indicator Uses one parameter for settings. Currency pairs never rise or fall in a straight line. Their ups and downs are interspersed with pullbacks and reversals. The indicator does not redraw and does not lag, it shows points for entering the market, points of potential market reversal. Every rise and every fall is reflected in your emotional state: hope gives way to fear, and when it passes, hope reappears. The market uses your fear to prevent you from taking advantage of a
Pyro Trend
Oleksii Ferbei
Pyro Trend is a new product that allows you to identify the current market phase (uptrend, downtrend or flat). The indicator is applicable for any data and periods. The middle of the trend wave, as well as the edges, are places of special heat and market behavior; when writing the indicator, an attempt was made to implement precisely finding the middle. Pyro Trend is a trend indicator that uses an original calculation algorithm. This indicator paints arrows in different colors depending on the
Trinitron
Oleksii Ferbei
Индикатор Trinitron создан для того чтобы отображать тренд в наглядном виде. Одним из главных определений для мониторинга рынка валют является тренд. Тренд - это устойчивое направление движения цены. Для его нахождения индикатор использет расчёты, призванные сглаживать резкие колебания, не влияющие на общую картину движения цены. Тренд может быть возрастающим (бычий тренд) и убывающий (медвежий тренд). В большинстве случаев тренд растёт долго и резко падает, но во всём бывают исключения. На дв
Explosive Trend
Oleksii Ferbei
The indicator analyzes the chart as a mathematical function with X-time and Y-price axes. Time is presented in bars, price in pips. The purpose of the analysis is to give the user a signal to action at the moment when the function forms a recoilless movement in one direction over a certain period of time. The indicator parameters must be selected for each currency pair, since the price function is formed differently for each currency pair. Shows favorable moments for entering the market with a
Trend Navigato
Oleksii Ferbei
The Forex indicator   TrendNavigator   is a technical indicator. TrendNavigator is a tool that allows traders employing this strategy to better understand what is happening in the market and predict in which direction the price will continue to move. The indicator's values are calculated based on price movements of the currency pair or any other financial asset. Within the scope of technical analysis, the TrendNavigator indicator is used by traders to forecast future price values or the overall
Trends Finder
Oleksii Ferbei
"Trend Finder" is a trend trading strategy that combines market noise filtration and all necessary functions in one tool! The system automatically displays entry and exit points using arrows. Only one parameter is sufficient for configuration. It offers simple, intuitively understandable, and effective trend detection. The intelligent algorithm of the "Trend Finder" indicator identifies potential market reversal points. Often, a good trend can be visually observed on the price chart. However, a
SafeSeries Manager is a professional multi-currency trading robot for MetaTrader 5, designed for adaptive trading in volatile market conditions. Its core strengths are intelligent order series management, advanced risk control tools, and a flexible entry signal system. SafeSeries Manager aims for consistent profits while minimizing drawdowns and maintaining control over trading activity. Recommended minimum deposit: 10,000 units of the base currency. Key Features Intelligent Series Management —
筛选:
无评论
回复评论