VWAP Indicator MT5
- 指标
-
Kyra Nickaline Watson-gordon
 Experienced Developer (Experts / Indicators / Utilities ...)
Account Manager (Investment Manager) - 版本: 1.3
- 更新: 1 十二月 2023
- 激活: 10
Description :
VWAP (Volume-Weighted Average Price) is the ratio of the value traded to total volume traded over a particular time horizon. It is a measure of the average price at which pair is traded over the trading horizon. Read More.
All Symbols and All Timeframes are supported.
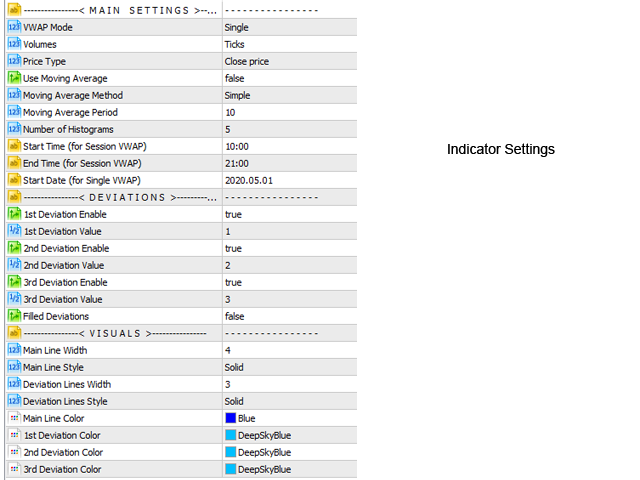
Indicator Inputs :
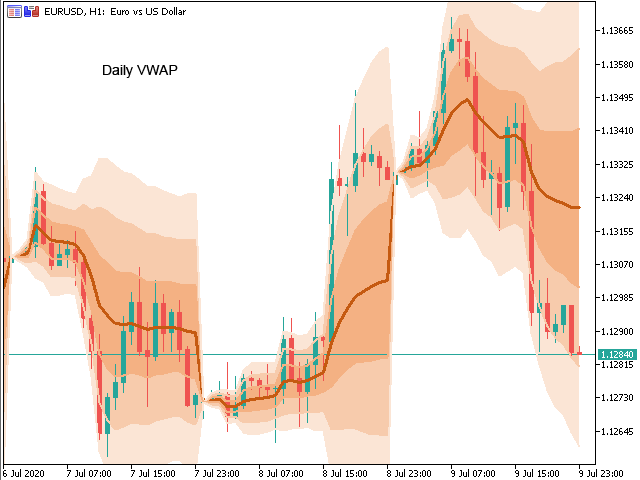
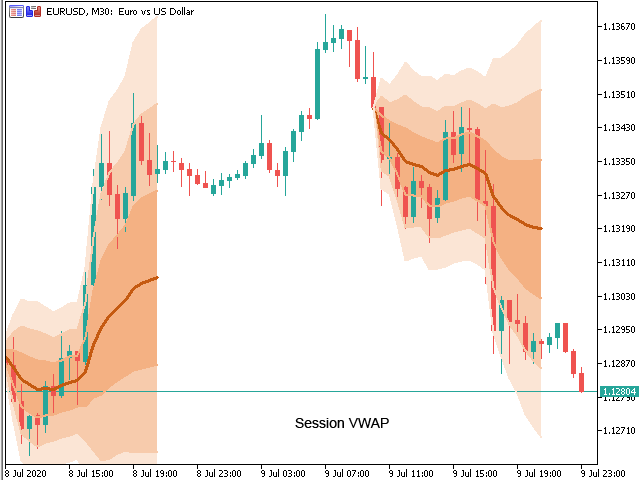
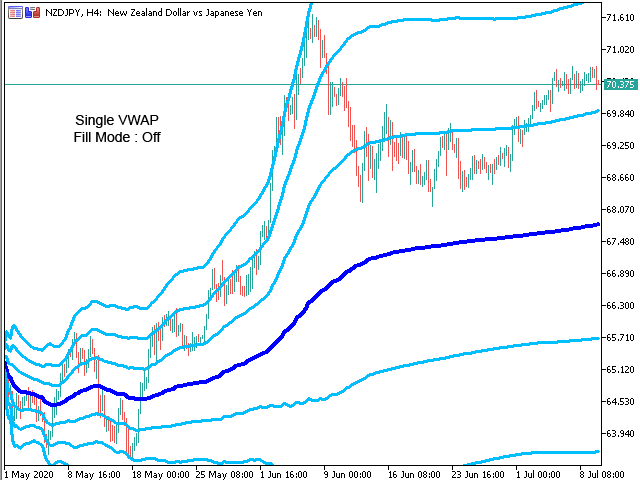
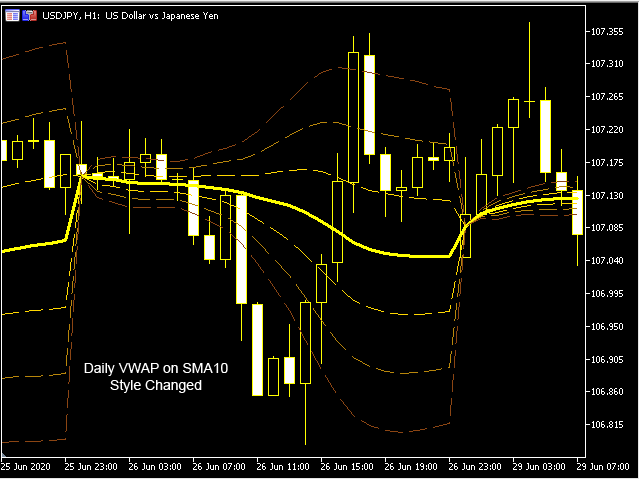
VWAP Mode : Mode of VWAP Calculation. Options can be selected : Single,Session,Daily,Weekly,Monthly
Volumes : Real Volumes,Tick Volumes
Price Type : Used price for calculating. Options : Close,Open,High,Low,Median,Typical,Weighted
Use Moving Average : If selected, must enter Moving Average Method, Moving Average Period
Start Time and End Time : Is used only for Session VWAP
Start Date : Is used for Single VWAP only
Max Number of Candles : Number of bars to proceed.
Deviations Settings : Enable/Disable and Deviation Values
Graphical Options : Filling/Colors/Widths/Styles
Alert/Notification Options : Closed Candle Crossing / Price breakout
Tips :
- You can attach more than one indicator to a chart with different settings in these cases :
- If you want multiple sessions on a day,
- If you want 2 or more histograms overlapping each other
Versions :
Visit our other useful utilities, Indicators and experts here.