• 概述
  • 评论 (3)
  • 评论 (1)
  • 新特性

Fixed Range Volume Profile MT5

带有 MT5 警报的自动固定范围交易量配置文件

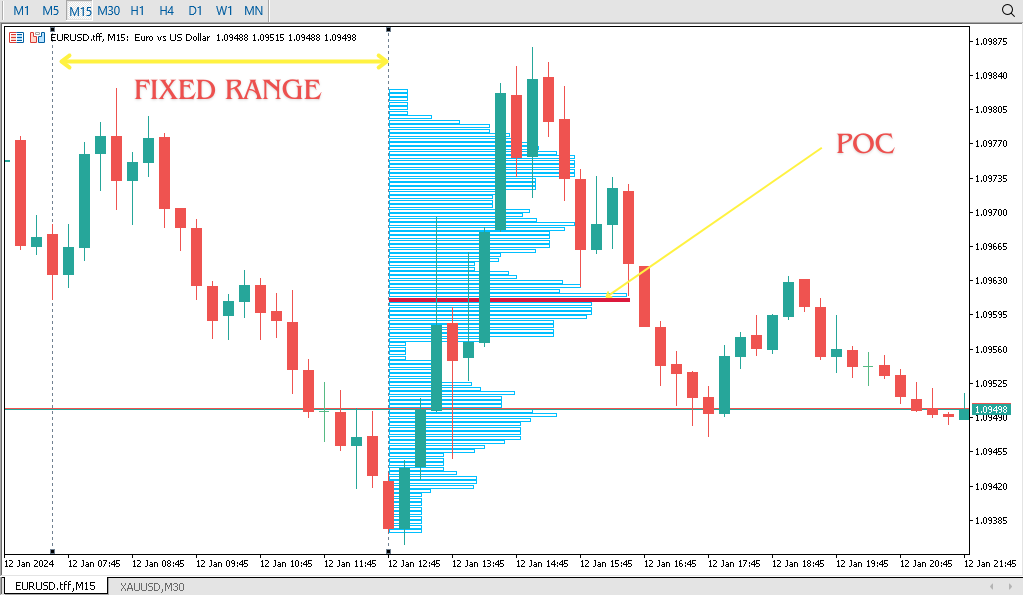
该指标显示价格花费更多时间的位置,突出可用于交易的重要水平。

并且可以显示随时间变化的价格密度,概述给定交易时段最重要的价格水平、价值区域和控制价值。 该指标可以附加到 M1 和 D1 之间的时间范围,并将显示每日、每周、每月甚至日内时段的市场概况。 较低的时间范围提供更高的精度。 建议使用更高的时间范围以获得更好的可见性。 还可以使用自由绘制的矩形会话在任何时间范围内创建自定义市场概况。 六种不同的配色方案可用于绘制配置文件的块。 也可以将配置文件绘制为纯色直方图。 或者,您可以选择根据看涨/看跌柱线为配置文件着色。 该指标基于裸价行为,不使用任何标准指标。

一个警报系统可用于价格跨越价值区域的高低、中值和单一打印区域的水平。

输入设置:

StartFromDate(默认 = __DATE__)— 如果 StartFromCurrentSession 为假,则指标将从该日期开始绘制配置文件。 它吸引了过去。 例如,如果您将其设置为 2018-01-20 并且 SessionsToCount 为 2,则它将绘制 2018-01-20 和 2018-01-19 的配置文件。


时段(默认 = 每日)— 市场概况的交易时段:每日、每周、每月、盘中和矩形。 要计算矩形会话,应将名称以 MPR 开头的矩形图表对象添加到图表中。 在键盘上按“r”将自动添加一个正确命名的矩形对象。


StartFromCurrentSession(默认 = true)— 如果为 true,则指标从今天开始绘制,否则 — 从 StartFromDate 中给出的日期开始绘制。


SeamlessScrollingMode(默认值 = false)— 如果为真,则忽略 StartFromDate 和 StartFromCurrentSession 参数; 会话从当前图表位置最右边的柱开始计算和显示。 这允许无限期地向后滚动以查看过去的会话。


ValueAreaPercentage(默认值 = 70)— 要包含在价值区中的会话 TPO 的百分比份额。


SessionsToCount(默认 = 2)— 绘制市场概况的交易时段数。
EnableDevelopingPOC(默认 = false)— 如果为 true,将绘制多条水平线来描述控制点在整个会话中的发展情况。
推荐产品
Market Profile Heat indicator  — is a classic Market Profile implementation that can show the price density over time, outlining the most important price levels, value area, and control value of a given trading session. This indicator can be attached to timeframes between M1 and D1 and will show the Market Profile for daily, weekly, monthly, or even intraday sessions. Lower timeframes offer higher precision. Higher timeframes are recommended for better visibility. It is also possible to use a fr
BoxChart MT5
Evgeny Shevtsov
5 (7)
The market is unfair if only because 10% of participants manage 90% of funds. An ordinary trader has slim changes to stand against these "vultures". This problem can be solved. You just need to be among these 10%, learn to predict their intentions and move with them. Volume is the only preemptive factor that faultlessly works on any timeframe and symbol. First, the volume appears and is accumulated, and only then the price moves. The price moves from one volume to another. Areas of volume accumu
Head and Shoulders Visual Indicator for MetaTrader 5 The Head and Shoulders Visual Indicator for MetaTrader 5 is designed to identify two key reversal patterns: the Head and Shoulders Top (Bearish) and the Head and Shoulders Bottom (Bullish). This tool is ideal for spotting market turning points and anticipating trend reversals. «Indicator Installation & User Guide» MT5 Indicator Installation  |  Head and Shoulders Visual Indicator MT4  | ALL Products By  TradingFinderLab  | Best MT5 Indicator: 
FREE
Boom coins indicator and crash coins
Waleed Hamood Said Al Rawahi
YouTube上的指標直播。更多可信度請點擊下面的鏈接。還有指標的視頻可以觀看。注意直播晚了,不要依賴,只有對指標的回顧僅回顧指標的準確性,幾乎不輸,利潤率達到 95%。我將在 CRASH coin 1000 INDICES 上非常準確地工作 YouTube上的指標直播。更多可信度請點擊下面的鏈接。還有指標的視頻可以觀看。注意直播晚了,不要依賴,只有對指標的回顧僅回顧指標的準確性,幾乎不輸,利潤率達到 95%。我將在 CRASH coin 1000 INDICES 上非常準確地工作 YouTube上的指標直播。更多可信度請點擊下面的鏈接。還有指標的視頻可以觀看。注意直播晚了,不要依賴,只有對指標的回顧僅回顧指標的準確性,幾乎不輸,利潤率達到 95%。我將在 CRASH coin 1000 INDICES 上非常準確地工作
VP hidden
Emr Aljnaby
4.22 (9)
The indicator works to convert normal volume into levels and determine financial liquidity control points. It is very similar in function to Fixed Volume Profile. But it is considered more accurate and easier to use than the one found on Trading View because it calculates the full trading volumes in each candle and in all the brokers present in MetaTrade, unlike what is found in Trading View, as it only measures the broker’s displayed prices. To follow us on social media platforms: telegram
FREE
Mt5 Market Profile
Mcblastus Gicharu Ndiba
Market Profile Introducing the Market Profile MetaTrader Indicator—your gateway to mastering market dynamics with precision and insight. This powerful tool delivers a classic Market Profile analysis, revealing price density over time and highlighting crucial levels, including the value area and control value for any trading session.  Compatible with timeframes from M1 to D1, it adapts to daily, weekly, monthly, or even intraday sessions, offering you unmatched flexibility. Lower timeframes prov
UT Alart Bot
Menaka Sachin Thorat
5 (2)
To get access to MT4 version please click  https://www.mql5.com/en/market/product/130055&nbsp ; - This is the exact conversion from TradingView: "Ut Alart Bot Indicator". - You can message in private chat for further changes you need. Here is the source code of a simple Expert Advisor operating based on signals from Ut Bot Indicator . #property copyright "This EA is only education purpose only use it ur own risk" #property link " https://sites.google.com/view/automationfx/home " #property versio
FREE
Session CVD
Riccardo Moreo
This is the Cumulative Volume Delta (CVD) , it's an indicator that calculates the long and short volumes plotting it then as a line on the chart, the most efficient way to use this indicator is by comparing the CVD line to the current chart and looking at the Divergence beetween the two of them, so that you can identify fake-outs and liquidty sweeps. for example in the picture that i put below you can see that the price has made a lower low but the CVD didn't, that means the volumes didn't suppo
FREE
TimeFrameLow milliseconds
Israel Goncalves Moraes De Souza
O indicador mostra o preço ou volume em milissegundos, ótimo para identificar padrões de entrada por agressão de preço ou volume e escalpelamento rápido. Características Período de tempo do WPR em milissegundos Oscilador de agressão de preço Tela personalizável O indicador pode indicar movimentos de entrada, como: Cruzamento da linha 0.0 Identificando padrões de onda A velocidade de exibição do gráfico dependerá do seu hardware, quanto menores os milissegundos, mais serão necessários do hardwar
FREE
Tick Profile Free
Elia Burstein
5 (2)
This indicator will show a vertical representation of the volume distribution within a selected user range. This is a free version of the full product. It is limited to use on a week old data or older. Find the full product at  https://www.mql5.com/en/market/product/42234 . Main features: This Indicator will create an image that will allow viewing the tick volume per price level in a graphical form. The indicator will work on any range size in any time-frame, limited only by your computer mem
FREE
TPSpro RFI Levels MT5
Roman Podpora
4.55 (20)
反转区域 / 峰值交易量 / 主要参与者的活跃区域 =       TS TPSPRO系统 俄语使用说明     /       指示     英语     /           MT4版本      该指标的每位购买者还可免费获得: 6 个月内可访问 RFI SIGNALS 服务的交易信号 - 根据 TPSproSYSTEM 算法准备的切入点。 定期更新的培训材料 - 让您沉浸在策略中并提高您的专业水平。 工作日每天 24 小时提供支持,并可以访问封闭的交易者聊天室 - 沟通、协助和市场情况分析。 作者设定的文件——自动指标设置,无需额外努力即可实现最大效果。 主要功能: 显示卖家和买家的活跃区域! 指标显示所有正确的买入和卖出第一脉冲水平/区域。当这些水平/区域被激活时,即开始寻找切入点的地方,水平会改变颜色并填充特定颜色。还会出现箭头,以便更直观地了解情况。 LOGIC AI - 激活模板时显示用于搜索入口点的区域(圆圈) 为了提高视觉清晰度,添加了使用人工智能搜索入口点的显示区域的功能。 显示更高时间范围内的级别/区域(MTF 模式) 添加了使用更高时间间隔显示级别/区域
Z Score Plus MT5
Eduardo Da Costa Custodio Santos
The utility displays the order book, as well as increases its depth, remembering the location of applications that have gone beyond the current "window" view. With the utility user can perform quick trading actions in one click - placing/cancelling/editing of explicit and hidden orders, and also opening/editing positions. Utility features The orders book display works only on those trading symbols for which it is broadcast by the broker. To reset the information about the rows that were recorde
Forex Volume MT5
KEENBASE SOFTWARE SOLUTIONS
KT Forex Volume 以彩色柱状图的形式显示货币对的买入和卖出成交量。成交量由某一资产的买入和卖出交易构成。 在外汇市场中: 如果买入量大于卖出量,该货币对的价格通常会上涨。 如果卖出量大于买入量,该货币对的价格通常会下跌。 功能特点 通过使用点差成交量数据进行确认,避免不良交易。 帮助您跟随市场上的大资金参与者。 集成所有 Metatrader 警报提醒功能。 关于 Tick 成交量的使用 与其他市场不同,现货外汇市场是一个非集中式市场,因此零售交易者很难获得真实准确的成交量数据。 资深外汇交易员 Caspar Marney 于 2011 年提交的一份研究报告指出,Tick 成交量与实际成交量之间存在高度相关性和准确性。 柱状图计算公式 KT Forex Volume 指标基于 Chaikin 振荡器计算得出。该振荡器由 Marc Chaikin 提出,通过测量快速和慢速移动平均线之间的累积/分布关系来构建。 N = [(收盘价 - 最低价) - (最高价 - 收盘价)] / (最高价 - 最低价) M = N * 成交量(周期) ADL = M(前一周期) + M
Haven Volume Profile
Maksim Tarutin
4.4 (5)
Haven Volume Profile 是一个多功能的成交量剖面分析指标,帮助基于交易量分布识别关键价格水平。它旨在为专业交易者提供更深入的市场理解,并帮助识别重要的进出场点。 其他产品 ->  这里 主要功能: Point of Control (POC) 计算 - 最大交易活动水平,帮助识别最具流动性的水平 Value Area 定义(增加活动区)和可自定义的成交量百分比,帮助更准确地评估交易区间 支持tick成交量和实际成交量,适用于不同市场类型和交易策略 灵活的计算周期设置(天数),使工具能够适应任何时间范围 自动适应浅色和深色终端主题,提升用户界面的可视体验 清晰的水平可视化,支持自定义样式和颜色,便于图表分析和快速决策 该指标非常适合识别重要的价格水平和整合区,帮助交易者做出更加明智的交易决策。使用 Haven Volume Profile 有助于通过更准确的成交量和市场动态分析来降低风险并增加利润。
FREE
Heatmap Volume Profile
Olexandr Savchuk
3.5 (2)
A Heatmap with a Volume Profile is like a thermal imager or x-ray machine. It will help you to estimate the relative distribution of volume during the price movement and to understand  the relationship between volume and price. Indicator Volume Profile "Volumos Maxima" is a powerful tool for analyzing this relationship. After simple experimentation with heatmap, you can find that each trading instrument has its own “ characteristic ” way of distributing volume. And this will help you to make a b
本指标可以让您享受两个最流行的产品来分析在感兴趣的价位的请求量和市场成交量: 真实市场深度图表 真实报价足迹成交量图表 本产品结合两个指标的效力,并以单个文件提供。 反危机出售。今日低价。赶紧! 真实的 COMBO 市场深度功能和报价成交量图表,完全等同于原始指标。您将享受这两款产品结合为单一超级指标的力量!下面是您将得到的功能: 真实市场深度图表 股民专用工具现已在 MetaTrader 5 上可用。 真实市场深度图表 指标在图表上以直方条的形式显示可视化的市场深度,并在实时模式下刷新。 利用 真实市场深度图表 指标您可以正确评估市场请求并从图表上看到大的市场。这可以 100% 的精确剥头皮和设置持仓止损。 指标以两种相应颜色的水平直方条形式显示买和卖的请求 (买-卖)。价格图表上给定级别的显示条和它们的长度与请求的交易量相应。此外, 它指示买卖请求的最大交易量。 此指标显示买卖请求总数量作为堆积面积图。这可以评估当经过下一价位时将会执行的请求总量。买卖请求总数量也显示在图表上。 省缺, 指标显示在图表背景上, 且它不会干扰任何其它指标。当使用指标交易时, 建议使用实际交易量。 本
Blahtech Market Profile MT5
Blahtech Limited
5 (10)
Was: $249  Now: $149   Market Profile defines a number of day types that can help the trader to determine market behaviour. A key feature is the Value Area, representing the range of price action where 70% of trading took place. Understanding the Value Area can give traders valuable insight into market direction and establish the higher odds trade. It is an excellent addition to any system you may be using. Inspired by Jim Dalton’s book “Mind Over Markets”, this indicator is designed to suit the
该指标建立当前报价,可以与历史报价进行比较,并在此基础上进行价格走势预测。指示器有一个文本字段,用于快速导航到所需日期。 选项: 符号 - 选择指标将显示的符号; SymbolPeriod - 选择指标从中获取数据的时段; IndicatorColor - 指示器颜色; HorisontalShift - 由指标绘制的报价移动指定的柱数; Inverse - true 反转引号,false - 原始视图; ChartVerticalShiftStep - 图表垂直移动(键盘上的向上/向下箭头); 接下来是文本字段的设置,您可以在其中输入日期,您可以通过按“回车”立即跳转到该日期。 接下来是文本字段的设置,您可以在其中输入日期,您可以通过按“回车”立即跳转到该日期。
VolumeProfile MT5
Robert Hess
4.14 (7)
Description: The Volume Profile displays detailed informations of historical trading activities at certain price levels (Market Profile). Locate the areas with the best prices in the market and get an advantage over other market participants. Features: Customizable Market Profile Shows the "fair" Value Area with 70% of all Volume Shows critical low volume zones Shows VPOC, VAL and VAH Points integrated resource management to reduce the load while working with multiple charts Works on all timefr
Contact me after payment to send you the user manual PDF file. Download the MT4 version here. Volume Profile Indicator A functional and useful tool that can improve your trading plan. This indicator calculates volume in price levels(typical volume indicator shows only candle volumes). With the volume of price levels, you can identify important areas that have the potential to reverse. You can also see the volume of support and resistance levels and decide on them. Using volume profiles along
Blahtech Supply Demand MT5
Blahtech Limited
4.54 (13)
Was: $299  Now: $149  Supply Demand uses previous price action to identify potential imbalances between buyers and sellers. The key is to identify the better odds zones, not just the untouched ones. Blahtech Supply Demand indicator delivers functionality previously unavailable on any trading platform. This 4-in-1 indicator not only highlights the higher probability zones using a multi-criteria strength engine, but also combines it with multi-timeframe trend analysis, previously confirmed swings
TPO Volume Range Indicator MetaTrader 5 The TPO Volume Range Indicator allows traders to visualize trading volume distribution within specific price ranges. This indicator features two adjustable vertical lines, enabling users to set their preferred analysis range. Histograms represent market activity at each price level, while green horizontal lines mark the areas with the highest volume.  These high-volume zones are widely considered key support and resistance levels and are crucial for infor
FREE
BoxProfile MT5
Evgeny Shevtsov
4.56 (9)
The indicator displays volume profiles based on the nesting principle. Profiles periods are pre-set so that each subsequent profile has a length twice as long as the length of the previous profile. In addition to profiles, the indicator displays volume clusters sorted by color, depending on the volume they contain. Indicator operation features The indicator works on typical timeframes from M5 to MN, but for calculations uses historical data from smaller timeframes: M1 - for timeframes from M5
FREE
AW Candle Patterns
AW Trading Software Limited
AW 蜡烛形态指标是高级趋势指标与强大的蜡烛形态扫描仪的组合。它是识别和突出显示 30 个最可靠的烛台形态的有用工具。此外,它是一个基于彩色条的电流趋势分析器,带有   可调整大小和定位的插件多时间框架趋势面板。根据趋势过滤调整模式显示的独特能力。 优点: 轻松识别蜡烛形态 不重绘结果 内置多时间趋势面板 禁用模式类型(1、2、3 根蜡烛) 显示形态时趋势过滤的调整 MT4 version -> HERE  / Instructions and description  -> HERE 显示模式列表: 锤模式 固定/固定 看跌 Harami / 看涨 Harami 看跌 Harami Cross / 看涨 Harami Cross 枢轴点反转向上/枢轴点反转向下 双柱低位收盘价较高/双柱低位收盘价较低 收盘价反转向上 / 收盘价反转向下 中性条 /     两个中性条 双内/内/外 向上推力杆/向下推力杆 晚星/晨星 晚上十字星 / 早上十字星 吞没看跌线/吞没看涨线 镜子酒吧 流星 乌云盖顶 十字星 输入变量: Main settings Trend Filtering Mode
Anchored VWAP plus
Jesper Christensen
Elevate Your Trading with Advanced Anchored Volume Weighted Average Price Technology Unlock the true power of price action with our premium Anchored VWAP Indicator for MetaTrader 5 - the essential tool for precision entries, strategic exits, and high-probability trend continuation setups. Write me a DM for a 7 day free trial.  Anchored VWAP Plus gives traders unprecedented control by allowing custom anchor points for Volume Weighted Average Price calculations on any chart. With support for 4 sim
FREE
蜡烛成交量强度是一种先进的成交量分析指标,可洞察买卖双方之间的持续竞争。它计算并可视化实时成交量变化,帮助交易者更准确地确认突破、趋势、回撤和反转。 主要特点: 基于成交量的确认—— 该指标监控成交量变化,并在市场力量在买家和卖家之间转移时发出警报。 趋势和突破验证—— 通过分析交易量分布,交易者可以确认市场趋势和突破信号的强度。 反转和回撤检测—— 成交量模式有助于识别价格走势中的潜在转折点。 支撑和阻力洞察—— 关键水平附近的成交量增加增强了对其可靠性的信心。 简单有效的可视化—— 以直方图形式显示买卖强度,以便于解释。 蜡烛图成交量强度可帮助交易者利用成交量分析确认市场走势,从而做出明智的决策。在突破期间,高交易量表明市场参与度高,从而增强了突破信号的有效性并降低了错误动作的可能性。理解趋势强度变得更容易,因为上升趋势中成交量的增加证实了持续的购买压力,而下降趋势中成交量的增加表明强劲的卖出活动,为交易者提供了对趋势延续的更大信心。此外,该指标通过识别价格变动和成交量活动之间的差异来帮助发现潜在的趋势逆转。例如,如果价格继续上涨而成交量下降,则可能表明趋势减弱并可能出现逆转。
Call/Put Ratio is one of the most well-known indicators of the market sentiment. The indicator has been developed by Martin Zweig. It is based on real volumes of the CBOE option market. As we know, a Call option gives its owner the right to buy the underlying asset at a predetermined price. A Put option gives the right to sell it. Thus, increasing volumes for Call options indicate the increasing demand. The growth of Put option volumes shows that supply starts exceeding demand. If we divide the
Volume Profile เป็นเครื่องมือที่ใช้สำหรับการวิเคราะห์ระดับการซื้อขายของตลาดในแต่ละระยะเวลาโดยใช้ปริมาณการซื้อขาย (volume) ซึ่งช่วยให้เราเข้าใจว่ามีการซื้อขายเกิดขึ้นมากที่สุดที่ราคาใด รวมทั้งช่วยในการหาจุดที่มีความนิยมในการซื้อขาย (Point of Control: POC) และระดับการซื้อขายอื่น ๆ ที่สำคัญ เรียกว่า Value Area. การใช้งาน Volume Profile ในการวิเคราะห์ตลาดมักจะมีขั้นตอนดังนี้: กำหนดระยะเวลาที่ต้องการวิเคราะห์ : เราต้องกำหนดระยะเวลาที่เราสนใจในการวิเคราะห์ Volume Profile เช่น ชั่วโมง, วัน, หรือสัปดาห์
Delta Single Volume is a very powerful indicator that reads the supply on the Market. It calculates the Delta from movement of the price and the difference of BUY and SELL volumes. Its special structure allows you to get all timeframe values available on the MT5 platform. It works on Tick Volumes and Real Volumes (if avalaibles on your Broker). A good observation of this instrument can suggest great entry points and possible reversal. We are confident that this tool will help you to improve you
该产品的买家也购买
Divergence Bomber
Ihor Otkydach
4.98 (49)
购买该指标的每位用户将额外免费获得以下内容: 原创工具“Bomber Utility”,该工具会自动跟踪每一笔交易,设置止损和止盈点,并根据策略规则自动平仓; 适用于不同交易品种的指标设置文件(Set 文件); 三种不同风险模式下的 Bomber Utility 设置文件:“最低风险”、“平衡风险” 和 “观望策略”; 一套详细的 视频操作手册,帮助您快速完成安装、配置并开始使用本交易系统。 注意: 要获取以上所有赠品,请通过 MQL5 的私人消息系统联系卖家。 我为您介绍原创的自定义指标 “Divergence Bomber”(背离轰炸机),它是一套基于 MACD 背离交易策略 的“全功能”交易系统。 该技术指标的主要任务是识别 价格与 MACD 指标之间的背离,并发出交易信号(包括推送通知),指示未来价格可能的运动方向。平均而言,这些信号的准确率超过 98%。有关该指标如何工作的详细说明,请观看本页面上的视频演示。 该系统使用 止损订单 和 动态回撤平仓机制 来管理交易。 Divergence Bomber 指标的主要特点: 支持交易的品种: AUDCAD、AUDCHF、AUDSG
Trend Screener Pro MT5
STE S.S.COMPANY
4.86 (87)
使用趋势筛选指标释放趋势交易的力量:由模糊逻辑和多货币系统提供支持的终极趋势交易解决方案! 使用趋势筛选器(由模糊逻辑提供支持的革命性趋势指标)提升您的趋势交易。 它是一个强大的趋势跟踪指标,结合了超过 13 种高级工具和功能以及 3 种交易策略,使其成为使您的 Metatrader 成为趋势分析器的多功能选择。 限时优惠:趋势筛选指标终身仅需 50 美元。 ( 原价 250$ ) (优惠延长) 体验趋势筛选器 100% 无需重新绘制的准确性,确保您的交易决策不受过去价格变化的影响。 释放多时间框架和多货币功能的多功能性,使您能够以无与伦比的信心在外汇、商品、加密货币和指数领域进行交易。 利用 Trend Screener 的综合策略套件增强您的交易: - 趋势跟踪策略和趋势延续策略 :趋势筛选器的趋势跟踪策略提供清晰的趋势延续信号,让您有效捕捉趋势走势并管理风险。 - 反转策略和早期入场点策略 :趋势筛选器的反转策略可检测市场方向的潜在变化,使您能够预测趋势反转并利用疲弱的市场趋势。通过早期入场点,您可以在潜在的趋势变化之前定位自己 获取可观的利润。 - 倒卖策略: 趋势筛选器的倒卖
Grabber System MT5
Ihor Otkydach
5 (13)
向您介绍一款优秀的技术指标——Grabber,它是一套即开即用的“全包式”交易策略。 在一个代码中集成了强大的市场技术分析工具、交易信号(箭头)、提醒功能和推送通知。 每位购买该指标的用户还可免费获得以下内容: Grabber辅助工具:用于自动管理已开仓位 视频操作指南:逐步教学如何安装、设置和使用该指标进行交易 原创Set文件:可快速自动配置,帮助实现最佳交易效果 忘掉其他策略吧!只有Grabber能够真正激励你在交易中攀登新高峰! Grabber策略的主要特点: 交易周期:从M5到H4 适用资产:任意,但我推荐我亲自测试过的品种(GBPUSD、GBPCAD、GBPCHF、AUDCAD、AUDUSD、AUDSGD、AUDCHF、NZDUSD、NZDCAD、EURCAD、EURUSD、EURAUD、EURGBP、EURCHF、USDCAD、USDSGD) 交易时间:全天候 24/7 交易效果:我分享自己的真实交易结果,并在此教学如何操作: https://www.mql5.com/ru/market/product/134563?source=Site+Market+MT5+Indic
Algo Pumping
Ihor Otkydach
4.72 (18)
PUMPING STATION – 您的专属“全包式”交易策略 我们为您推出PUMPING STATION —— 一款革命性的外汇指标,它将使您的交易变得更加有趣且高效。这不仅仅是一个辅助工具,而是一套完整的交易系统,具备强大的算法,帮助您开始更加稳定的交易。 购买本产品,您将免费获得: 专属设置文件:用于自动配置,实现最大化性能。 逐步视频教程:学习如何使用PUMPING STATION策略进行交易。 Pumping Utility:专为PUMPING STATION打造的半自动交易机器人,让交易变得更加方便和简单。 购买后请立即联系我,我将为您提供所有额外资源的访问权限。 PUMPING STATION如何工作: 趋势监控:能够即时识别市场趋势方向。趋势是您最好的朋友。 进场信号:图表上的箭头会提示您何时进场以及交易方向。 明确的交易目标:指标会自动识别最佳的平仓时机。 回调交易:内置的基于布林带的价格通道可检测修正结束并发出新趋势开始的信号。 效率分析:如果当前设置效果较差,系统会自动提示。只需调整PUMPING STATION,即可获得最佳性能。 交易資產:我推薦我親自測試過的
*** Entry In The Zone and SMC Multi Timeframe” 是一款基于智能资金概念(SMC)的实时市场分析工具。它有效地集成了反转信号,并通过多时间框架结构检测自动识别关键反转区域,以及识别重要的兴趣点(POI)。此工具旨在帮助交易者以更大的信心和更有结构的方法进行交易决策和规划。*** 功能包括: 自动化市场结构检测(BOS CHoCH)(mBOS mCHoCH) 识别订单区块、供需区和公平价值缺口(FVG) 流动性区、溢价与折扣区域、平高和平低 关键兴趣点(POI) 交易时段(东京、伦敦、纽约) 可定制的仪表板,适应您的独特交易风格 实时操作,无信号重新绘制,全面的多时间框架覆盖,让您做 出更自信的交易决策 ------------------------------------------------------------------------------ 与我们一起进行实时前向测试 :  https://www.youtube.com/@fableedge        教程视频(点击观看):  https://youtu.be/tW
Gold Stuff mt5
Vasiliy Strukov
4.92 (189)
Gold Stuff mt5 是专为黄金设计的趋势指标,也可用于任何金融工具。 该指标不会重绘,也不会滞后。 推荐时间框架 H1。 购买后立即联系我以获得设置和个人奖励!   你可以在我的个人资料中找到它。   重要! 购买后立即与我联系,以获得说明和奖金!   您可以免费收到我们的强力支持和趋势扫描指标的副本,请私信。大部头书!   设置 绘制箭头 - 打开关闭。 在图表上绘制箭头。 警报 - 打开关闭声音警报。 电子邮件通知 - 打开关闭。 电子邮件通知。 Puch-notification - 打开关闭。 推送通知。 接下来,调整色域。 Gold Stuff mt5 是专为黄金设计的趋势指标,也可用于任何金融工具。 该指标不会重绘,也不会滞后。 推荐时间框架 H1。 购买后立即联系我以获得设置和个人奖励!   设置 绘制箭头 - 打开关闭。 在图表上绘制箭头。 警报 - 打开关闭声音警报。 电子邮件通知 - 打开关闭。 电子邮件通知。 Puch-notification - 打开关闭。 推送通知。 接下来,调整色域。
“ Dynamic Scalper System MT5 ”指标专为在趋势波内进行剥头皮交易而设计。 已在主要货币对和黄金上进行测试,并可与其他交易工具兼容。 提供顺势短线建仓信号,并提供额外的价格变动支持。 指标原理: 大箭头决定趋势方向。 在趋势波内,我们采用一种生成小箭头形式的剥头皮交易信号的算法。 红色箭头代表看涨方向,蓝色箭头代表看跌方向。 敏感的价格变动线会沿着趋势方向绘制,并与小箭头信号协同作用。 信号运作方式如下:当线在适当时刻出现时,将形成入场信号;在出现线时,持仓;线完成后,平仓。 建议的操作时间范围为M1 - H4。 箭头在当前K线上方形成,如果下一根K线已开仓,则不会重新绘制上一根K线上方的箭头。 输入参数 Trend Wave Period - 趋势方向(大箭头)的周期,改变趋势波的时间间隔。值 1 表示趋势方向的最长持续时间,参数值越大,持续时间越短。 Scalper Arrows Period - 信号箭头(小箭头)的计算周期,改变入场信号的生成频率。值 3 表示最频繁的生成频率,参数值越大,箭头频率越低,准确度越高。 这些参数可以根据不同
Matrix Arrow Indicator MT5
Juvenille Emperor Limited
5 (15)
矩阵箭头指标 MT5   是一种独特的 10 合 1 趋势,遵循   100% 非重绘多时间框架指标 ,可用于所有符号/工具: 外汇 、 商品 、 加密货币 、 指数 、 股票 。 Matrix Arrow Indicator MT5 将在其早期阶段确定当前趋势,从多达 10 个标准指标中收集信息和数据,它们是: 平均定向运动指数 (ADX) 商品渠道指数 (CCI) 经典 Heiken Ashi 蜡烛 移动平均线 移动平均收敛散度 (MACD) 相对活力指数 (RVI) 相对强弱指数 (RSI) 抛物线SAR 随机振荡器 威廉姆斯的百分比范围 当所有指标给出有效的买入或卖出信号时,相应的箭头将打印在图表上,在下一根蜡烛/柱线开盘时,指示强劲的上升趋势/下降趋势。用户可以选择使用哪些指标,并可以单独调整每个指标的参数。 Matrix Arrow Indicator MT5 仅从选定的指标中收集信息,并仅根据其数据打印箭头。   Matrix Arrow Indicator MT5   还可以为所有新信号发送终端、推送通知或电子邮件警报。无论您是黄牛、日内交易者还是波段交易者, Mat
支撑和阻力筛选器是 MetaTrader 的一个级别指标,它在一个指标内提供多种工具。 可用的工具有: 1. 市场结构筛选器。 2. 看涨回调区。 3. 看跌回调区。 4.每日枢轴点 5.每周枢轴点 6. 每月枢轴点 7. 基于谐波形态和成交量的强大支撑和阻力。 8. 银行级区域。 限时优惠:HV 支撑和阻力指示器仅售 50 美元且终生可用。 (原价 125$) 通过访问我们的 MQL5 博客,您可以找到我们所有带有分析示例的高级指标: 单击此处 主要特点 基于谐波和音量算法的强大支撑和阻力区域。 基于谐波和成交量算法的看涨和看跌回调区域。 市场结构筛选器 每日、每周和每月的枢轴点。 文档 所有支持和阻力筛选器文档(说明)和策略详细信息均可在我们 MQL5 博客的这篇文章中找到: 单击此处。 接触 如果您有任何问题或需要帮助,请通过私信联系我。 作者 SAYADI ACHREF,金融科技软件工程师,Finansya 创始人。
Berma Bands
Muhammad Elbermawi
5 (5)
Berma 波段 (BBs) 指标对于寻求识别和利用市场趋势的交易者来说是一种有价值的工具。通过分析价格与 BBs 之间的关系,交易者可以辨别市场是处于趋势阶段还是区间波动阶段。 访问[ Berma Home Blog ] 了解更多信息。 Berma 带由三条不同的线组成:上 Berma 带、中 Berma 带和下 Berma 带。这些线围绕价格绘制,直观地表示价格相对于整体趋势的变动。这些带之间的距离可以洞察波动性和潜在的趋势逆转。 当 Berma Bands 线相互分离时,通常表明市场正在进入横盘或区间波动时期。这表明缺乏明确的方向性。交易者可能会发现在这些时期内很难识别趋势,因此可能需要等待更清晰的趋势出现。 当 Berma Bands 线汇聚成一条线时,通常表示趋势环境强劲。这种汇聚表明存在明显的方向性偏差,因为价格波动性足以随趋势而变化。交易者可能会发现在这些时期更容易识别潜在的入场点和出场点,因为趋势的势头可以提供有利的交易机会。然而,重要的是要注意整体趋势中的潜在回调或修正。 Berma 带根据价格蜡烛图与上带和下带的相互作用提供明确的买入和卖出信号。当价格蜡烛图首
Atbot
Zaha Feiz
4.66 (50)
AtBot: 它是如何工作的以及如何使用它 ### 它是如何工作的 “AtBot”指标用于MT5平台,通过结合技术分析工具生成买入和卖出信号。它集成了简单移动平均线(SMA)、指数移动平均线(EMA)和平均真实波幅(ATR)指标,以识别交易机会。此外,它还可以利用Heikin Ashi蜡烛来增强信号的准确性。 购买后留下评论,您将获得特别的奖励礼物。 ### 主要特点: - 不重绘: 信号在绘制后不会改变。 - 不变动: 信号保持一致,不会被更改。 - 无延迟: 提供及时的信号,没有延迟。 - 多种时间框架: 可在任何时间框架上使用,以适应您的交易策略。 ### 操作步骤: #### 输入和设置: - firstkey (TrendValue): 调整趋势检测的灵敏度。 - Secondkey (SignalValue): 定义买入/卖出信号生成的灵敏度。 - masterkey (ExitValue): 控制信号的退出策略。 - h: 切换是否根据Heikin Ashi蜡烛生成信号(真/假)。 - notifications: 启用或禁用信号提醒。 #### ATR计算: ATR测
FX Volume MT5
Daniel Stein
4.84 (19)
FX Volume:从经纪商视角洞察真实市场情绪 简要概述 想要提升您的交易策略? FX Volume 可提供零售交易者和经纪商的持仓实时数据——远早于诸如 COT 之类的延迟报告。不论您希望获得持续稳定的收益,还是想在市场中多一分制胜的砝码, FX Volume 都能帮您识别重大失衡、确认突破以及完善风险管理。立即开启体验,让真实的成交量数据为您的交易决策带来革新! 1. 为什么 FX Volume 对交易者格外有用 极具准确度的早期预警 • 快速捕捉有多少交易者正在买入或卖出某个货币对——比大多数人提前一步。 • FX Volume 是 唯一 能够整合多家零售经纪商真实成交量数据并以简洁方式呈现的工具。 强力风险管理 • 及时识别多头或空头仓位的巨大不平衡,这往往预示着潜在的趋势反转,帮助您更自信地设置止损和目标位。 • 独家而真实的数据让每一次交易决策更具可靠性。 优化进场与出场点 • 发现“过度集中”的交易(大多数交易者都在同一方向),并通过真实成交量来确认突破。 • 避免依赖常见指标可能带来的误导信号,而是利用真实的实时成交量。 适配各种交易策略 • 将 FX
FX Power MT5 NG
Daniel Stein
5 (17)
FX Power:分析货币强度,助您做出更明智的交易决策 概述 FX Power 是一款专业工具,帮助您全面了解主要货币和黄金在任何市场条件下的真实强度。通过识别强势货币用于买入,弱势货币用于卖出, FX Power 简化了交易决策,并帮助您发现高概率的交易机会。不论您是想跟随趋势还是通过极端的 Delta 值预测反转,这款工具都能完美适应您的交易风格。别再盲目交易——用 FX Power 让您的交易更加智慧。 1. 为什么 FX Power 对交易者极具价值 实时货币和黄金强度分析 • FX Power 实时计算并显示主要货币和黄金的相对强度,助您全面了解市场动态。 • 监控领先或落后资产,轻松识别值得交易的货币对。 全面的多时间框架视图 • 跟踪短期、中期和长期时间框架的货币和黄金强度,以便将您的交易策略与市场趋势保持一致。 • 无论是快进快出的短线交易还是更长期的投资策略, FX Power 都能为您提供所需的信息。 Delta 动态分析用于趋势和反转 • 极端 Delta 值常常预示反转机会,而平缓的 Delta 变化则确认趋势延续。 • 使用 Delta 分析,轻
IX Power MT5
Daniel Stein
4.88 (8)
IX Power:解锁指数、大宗商品、加密货币和外汇市场洞察 概述 IX Power 是一款多功能工具,可分析指数、大宗商品、加密货币和外汇市场的强弱表现。 FX Power 提供针对货币对的最高精度,利用所有可用货币对数据进行分析,而 IX Power 专注于基础资产的市场数据。这使得 IX Power 成为非外汇市场的理想选择,同时在需要简单外汇分析时也非常可靠。它可以无缝适用于任何图表,提供清晰的、有行动价值的洞察,帮助提升您的交易决策。 1. 为什么 IX Power 对交易者非常有价值 多市场强弱分析 • IX Power 分析指数、大宗商品、加密货币和外汇市场的强弱表现,为每个市场提供量身定制的洞察。 • 监控 US30、WTI、黄金、比特币等资产的表现,发现交易机会。 适用于更广泛的市场 • 对于外汇交易, FX Power 提供无与伦比的精度,通过分析所有相关货币对。 • IX Power 专注于基础资产的市场数据,非常适合非外汇市场及简化的外汇分析。 实时适应性 • 借助自适应算法, IX Power 实时响应市场数据变化,保持分析的最新性。 • 实时更新
MetaForecast M5
Vahidreza Heidar Gholami
5 (3)
MetaForecast能够根据价格数据中的谐波来预测和可视化任何市场的未来走势。虽然市场不总是可预测的,但如果价格中存在模式,MetaForecast可以尽可能准确地预测未来。与其他类似产品相比,MetaForecast通过分析市场趋势可以生成更精确的结果。 输入参数 Past size (过去的尺寸) 指定MetaForecast用于创建生成未来预测模型的柱数量。该模型以一条黄色线绘制在所选柱上。 Future size (未来的尺寸) 指定应预测的未来柱数量。预测的未来以粉色线表示,并在其上绘制了蓝色回归线。 Degree (程度) 此输入确定了MetaForecast将在市场上进行的分析级别。 Degree 描述  0 对于程度0,建议使用较大的值来设置“过去的尺寸”输入,以覆盖价格中的所有高峰、低谷和细节。  1 (建议的) 对于程度1,MetaForecast可以理解趋势,并通过较小的“过去的尺寸”生成更好的结果。  2 对于程度2,除了趋势,MetaForecast还可以识别反转点。对于大于1的程度,必须使用较高的“细节”和“噪音减少”输入值。  大于2 不建议使用大于
FX Levels MT5
Daniel Stein
5 (6)
FX Levels:适用于所有市场的高精度支撑与阻力 快速概览 想要精准确定适用于任何市场(外汇、指数、股票或大宗商品)的支撑与阻力吗? FX Levels 将传统的“Lighthouse”方法与前沿的动态分析相结合,实现近乎通用的准确性。依托真实经纪商经验和自动化的每日与实时更新, FX Levels 帮助您捕捉价格反转点、设置合理的盈利目标,并自信地管理交易。立即使用,体验更准确的支撑/阻力分析如何助力您的交易更上层楼! 1. 为什么 FX Levels 对交易者非常有利 极度精准的支撑 & 阻力区 • FX Levels 专为不同经纪商提供的行情源和时间设置而设计,可生成几乎相同的价位区,解决数据不一致的常见问题。 • 这意味着无论您在哪里交易,都能获得稳定一致的水平线,为策略打下更加牢固的基础。 结合传统与先进技术 • 通过将久经考验的“Lighthouse”方法与动态分析相融合, FX Levels 不仅限于每日刷新,还可针对新的价格波动进行即时更新。 • 您可以选择经典的静态方式,或实时捕捉新出现的水平,以贴近最新的市场行为。 识别清晰的反转点 • FX Lev
RelicusRoad Pro MT5
Relicus LLC
5 (20)
您购买了多少次交易指标,它们拥有 出色的回测, 真实账户表现证明 拥有惊人的数字和 各种统计数据, 但使用后您却 账户爆仓? 您不应该只相信一个信号本身,您需要知道它最初出现的原因,这正是 RelicusRoad Pro 的最佳之处! 用户手册 + 策略 + 培训视频 + 带 VIP 访问权限的私人群组 + 提供移动版本 观察市场的新方式 RelicusRoad 是 全球最强大、最好的交易指标 ,适用于外汇、期货、加密货币、股票和指数,为交易者提供发展账户所需的所有信息和工具。我们提供 技术分析 和 交易计划 ,帮助 每位交易者取得成功 ,无论是 初学者 还是 高级交易者 。 它是一个 关键交易指标 ,提供足够的信息来 预测 未来市场。我们相信一个 完整的解决方案 ,而不是图表上几个没有意义的不同指标。这是一个 一体化指标 ,显示 信号 、 箭头 + 价格行为 信息,这是 无与伦比 且 非常准确的 。   RelicusRoad 利用机器学习 (AI) 技术,为交易者提供必要的信息和工具,帮助他们成为成功的、知情的交易者。   通过领先指标预测未来价格 几乎 所有技术指标都滞后 ,
Jeslyn MT5
Justine Kelechi Ekweh
這是一個多用途系統,既適合外匯手動交易者,也適合作為黃牛系統或進入非常強勁勢頭的策略、二元期權交易者或由通用 EA 在自動化交易中使用。 Jeslyn頭指示器,但它具有復雜且邏輯的算法。它不會根據其他指標進行計算,而僅根據價格行為進行計算。我找到了一種方法來解釋趨勢、趨勢與動量的差異、背離與成交量價差分析之間的關係。有一些小型的供應和需求區域,其中的頭寸充滿動力,這些是我們在它們開始時想要的地方。他們還說我們無法在 Metatrader 中獲得真實交易量,好吧,我找到了一種方法來獲取它並通過價格動量操縱它。成交量、動量和分歧是這頓飯的秘訣。 Jeslyn頭指示器,但它具有復雜且邏輯的算法。它不會根據其他指標進行計算,而僅根據價格行為進行計算。我找到了一種方法來解釋趨勢、趨勢與動量的差異、背離與成交量價差分析之間的關係。有一些小型的供應和需求區域,其中的頭寸充滿動力,這些是我們在它們開始時想要的地方。他們還說我們無法在 Metatrader 中獲得真實交易量,好吧,我找到了一種方法來獲取它並通過價格動量操縱它。成交量、動量和分歧是這頓飯的秘訣。 我想要一種能夠經受住時間和所有
Trend Forecaster
Alexey Minkov
5 (7)
The Trend Forecaster indicator utilizes a unique proprietary algorithm to determine entry points for a breakout trading strategy. The indicator identifies price clusters, analyzes price movement near levels, and provides a signal when the price breaks through a level. The Trend Forecaster indicator is suitable for all financial assets, including currencies (Forex), metals, stocks, indices, and cryptocurrencies. You can also adjust the indicator to work on any time frames, although it is recommen
- Real price is 80$ - 50% Discount (It is 39$ now) Contact me for instruction, any questions! - Lifetime update free - Non-repaint - I just sell my products in Elif Kaya Profile, any other websites are stolen old versions, So no any new updates or support. Advantages of  M1 Scalper Pro  Profitability: M1 Scalper Pro is highly profitable with a strict exit strategy. Frequent Opportunities: M1 Scalper Pro  takes advantage of numerous small price changes. Minimal Market Risk: Limited exposure redu
MonetTrend
Aliya Bolek
MonetTrend — Премиум-индикатор для торговли по тренду (M30, H1, H4) MonetTrend — это мощный и визуально понятный трендовый индикатор, созданный для торговли на таймфреймах M30, H1 и H4. Он идеально подходит для работы с волатильными инструментами, такими как: • Золото (XAUUSD) • Криптовалюты (BTCUSD) • Валютные пары (EURUSD, USDJPY и др.) Ключевые особенности MonetTrend: • Автоматическое отображение Take Profit 1 (TP1) и Stop Loss (SL): После появления сигнала индикатор сразу показывает: • TP
ICT, SMC, SMART MONEY CONCEPTS, SMART MONEY, Smart Money Concept, Support and Resistance, Trend Analysis, Price Action, Market Structure, Order Blocks, BOS/CHoCH,   Breaker Blocks ,  Momentum Shift,   Supply&Demand Zone/Order Blocks , Strong Imbalance,   HH/LL/HL/LH,    Fair Value Gap, FVG,  Premium  &   Discount   Zones, Fibonacci Retracement, OTE, Buy Side Liquidity, Sell Side Liquidity, BSL/SSL Taken, Equal Highs & Lows, MTF Dashboard, Multiple Time Frame, BigBar, HTF OB, HTF Market Structure
Elliot Waves Analyzer Pro
Viktor Weidenthal
2.67 (3)
Elliot Waves Analyzer Pro calculates Elliot Waves to Help Identify Trend direction and Entry Levels. Mainly for Swing Trading Strategies. Usually one would open a Position in trend direction for Wave 3 or a Correction for Wave C . This Indicator draws Target Levels for the current and next wave. Most important Rules for Elliot Wave Analysis are verified by the Indicator.  The Pro version analyzes Multiple Timeframes and shows the Subwaves and Target-Levels.   For an Overview  " Elliot Waves Anal
Gartley Hunter Multi
Siarhei Vashchylka
5 (11)
Gartley Hunter Multi - An indicator for searching for harmonic patterns simultaneously on dozens of trading instruments and on all possible timeframes. Manual (Be sure to read before purchasing) | Version for MT4 Advantages 1. Patterns: Gartley, Butterfly, Shark, Crab. Bat, Alternate Bat, Deep Crab, Cypher 2. Simultaneous search for patterns on dozens of trading instruments and on all possible timeframes 3. Search for patterns of all possible sizes. From the smallest to the largest 4. All fou
Entry Points Pro for MT5
Yury Orlov
4.46 (130)
这款指标用于 MT5,可提供准确的入场交易信号,且无重绘。 它可应用在任何金融资产:外汇、加密货币、贵金属、股票、指数。 它将提供极其精准的评估,并告诉您何时开仓和平仓的最佳时机。 观看 视频 (6:22),其中包含一个仅处理单一信号的示例,该信号即可值回指标购价! 大多数交易者在 Entry Points Pro 指标的帮助下,在第一个交易周内即改善了他们的交易结果。 订阅我们的 Telegram 群 ! Entry Points Pro 指标的益处。 入场信号无重绘 如果信号出现,并得到确认,则它不会再消失;不像是重绘指标,它会导致重大的财产损失,因为它们可以在显示信号后再将其删除。 无差错开仓 指标算法可令您找到入场交易(买入或卖出资产)的理想时机,从而提高每位交易者的成功率。 Entry Points Pro 可操作任何资产 它允许您在 MT5 平台上交易任何经纪商的加密货币、股票、贵金属、指数、大宗商品和货币。 提供任何方向的信号 Entry Points Pro 指标提供针对任意价格走势的入场交易信号 - 上涨、下跌或横盘(横向)。 最大盈利潜力 离场信号
FX Dynamic MT5
Daniel Stein
5 (2)
FX Dynamic:借助可定制的 ATR 分析,追踪波动率与趋势 概述 FX Dynamic 是一款强大的工具,通过计算平均真实波幅(ATR)来为交易者提供日内和日间波动性方面的深度见解。通过设置 80%、100%、130% 等关键波动率阈值,您可以快速识别潜在的盈利机会,或者在市场超出常规范围时及时得到预警。 FX Dynamic 可根据您经纪商的时区进行调整,帮助您保持一致的波动率衡量标准,并能与 MetaTrader 平台完美结合,实现实时分析。 1. 为什么 FX Dynamic 对交易者极具价值 实时 ATR 洞察 • 仅需一眼便可了解日间与日内波动水平。当价格触及或突破 80%、100%、130% 的 ATR 阈值时,会发出提示,让您知道市场是否达到临界水平。 • 在波动完全爆发前预判可能的衰竭或突破走势。 多市场通用 • 适用于外汇、商品、指数等多种资产。 FX Dynamic 可以自动识别经纪商时区,也可手动进行调整。 • 您可选择只专注于某一特定品种,或在多市场保持一致的 ATR 标准。 更智能的风险管理 • 利用 ATR 门槛来优化止损或止盈位置。当市场
Easy Buy Sell Signal Alert
Franck Martin
4.67 (12)
Easy Buy Sell is a market indicator for opening and closing positions. It becomes easy to track market entries with alerts. It indicates trend reversal points when a price reaches extreme values ​​and the most favorable time to enter the market. it is as effective as a Fibonacci to find a level but it uses different tools such as an algorithm based on ATR indicators and Stochastic Oscillator. You can modify these two parameters as you wish to adapt the settings to the desired period. It cannot
Bill Williams Advanced
Siarhei Vashchylka
5 (10)
Bill Williams Advanced is designed for automatic chart analysis using Bill Williams' "Profitunity" system. The indicator analyzes four timeframes at once. Manual (Be sure to read before purchasing) Advantages 1. Automatically analyzes the chart using the "Profitunity" system of Bill Williams. The found signals are placed in a table in the corner of the screen. 2. Equipped with a trend filter based on the Alligator indicator. Most of the system signals are recommended to be used only according t
Golden Spike Premium
Kwaku Bondzie Ghartey
5 (1)
Golden Spikes Detector Acknowledgement and Dedications:  The name of this indicator was Inspired by an Original; Mr Grant Koopman; a Knowledgeable and experienced Synthetics trader. I dedicate this indicator to Mr Grant.  Overview:   The Golden Spikes Premium is a groundbreaking trading indicator meticulously crafted for the Boom and Crash indices on the Deriv market. Tailored to meet the needs of discerning traders, this powerful tool operates exclusively on the one-minute timeframe, providing
TrendLine PRO MT5
Evgenii Aksenov
4.68 (34)
Trend Line PRO   指标是一个独立的交易策略。 它显示趋势变化,交易的入口点,以及自动计算三个级别的止盈和止损保护 Trend Line PRO  非常适合所有元交易者符号:货币,金属,加密货币,股票和指数 该指标用于真实账户交易,这证实了该策略的可靠性 您可以在这里找到使用   Trend Line PRO   和真实信号的机器人:   https://www.mql5.com/zh/users/neurofx/seller 目前,Trend Line PRO指标的售价为75美元。 促销后价格为 149 美元 。 趋势线专业的优点 永远不要重绘它的信号; 将其作为独立策略的可能性; 它有三个自动水平止盈和止损水平  该指标具有iCustom信号缓冲区,允许您基于它创建交易机器人 具有通知功能 该指标已证明其在真实账户交易中的有效性 如何设置和优化趋势线PRO指标: 通过更改幅度参数以及 TP 和 SL 水平,将重点放在指标面板上的利润上 您可以使用以下方式自动优化指标参数: Optimizer Utility 详细说明(ENG): 这里 趋势线PRO指标如何工作:
作者的更多信息
Seconds Timeframes Chart MT5
Abdelkhabir Yassine Alaoui
MetaTrader 5 的秒图表 指标允许您在 MetaTrader 5 终端中创建以秒为时间范围的图表。此类图表的时间范围以秒为单位,而不是以分钟或小时为单位。因此,您可以创建时间范围小于 M1 的图表。例如,S15 是周期为 15 秒的时间范围。您可以将指标、专家顾问和脚本应用于生成的图表。 您将获得一个功能齐全的图表,您可以在其上像在常规图表上一样工作。 由于现有的报价数据库,以秒为单位的时间范围不仅是实时构建的,而且还基于历史记录。因此,您可以随时打开已累积历史记录的以秒为单位的时间范围。 同时,数据与基本图表同步更新,没有延迟。 您可以选择以秒为单位的时间范围:S1、S2、S3、S4、S5、S6、S10、S12、S15、S20、S30。 此外,您还可以设置任何所需的值。 注意: 安装此指标并添加到图表后,按“Z”键可在标准时间范围和秒范围内的图表之间切换。
Spread Actual
Abdelkhabir Yassine Alaoui
5 (1)
This indicator Displays current spread in the main window of the chart. You can modify the font parameters, indicator's position and the normalization of the spread value. The spread is redrawn after each tick, ensuring the most current and active spread value. This can be useful for brokers with variable spreads or with spreads that are widened often. You can also enable a spread label to be shown near the current Bid line. you can also set  alert : Email, and push notifications.
FREE
Basing Candles
Abdelkhabir Yassine Alaoui
Basing Candles indicator is an automatic indicator that detects and marks basing candles on the chart. A basing candle is a candle with body length less than 50% of its high-low range. A basing candle or basing candlestick is a trading indicator whose body length is less than half of its range between the highs and lows. That's less than 50% of its range. The indicator highlights the basing candles using custom candles directly in the main chart of the platform. The percentage criterion can be
FREE
Usdjpy Hunter
Abdelkhabir Yassine Alaoui
This is a classic trading strategy based on two Moving Averages crossover. customized for usdjpy with a Good risk management strategy RR 1/2 . (    Long when fast MA crosses slow MA from below and Short when fast MA crosses slow MA from above ) TF : 5MIN MAX Lot size to use : 2% e.g : Balance =100 => lot size = 0.02 Balance =1000 => lot size = 0.20 Balance =10000 => lot size = 2 ------
FREE
Volume Profile For MT5
Abdelkhabir Yassine Alaoui
Volume Profile is a very useful indicator . it allows you to spot the price levels where important price action took place. It is similar to support and resistance levels but with a different logic. ( Check Out  Fixed Range Volume Profile MT5  ) One of the first thing that traders mark up when analyzing a chart is support and resistance. Volume Profile can be used for doing that too. The indicator scans the defined number of previous bars and calculates the volume of activity at each price le
DXY Correlation
Abdelkhabir Yassine Alaoui
Indicator  can be used for dxy correlation trading. it calculates the dollar index (USDX or DXY) using the EUR/USD, USD/JPY, GBP/USD, USD/CAD, USD/CHF and USD/SEK currency pairs. In order to trade them, you need to find a confirmed technical analysis pattern on the DXY chart and look for a correlated currency pair that has the same picture on its price chart. The formula used for calculation is the following: USDX = 50.14348112 × EURUSD -0.576   × USDJPY 0.136   × GBPUSD -0.119   × USDCAD 0.091
Best Pivot Point Indicator MT5
Abdelkhabir Yassine Alaoui
Best Pivot Point Indicator  display   pivot points   and   support and resistance   lines for the intraday trading. It calculates them using its own formula based on the previous trading session The indicator can display the following levels in addition to plain pivot points: Previous session's High and Low, today's Open. Sweet spots. Fibonacci levels. Camarilla pivots. Midpoint pivots.
Support And Resistance Levels MT5
Abdelkhabir Yassine Alaoui
Support And Resistance indicator that can display round levels and zones . It shows them directly on the chart, providing an easy help when you want to set stop-loss or take-profit level, or when you want to see the next market target.   If an asset price is moving down and bounces back up, the level is called support (think: price floor). If an asset price is moving upward and hits a level where it reverses downward, this is called resistance (think: price ceiling).
Candle Remaining Closing Time MT5
Abdelkhabir Yassine Alaoui
The Candle Remaining Closing Time indicator displays the amount of time left before the current candlestick closes on your chart. This tool is essential for traders who rely on precise timing to enter or exit trades, especially in fast-moving markets. By showing a real-time countdown, it helps you stay aware of upcoming candle completions across any timeframe—from 1-minute to daily charts. Whether you're a scalper watching minute-by-minute action or a swing trader timing key setups on higher tim
The Swing High Low and Fibonacci Retracement Indicator is a powerful technical analysis tool designed to identify key price levels and potential reversal zones in the market. It automatically detects recent swing highs and swing lows on the chart and overlays Fibonacci retracement levels based on these points. This indicator helps traders: Visualize market structure by highlighting recent swing points. Identify support and resistance zones using Fibonacci ratios (e.g., 38.2%, 50%, 61.8%). Adapt
筛选:
Anton du
26
Anton du 2024.03.27 18:52 
 

用户没有留下任何评级信息

Abdelkhabir Yassine Alaoui
4062
来自开发人员的回复 Abdelkhabir Yassine Alaoui 2024.04.01 13:54
it work , you just you don't know how to use it ( Certain brokers don't provide volume data . this indicator won't work if there no volume data provided from the broker server )
fred6531
14
fred6531 2023.04.27 11:18 
 

用户没有留下任何评级信息

Sarah
26
Sarah 2023.04.27 10:33 
 

用户没有留下任何评级信息

回复评论
版本 1.2 2024.04.01
Fixed Range Selection Tool