Account Graph MT4
- 指标
-
Kyra Nickaline Watson-gordon
 Experienced Developer (Experts / Indicators / Utilities ...)
Account Manager (Investment Manager) - 版本: 1.3
- 更新: 15 二月 2025
- 激活: 10
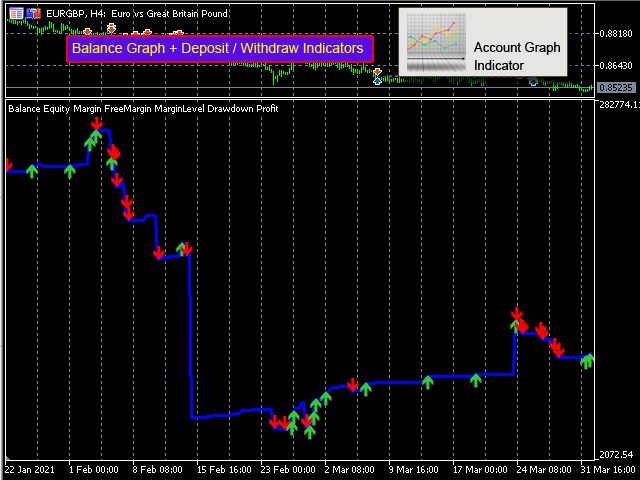
An indicator to draw a graph of account current and historical state such as Balance, Equity, Margin, Free Margin, Margin Level, Drawdown, Account Profit, Deposit and Withdrawals.
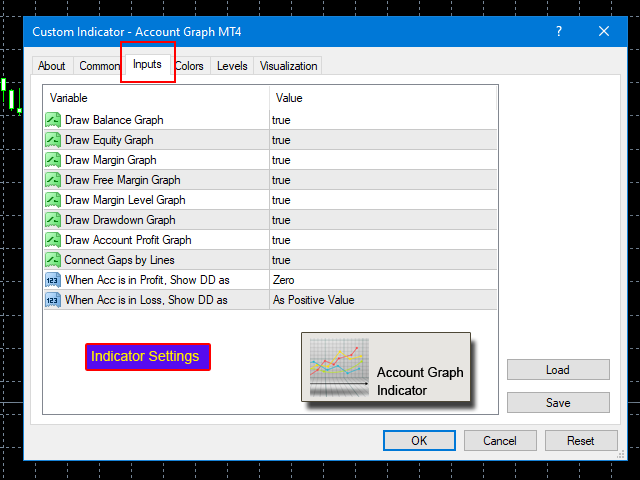
Indicator Inputs :
- Draw Balance Graph
- Draw Equity Graph
- Draw Margin Graph
- Draw Free Margin Graph
- Draw Margin Level Graph
- Draw Drawdown Graph
- Draw Account Profit Graph
- Connect Gaps by Lines
- Sign of DDs on Profit
- Sign of DDs on Loss
Tips :
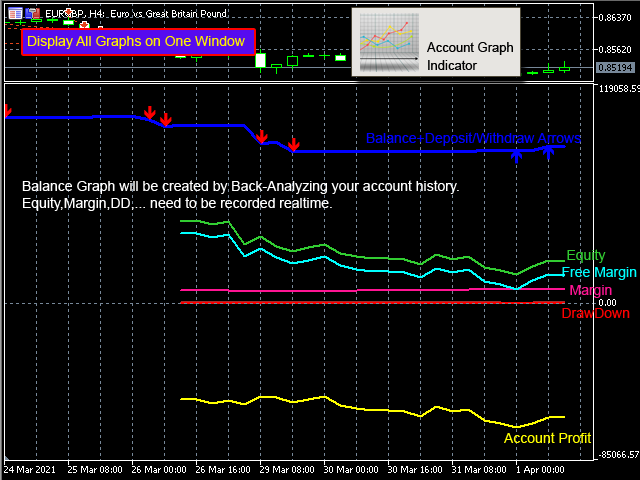
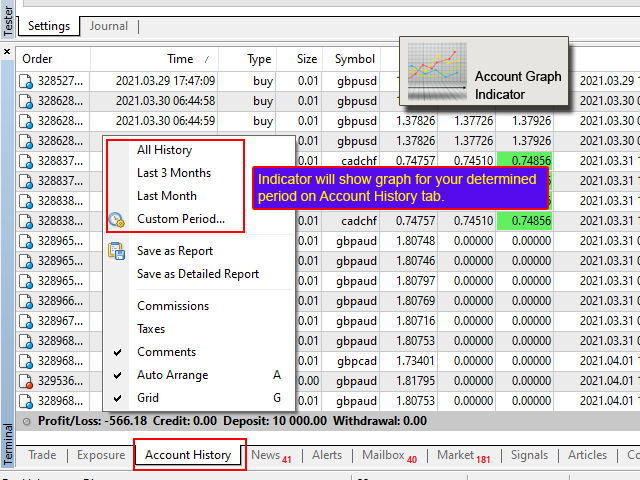
- The Indicator will draw historical balance graphs and deposit/withdraw arrows by back analyzing history of orders. But other data such as Drawdown, Equity, ... need real time monitoring. Attach the indicator and wait to collect real time data.
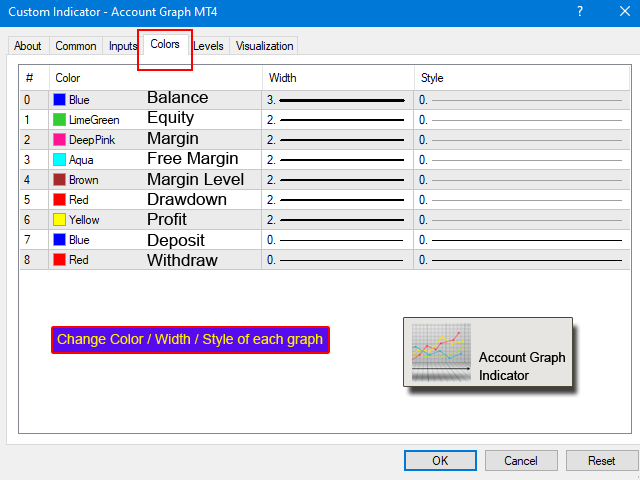
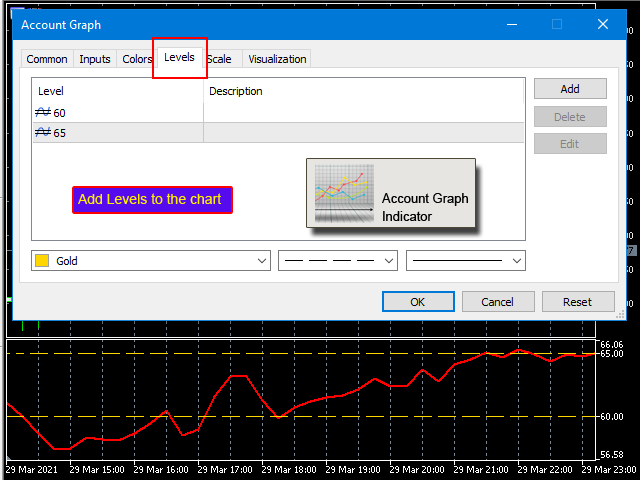
- Styles of graphs can be changed from the indicator settings tab.
- Buffers are accessible for programmers.
- (IMPORTANT) The Indicator can access your history of orders for a determined period. If you want to draw all historical data, set the time period of the history tab to "All History". Otherwise if for example it is set to Last Month, you will see the balance graph of last month only.
- The indicator can not be tested on strategy testers, because testers have no access to account historical status.
We are ready to help you for using the Indicator, Please don't hesitate to contact us.
Visit our other useful utilities, Indicators and experts here.


THE LONG HUNT IS OVER...this is exactly what I was looking for (BALANCE & EQUITY MONITORING) to analyze my trades better. I have seen so many different drawdowns such as relative, absolute, maximal, etc. and none of them display the same when looking at different platforms. All I was really looking for was a continuous monitoring of my equity in comparison to my balance at all times and this program does the trick and is worth every penny just for that alone. Thanks a million!!
Note: My only issue is that if I restart my VPS over the weekends which my provider recommends or have to do an update to my windows server I lose all the information since it needs live monitoring. I wish you would make this program function off my "account history trades" or have some feature where it can restore from where it left off somehow and then it would be perfect.