• 概述
  • 评论 (7)
  • 评论
  • 新特性

Supreme Commander

4

The indicator of the indicators. The Most Powerful Technique to Determine Forex Trend Strength in 2021.

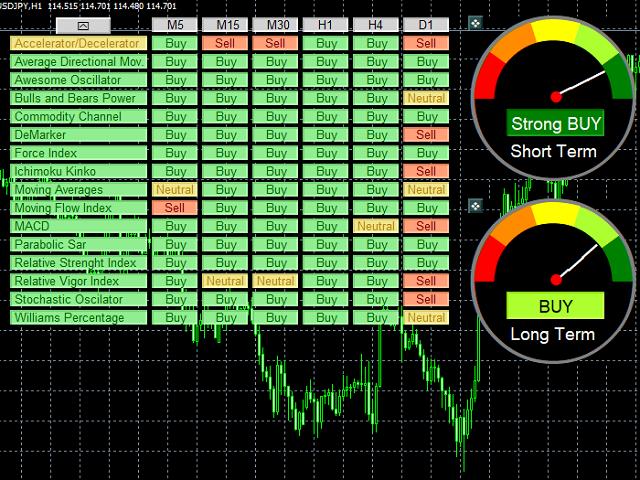
We have perfected Supreme Commander that it calculates an average of the selected indicators (up to 16) and the selected timeframe (all) with the result of a single trend that indicates the potential of buying and selling. 

It includes the following indicators:

  • Accelerator/Decelerator oscillator
  • Average Directional Movement Index
  • Awesome oscillator; Bulls and Bears 
  • Commodity Channel Index; DeMarker 
  • Force Index; Ichimoku Kinko Hyo 
  • Moving Averages 
  • MACD 
  • Moving Flow Index (MFI)
  • Parabolic Sar 
  • Relative Strenght Index (RSI)
  • Relative Vigor Index (RVI)
  • Stochastic Oscillator 
  • Williams Percent Range (WPR)

The main goal for this algorithm is to determine accurately the perfect moment to buy or to sell to achieve huge profitable movements.

The trading system is suitable for experienced traders and beginners.

The signals can be used for manual trading (short-term or long-term trading), scalping or binaries.

Unique features:

  • Excellent precision and adaptability to the market 

  • Accurately calculate the market trend

  • It calculates and indicates the strongest of buying or selling 

  • It includes a dashboard which shows the result of the calculation indicating [strong buy-buy-strong sell-sell or neutral]

  • No repaintings

  • Works in all the time frames, pairs, symbols and 16 indicators minimum (to be increased)

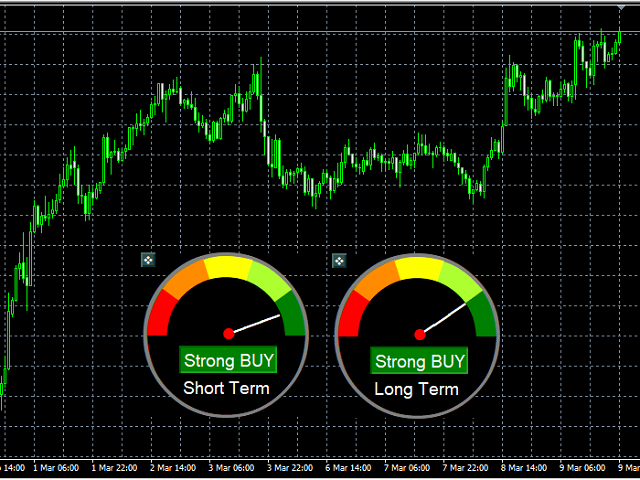
  • Very visual (speedometer) and simple to use it 

  • Possibility to change the settings instantly

  • No minimum account balance

How to use it

Step 1.-  Select the indicators desired and the TimeFrames desired (or just use the default ones)

Step 2.- Check the results showed on the dashboard to know instant information about the market.

Step 3.- Buy or sell according to the speedometer 

Input Parameters:

  • Visual Rectangular Speedometer: In case you can't see the circular speedometer or you simply don't like it, you can use the rectangular version
  • Alerts: Short and Long Term alerts when the speedometer enters in SELL/BUY or Strong SELL/BUY zone.
  • Indicators: To can turn ON or OFF the indicators you want to use.
  • Time Frames: To can turn ON or OFF the timeframes you want to use.
  • Indicators Inputs: To modify some of the inputs from the indicators in case you need a more specific combination.

Aditional Notes

  • Calculations for the Speedometer will be calculated according to the indicators and timeframes selected. 

  • The default inputs for all the indicators are already optimized to work under most of the markets and conditions. But you can modify them using your prefered ones.

  • This is a heavy indicator, running on multiple timeframes and doing complex calculations for the speedometer. Backtesting such indicators is always slower than normal indicators. Therefore we recommend to backtest it using the option "control prices" instead of "every tick". 

Your opinion is important to us, please leave a comment. Thank you.


评论 7
geceler001
39
geceler001 2021.08.01 12:20 
 

I would like to thank Ramon at first, and then I would like to thank the Mathematic Trading team, this indicator changes the perspective of graphics. This system, which consists of 16 indicators' instant right-hand signals in one place, makes my work easier and keeps trend tracking strong. I hope that the updates will continue and I hope that this software will come to better places. <

片山貴文
52
片山貴文 2020.12.16 18:53 
 

With this indicator, you can trade easily. It allows you to see what is happening without having to display multiple oscillators. However, I use oscillators when I trade, and I can trade in a dramatically shorter time. I heard that there are plans for future updates.

I expect it to be even more accurate than it is now.

If possible, I would like to see a future prediction function and a function to search for other currency pairs that have an advantage.

I know this is a luxury order.

jpenjerry
348
jpenjerry 2020.12.08 22:16 
 

good supporting tools

推荐产品
Noize Absorption Index - is the manual trading system that measures the difference of pressure between bears forces and bulls forces. Green line - is a noize free index that showing curent situation. Zero value of index shows totally choppy/flat market.Values above zero level shows how powerfull bullish wave is and values below zero measures bearish forces.Up arrow appears on bearish market when it's ready to reverse, dn arrow appears on weak bullish market, as a result of reverse expectation. S
199 USD
Forex Gump
Andrey Kozak
2.83 (6)
Forex Gump is a fully finished semi-automatic trading system. In the form of arrows, signals are displayed on the screen for opening and closing deals. All you need is to follow the instructions of the indicator. When the indicator shows a blue arrow, you need to open a buy order. When the indicator shows a red arrow, you need to open a sell order. Close orders when the indicator draws a yellow cross. In order to get the most effective result, we recommend using the timeframes H1, H4, D1. There
147 USD
这是一个预测蜡烛收盘价的指标。 该指标主要用于 D1 图表。 该指标适用于传统外汇交易和二元期权交易。 该指标可以用作独立的交易系统,也可以作为您现有交易系统的补充。 该指标分析当前蜡烛,计算蜡烛本身内部的某些强度因素,以及前一根蜡烛的参数。 因此,该指标预测市场走势的进一步方向和当前蜡烛的收盘价。 由于这种方法,该指标既适用于短期盘中交易,也适用于中长期交易。 该指标允许您设置指标在分析市场情况期间将产生的潜在信号的数量。 在指标设置中有一个特殊的参数。 此外,该指标可以通过图表上的消息、电子邮件以及推送通知的形式通知新信号。感谢您的关注!交易愉快! 购买后一定要写信给我! 我会给你我的交易指标的建议! 还可以获得奖金!
65 USD
The Th3Eng PipFinite indicator is based on a very excellent analysis of the right trend direction with perfect custom algorithms. It show the true direction and the best point to start trading. With StopLoss point and Three Take Profit points. Also it show the right pivot of the price and small points to order to replace the dynamic support and resistance channel, Which surrounds the price. And Finally it draws a very helpful Box on the left side on the chart includes (take profits and Stop loss
89 USD
Master scalping M1
Nataliia Marchuk
Master Scalping M1 is an innovative indicator that uses an algorithm to quickly and accurately determine the trend.The indicator calculates the time of opening and closing positions, the indicator's algorithms allow you to find the ideal moments to enter a deal (buy or sell an asset), which increase the success of transactions for most traders. Benefits of the indicator: Easy to assemble, does not overload the chart with unnecessary information. Can be used as a filter for any strategy. Works on
30 USD
PZ Trend Trading
PZ TRADING SLU
4.75 (4)
许多盈利交易者不仅知道如何识别市场趋势,而且也能把握趋势建立后的交易机会。 Pz 趋势交易 指标设计用来在趋势行情中尽可能的赚取利润。 已建立的趋势提供了一揽子交易机会,但大多数趋势交易指标完全忽视了它们,让交易者在趋势行情时完全不知道该如何做!一般趋势指标只通知有关的趋势变化,但根本不足以得到卓越的回报. Pz 趋势交易 指标比一般趋势指标显示多达 20 倍的交易 , 因为它注重所谓的市场时机。它不仅显示当前的市场趋势,也有回调,内柱线的突破和调整。它令您在趋势回调之后介入,安全的柱线内突破金字塔加仓,以及发现潜在的反转,和已知的调整。 趋势改变 一个趋势改变在市场方向变化时发生。趋势变化在图表上用带数字的彩色圆圈显示。蓝色 (1) 信号为上涨开始, 而红色 (1) 信号为下跌开始。趋势变化并非评估当前价格动作的结果, 它意味着交易设置是不定时地。如果您正确使用本指标, 在趋势变化时, 您将将已经入场 (参看下面的调整)。 回调 但凡趋势在运动中,行情上下抖动,盈利者收割利润,且其它参与者入场。趋势回调代表好的买入机会,通常是由主力获利离场导致。如果行情在回调后回归上行, 指
125 USD
HMA Trend Professional MT4
Pavel Zamoshnikov
4.57 (7)
Improved version of the free HMA Trend indicator (for MetaTrader 4) with statistical analysis. HMA Trend is a trend indicator based on the Hull Moving Average (HMA) with two periods. HMA with a slow period identifies the trend, while HMA with a fast period determines the short-term movements and signals in the trend direction. The main differences from the free version: Ability to predict the probability of a trend reversal using analysis of history data. Plotting statistical charts for analyz
30 USD
Infinity Trend Pro
Yaroslav Varankin
1 (1)
This is a trend indicator without redrawing Developed instead of the binary options strategy (by the color of the Martingale candlestick) Also works well in forex trading When to open trades (binary options) A signal will appear in the place with a candle signaling the current candle It is recommended to open a deal for one candle of the current timeframe M1 and M5 When a blue dot appears, open a deal up When a red dot appears, open a trade down. How to open trades on Forex. When a signal is rec
1 000 USD
PipFinite Energy Beam
Karlo Wilson Vendiola
3.94 (17)
Pipfinite creates unique, high quality and affordable trading tools. Our tools may or may not work for you, so we strongly suggest to try the Demo Version for MT4 first. Please test the indicator prior to purchasing to determine if it works for you. We want your good reviews, so hurry up and test it for free...we hope you will find it useful. Combo Energy Beam with Swing Control Strategy: Confirm swing pullback signals Watch Video: (Click Here) Energy Beam with Trend Laser Strategy: Confirm Tr
88 USD
PipFinite Exit EDGE
Karlo Wilson Vendiola
4.88 (155)
Did You Have A Profitable Trade But Suddenly Reversed? In a solid strategy, exiting a trade is equally important as entering. Exit EDGE helps maximize your current trade profit and avoid turning winning trades to losers. Never Miss An Exit Signal Again Monitor all pairs and timeframes in just 1 chart www.mql5.com/en/blogs/post/726558 How To Trade You can close your open trades as soon as you receive a signal Close your Buy orders if you receive an Exit Buy Signal. Close your Sell orde
88 USD
TWO PAIRS SQUARE HEDGE METER INDICATOR Try this brilliant 2 pairs square indicator It draws a square wave of the relation between your two inputs symbols when square wave indicates -1 then it is very great opportunity to SELL pair1 and BUY Pair2 when square wave indicates +1 then it is very great opportunity to BUY pair1 and SELL Pair2 the inputs are : 2 pairs of symbols         then index value : i use 20 for M30 charts ( you can try other values : 40/50 for M15 , : 30 for M30 , : 10 for H1 ,
10 USD
Trade with Gann on your side!! MASTER CIRCLE 360 CIRCLE CHART, originally created by Gann admitted that this is “The Mother of all charts”. It is one of the last studies that this great trader left for us. The numeric tab le is apparently quite simple like all the tables and is based on square numbers, the SQUARE OF 12 and is by evolution, one of the most important square numbers. Here we can find CYCLE, PRICE AND TIME thanks to angles and grades, to show past and future support and resistance.
149.99 USD
Trend Bilio
Ivan Simonika
Trend Bilio - an arrow indicator without redrawing shows potential market entry points in the form of arrows of the corresponding color: upward red arrows suggest opening a buy, green down arrows - selling. The entrance is supposed to be at the next bar after the pointer. The arrow indicator Trend Bilio visually "unloads" the price chart and saves time for analysis: no signal - no deal, if an opposite signal appears, then the current deal should be closed. It is Trend Bilio that is considered
140 USD
Accuracy of correct predictions 83%! This indicator was tested on the basis of real statistics for all market indicators according to indicators for 3 months of trading. 83% of correct trade forecasts for usd / jpy on the m30 time frame were received on our statistics! if you have any questions, please contact us in private messages or in discussions under this indicator and we will figure it out and help any questions will arise personal messages or in discussions under this indicator As soon
100 USD
To get access to MT5 version please click here . - This is the exact conversion from TradingView: "Stochastic Momentum Index" By "UCSgears". - This is a popular version of stochastic oscillator on tradingview. - This is a light-load processing and non-repaint indicator. - Buffers are available for the lines on chart. - You can message in private chat for further changes you need. Thanks for downloading
40 USD
MT4 指标。 自动画出三个级别的 Fibonacci 支撑阻力位。 分别为: 月线级别:紫色 周线级别:红色 日线级别:蓝色 颜色可通过参数调整。 MT5版本请移步: https://www.mql5.com/zh/market/product/80068 此指标主要用来分析将来的支撑与阻力位,以便更好过行交易分析。 如果在支撑位多次有效支撑,行情再往上突破前期高点,有效的 趋势突破 做多。 如果下跌之后,行情多次上冲不过压力位,再次下行向下突破前期低点,有效的趋势突破做空位置。 当行情走到历史的高低点时,图表上可能只画出两个级别的 Fibonacii 线,没有日线级别的提示,这是正常的,因为指标需要等到行情回调一定的空间才会绘制,指标自动过滤的在高点价格区间的小幅波动,还不足以用来分析短周期的有效支撑与阻力位置。 关于参数: high or low prices previous day-lines:如果月线级别画的高点不符合图表,请调整此参数,一般是前期高(低)点到现在日线K线数量。 Month level color:月线级别的线条及文件提示颜色 Weekly Lev
40 USD
Heiken Ashi candle chart is an improved version of The Japanese candle chart, which can effectively filter the market "noise" of the Japanese candle chart. It is favored by many traders for its simplicity and intuition. For trend traders, the HA candle chart is a magic tool. Unlike the traditional Japanese candle chart, Heikenashi does not reflect the opening price, high price, low price and closing price of the market. Instead, Heikenashi calculates the value of a single K line in the dominant
30 USD
[ MT5 Version ] Supply and Demand Multitimeframe Supply and Demand Multitimeframe is the first indicator in the market that combines multiple aspects like trading volume, price structure and momentum to identify Supply and Demand zones for every asset. The Supply and Demand indicator analyzes simultaneously up to 4 different TFs and represents their information in the current graph. Its interactive UI highlights everytime the price enters a Supply or Demand zone even if the zones are not visib
224 USD
Cosmic Diviner X Planet
Olena Kondratenko
4 (2)
This unique multi-currency strategy simultaneously determines the strength of trends and market entry points, visualizing this using histograms on the chart. The indicator is optimally adapted for trading on the timeframes М5, М15, М30, Н1. For the convenience of users, the indicator renders the entry point (in the form of an arrow), recommended take profit levels (TP1, TP2 with text labels) and the recommended Stop Loss level. The take profit levels (TP1, TP2) are automatically calculated for
79 USD
Th3Eng PipFinite Pro
Ahmed Farag
5 (1)
This is not Th3Eng PipFinite indicator It is Th3Eng PipFinite PRO ==> based on another logic and algorithms (Th3Eng PipFinite Original is here ) Attention: New update arrived for Th3Eng PipFinite PRO EA. So please contact us to get the new one. The Th3Eng PipFinite Pro indicator is based on an analysis of the right trend direction with perfect custom algorithms. It show the true direction and the best point of the trend. With Stop Loss point and Three Take Profit points. Also it show the righ
150 USD
Akendicator X
Flavio Graziano
Akendicator X is a Non-repainting Indicator for trading at 5-15 minutes Timeframe.  Akendicator X extimates with clear arrows, in which direction the next candlestick will move. Pratically, when the length of the last candle reaches and exceeds a particular value (called Candle Power) immediately, after its closing, an arrow appears indicating whether the next candle could be Bullish or Bearish. I created a manual in pdf where you should learn exactly how to use AKENDICATOR X correctly; I will s
30 USD
Laguerre SuperTrend Clouds adds an Adaptive Laguerre averaging algorithm and alerts to the widely popular SuperTrend indicator. As the name suggests, Laguerre SuperTrend Clouds (LSC) is a trending indicator which works best in trendy (not choppy) markets. The SuperTrend is an extremely popular indicator for intraday and daily trading, and can be used on any timeframe. Incorporating Laguerre's equation to this can facilitate more robust trend detection and smoother filters. The LSC uses the impro
30 USD
Meta Sniper
Samir Tabarcia
Requirements Optimized to work with   EURUSD-EURCHF-USDJPY, AUDUSD-CADJPY-AUDNZD, CHFJPY-NZDJPY-NZDUSD For timeframe 4H. *(Minimum recommended deposit is $300 for each Pair) for initial lot set to 0.10, My favorite Pair are (CHFJPY-NZDJPY-EURUSD-AUDNZD-USDJPY) Warning it will be SALE only 5 Copys at 60$ Then it will be update up to 200$  You can use it the way it is, For new Set Files will be add on (Comments) ECN broker with low spread is recommended to get better results. Setup is
60 USD
Scalping Modulator
Andrey Kozak
5 (1)
Scalping Modulator is a scalping trading system. The indicator consists of several analytical modules. It automatically analyzes the market and shows the trader all the necessary information for trading. Scalping Modulator draws two trend lines on the chart. One line shows the long-term direction of the price, the second line shows the medium-term direction of the price. The indicator also draws red and blue dots on the chart. They indicate a likely change in price movement. In order to open a
147 USD
5 signal in 1  Product     TimeFrame   Recommend   1m-5m recommend  signal   TF  5m    Banks Pro Binary Option is Indicator for binary option Can Use Manaul Trade or Robot on Platform  Mt2Trading  https://www.mt2trading.com/?ref=104    Time Trading   good work  EU session    Recommend  Curency   EUR  GBP USD        careful   AUD JPY      Recommend  Martingale 2-5 Step   Recommend  set profit  2%-5%/Day Setting Brake  News Event High volatility   recommend  15-30 min Have Problem Contract
120 USD
ProTrading Arrow
Nedyalka Zhelyazkova
5 (1)
" UNIQUE TRADING APPROACH TO TRADE LIKE A PRO TRADER ! " Following the trend successfully is important for every trader and is not easy endeavor even for professional traders. To trade comfortably and execute successful trades you need a good indicator for sure and trading plan which is determined individually. ProTrading Arrow is a trend reversal system never before released that works with trending, sideways and volatile markets . buy signal on a new buy arrow signal. sell signal on a new
50 USD
Trendiness Index
Libertas LLC
5 (3)
"The trend is your friend" is one of the best known sayings in investing, because capturing large trendy price movements can be extremely profitable. However, trading with the trend is often easier said than done, because many indicators are based on price reversals not trends. These aren't very effective at identifying trendy periods, or predicting whether trends will continue. We developed the Trendiness Index to help address this problem by indicating the strength and direction of price trend
49 USD
Market Shaver
Remi Passanello
市场剃须刀   市场黄牛 该指标是 RPTrade Pro Solutions 系统的一部分。 Market Scalper 是使用价格行为、动态支撑和阻力的每日趋势指标。 它旨在供任何人使用,即使是绝对的交易初学者也可以使用它。 从不重新粉刷。 指示是从接近到接近给出的。 设计为单独使用,无需其他指标。 为您提供清晰简单的指示 它是如何工作的 Market Shaver 正在使用 Dual TimeFrames 系统。 主要趋势由较高的 TF 采取,而较快的 TF 用于关闭交易 交易是一一指示的,永远不会同时进行两笔交易。 市场剃须刀表示: 何时进行交易 何时停止它,盈利或亏损。 交易奖励 许多统计数据可帮助您设置正确的 Period end TF 市场剃须刀工作 使用任何工具,如外汇对、指数、金属、期货或任何其他工具。 从 M1 到 H1。 与任何经纪人。 (较低的点差会给您带来更多的点数) 市场剃须刀功能 可靠的买入/卖出信号。 非常简单的输入。 (默认的应该适用于几乎所有的乐器) 屏幕提醒 + 推送通知 + 电子邮件通知 所有通知都非常详细,并且还提供
240 USD
Super Gator
Agustinus Biotamalo Lumbantoruan
This indi shows the following 1. Supertrend 2. Alligator (Not a regular alligator) 3. ZigZag 4. Moving Average 5. Trend Continuation/Mini correction Signal (plotted in X) (See screenshots in green background color 6. Early Signal Detection (See screenshots in green background color) You may treat Alligator as the lagging indicator The leading indicator is the supertrend. The zig zag is based on the leading indicator where it gets plotted when the leading indicator got broken to the opposite.
150 USD
PipFinite Channel Flow
Karlo Wilson Vendiola
4.67 (3)
Pipfinite creates unique, high quality and affordable trading tools. Our tools may or may not work for you, so we strongly suggest to try the Demo Version for MT4 first. Please test the indicator prior to purchasing to determine if it works for you. We want your good reviews, so hurry up and test it for free...we hope you will find it useful. Combo Channel Flow with Strength Meter Strategy: Increase probability by confirming signals with strength Watch Video: (Click Here) Features Detects ch
88 USD
该产品的买家也购买
Ultimate Sniper Dashboard
Hispraise Chinedum Abraham
4.78 (18)
折扣价为299美元! 未来可能会涨价! 请阅读下面的描述! 终极狙击手仪表盘的最佳进入系统。终极动态水平。(请查看我的产品) 由于MT4多币种测试的限制,终极狙击手仪表盘只适用于实时市场。 介绍Ultimate-Sniper Dashboard! 我们最好的产品包括HA-狙击手、MA-狙击手和许多特殊模式。终极狙击手仪表盘是一个绝对的野兽! 对于任何新手或专家交易者来说,这是最好的解决方案! 永远不要再错过任何一个动作! 对于那些喜欢简单和点数的交易者,我们有一个特别的产品给你。本质上很简单,该仪表板根据多种自定义算法查看28种货币对,完成所有工作。只需一张图表,你就可以像专家一样阅读市场。试想一下,如果你能在任何外汇对开始移动时准确地确定其方向,你的交易会有多大的改善。   我们的系统是为了寻找高概率信号并实时向用户发送警报。没有滞后或错误的信号。 为了保持图表的清洁,你可以在不需要时隐藏Ultimate-Sniper。只需按下箭头按钮即可隐藏仪表板。 Ultimate-Sniper适用于从1分钟到月度的所有时间框架,因此你可以在你选择的任何时间框架上快速
299 USD
目前八折优惠! 对任何新手或专家交易者来说都是最好的解决方案! 这个仪表板软件适用于28种货币对。它基于我们的两个主要指标(高级货币强度28和高级货币冲动)。它对整个外汇市场提供了一个伟大的概述。它显示高级货币强度值,货币运动速度和28个外汇对在所有(9)时间段的信号。想象一下,当你可以使用图表上的单一指标观察整个市场,以确定趋势和或剥头皮的机会时,你的交易将得到改善 我们已经在这个指标中建立了一些功能,使你更容易识别强势和弱势货币,同时识别和确认潜在的交易。该指标以图形方式显示货币的强势或弱势是增加还是减少,以及它在所有时间段的表现。 增加的新功能是动态市场斐波那契水平,它适应当前的市场条件变化,这是一个已经在我们的高级货币强度28和高级货币冲动指标中使用的成熟的加分项。 在交易时,总是将弱势货币和强势货币配对,这个新指标将帮助你做到这一点。 用户手册:点击这里  https://www.mql5.com/en/blogs/post/708783 特点  显示每个时间段的ACS28和GAP-speed(冲动)的货币强度值。 列:颜色代码以7种颜色
199 USD
Ultimate Dynamic Levels
Hispraise Chinedum Abraham
4.86 (7)
目前正在进行节日折扣,价格为399美元! 未来价格可能会上涨。请阅读下面的描述!   介绍 Ultimate Dynamic Levels - Ultimate Sniper Dashboard的最佳入场指标! 极低风险的及时进场和高RR!! 在这里找到终极狙击手仪表板。 对于初学者和职业交易者来说,最重要的能力是准确判断市场最可能转向的位置和时间,以及如何安全进入并获利退出。 终极动态水平指标很容易告诉你市场转折的最高可能性在哪里,这样你就可以自信地进入一个极低风险的交易,同时保持你的图表干净和简单,同时赚取美元! 终极动态水平指标有一个独特而强大的算法,可以同时在多个时间框架上找到重要的隐藏水平。它实在是太神奇了,而且永远不会像其他典型的SR指标那样重绘或重新绘制水平线!  终极动态水平指标还在图表的右侧有一个水平强度简介,以显示该水平在最近的历史上是否强劲。一个强大的奖励组合!!!。 终极动态水平指标有3个非常重要的功能。 1. 帮助你进入趋势方向的低风险交易。 2. 2.使你保持在趋势中,只要移动仍在进行。 3. 3.作为追踪止损,保护你的收益,避免把钱留
199 USD
Please send me Direct message on MQL5 CHAT after purchasing the Indicator for Training and Installation Support There are some additional files that is important to use with the Indicator . So be sure to contact me after purchasing the Indicator So that I can add you for training and support . If you find any difficulty with installation then send me Direct message here So that I can connect with you via Anydesk or Teamview for the product installation. " Smart Order Block Indicator " to find
249 USD
Spirit mt4
Alena Snigireva
5 (1)
Spirit mt4 is an indicator that works without flashing, the signals are triggered after the arrow at the beginning of the next candle Includes several indicators for overbought and oversold levels. Works with any currency pair: EUR/USD, AUD/USD and others. After the purchase, send me a private message and I will send you the settings that I use for this indicator. Suitable for trading cryptocurrencies. I like to trade cryptocurrency more, so I use it more there. It can also be used
800 USD
Cycle Sniper
Elmira Memish
4.63 (30)
NEW YEAR SALE PRICE FOR LIMITED TIME!!! Please contact us after your purchase and we will send you the complimentary indicators to complete the system. Cycle Sniper is not a holy grail but when you use it in a system which is explained in the videos, you will feel the difference. If you are not willing to focus on the charts designed with Cycle Sniper and other free tools we provide, we recommend not buying this indicator. We recommend watching the videos about the indiactor and system before
200 USD
Full Forex Market View Dashboard
Opengates Success International
5 (2)
完整的外汇市场视图仪表板指示器 这是一个自定义指标,旨在让交易者全面了解市场上正在发生的事情。 它使用实时数据访问市场并显示成功交易所需的每一点信息。 安装: 在将此指标附加到您的窗口图表之前,请转到您的 MT4 的市场观察面板并隐藏所有您不需要或交易的货币对,并将其余货币对留在那里。 原因是 FFMV 仪表板将显示出现在 MT4 市场观察中的所有货币对。 它最多可以显示 30 个或更少的货币对。 如果它超过您 MT4 的市场观察中的那个,它会模糊和毁坏 FFMV 仪表盘上的字体和图像! 它不会正确显示。 用法:      单人交易      对于篮子交易(见截图如何)      也可用于多单交易      确认从您自己的交易系统等收到的信号的有效性。 成分:      时间范围:从 M1 到 MN1 当前蜡烛状态(买入/卖出      趋势:币种整体走势      影响:货币变动的幅度/波动性,见下文:      建立:货币正在建立      好:货币越来越严重      高:币值值得关注      强:要考虑方向  
650 USD
Weis Wave with Alert
Panagiotis Diamantopoulos
4.78 (18)
20% Off from 499$ to 399$, offer end 31/3/2023    https://youtu.be/RjSSW0byp-I ** NEW PLUTUS SIGNALS and ALL IN ONE ** Wychoff's UpThrust + Spring, Fake Breaks and Plutus  trading signals added (for more info visit  http://www.tradethevolumewaves.com  ) Different Wave Types, choose what your cumulative Histogram diplays: Volume, Pips, Progressive Volume Rate, Time or Emphasized Volume Waves  **IF YOU PURCHASE DO NOT FORGET TO CONTACT ME BECAUSE THERE IS MORE: Two Hrs Webinar + Training Room
399 USD
Gann Dynamic Square
Naveen Saroha
5 (1)
INTRODUCING WORLD'S FIRST MT4 & MT5  Gann Dynamic Square, Circle and Equilateral Triangle  To Analyze Market Geometric Relationship. Gann Dynamic Square  has some of the most impressive features you will ever find in Gann & Geometric Analysis world. The Gann Dynamic Square is a tool to draw offset Square,Equilateral Triangle & Circle.Most charting software or MT4/MT5 market indicators don't have these features. You will be able draw your Geometric shapes like a professional geometric analys
399 USD
Introduction to EFW Analytics EFW Analytics was designed to accomplish the statement "We trade because there are regularities in the financial market". EFW Analytics is a set of tools designed to maximize your trading performance by capturing the repeating fractal geometry, known as the fifth regularity in the financial market. The functionality of EFW Analytics consists of three parts. Firstly, Equilibrium Fractal Wave Index is an exploratory tool to support your trading logic to choose which r
200 USD
Quantum Trends Indicator
QUANTUM TRADING SOFTWARE LIMITED
1 (1)
One of the oldest maxims in trading is ‘let the trend be your friend’. You must have come across it! This is easier said than done! First, you have to identify one, then you have to stay in – not easy. Staying in a trend to maximise your profits is extremely difficult. In addition, how do you know when a trend has started? It’s very easy to look back and identify the trend. Not so easy at the live edge of the market. The Quantum Trends indicator is the ‘sister’ indicator to the Quantum Trend Mon
197 USD
TPA True Price Action indicator reveals the true price action of the market makers through 100% non-repainting signals (except early signals mode) strictly at the close of a candle! TPA shows entries and re-entries, every time the bulls are definitely stronger than the bears and vice versa. Not to confuse with red/green candles. The shift of power gets confirmed at the earliest stage and is ONE exit strategy of several. There are available now two free parts of the TPA User Guide for our custo
168 USD
Supply and Demand Dashboard PRO
Bernhard Schweigert
4.79 (19)
目前八折优惠! 这个仪表板是一个非常强大的软件,可用于多个符号和多达9个时间段。 它是基于我们的主要指标(最佳评论:高级供应需求)。 Advanced Supply Demand 该仪表板提供了一个伟大的概述。它显示。   筛选后的供需值,包括区域强度评级。 区间内和区间外的点位距离。 它突出了嵌套的区域。 在所有(9个)时间段内,它对所选符号发出4种警报。 它是高度可配置的,以满足您的个人需求! 您的利益! 对每个交易者来说,最重要的问题是。 什么是入市的最佳水平? 在强大的供应/需求区域内或附近进入你的交易,以获得最佳的成功机会和风险/回报。 我的止损的最佳位置是哪里? 把你的止损放在强势供应/需求区的下方/上方是最安全的。 我的最佳盈利目标是什么? 你的退出策略和你的进入策略一样重要,了解更高的时间框架图可以帮助你。对于买入,使用下一个供应区作为目标,对于卖出,使用下一个需求区作为目标。在回撤到供应区或需求区时进场,以确保有足够的利润空间,达到更高的时间框架的供应和需求,将增加你的利润。 为什么我们要过滤强区和
199 USD
Ferox Breakout
Tat Dat Nguyen
The breakout algorithm is a technique based on price, price features, to shape a breakout strategy. The strategy in this indicator will not be redrawn (none-repaint indicator), it is suitable for short or long term traders In the screenshot is the EURUSD pair, these currency pairs, commodities or stocks, it have similar strength *Non-Repainting (not redrawn) *For Metatrader4 Only *Great For Scalping *Great For Swing Trading *Arrow Entry, Green is Long, Red is Short *Works On Any Timeframe *Work
9 900 USD
Order Block Indicator MT4
Diego Arribas Lopez
5 (2)
[ MT5 Version ] Order Block Indicator MT4 Order Block Indicator MT4  is currently the most accurate and customizable indicator in the market. It has been developed to facilitate the analysis of operations based on Order Blocks and Supply and Demand Zones. These zones are possible reversal points of a movement. Order Blocks indicate a possible accumulation of orders in one area. The price usually gets to reach and react strongly to those areas. The most relevant levels for this reaction are the c
224 USD
Beast Super Signal
Dustin Vlok
4.78 (100)
购买该指标,即可免费获得价值 449 美元的 Beast Super Signal EA!   (仅限购买完整产品)。 正在寻找可以帮助您轻松识别有利可图的交易机会的强大外汇交易指标? Beast Super Signal 就是您的不二之选。 这个易于使用的基于趋势的指标持续监控市场状况,寻找新的发展趋势或跳入现有趋势。当所有内部策略一致且彼此 100% 融合时,Beast Super Signal 会发出买入或卖出信号,无需额外确认。当您收到信号箭头警报时,只需买入或卖出。 购买后给我留言,让我加入我的私人 VIP 群组! (仅限购买完整产品)。 购买后给我发消息以获取最新的优化设置文件。 此处提供 MT5 版本。 在此处 获取 Beast Super Signal EA。 查看评论部分以查看最新结果! Beast Super Signal 根据您偏好的 1:1、1:2 或 1:3 风险回报率建议入场价、止损和获利水平,让您放心交易。这个 Beast Super Signal 是 100% 不可重新绘制的,这意味着它永远不会重新计算或重新绘制,每次都
189 USD
Gartley Projection D
Oleksandr Medviediev
4.17 (6)
The indicator identifies the harmonic patterns (XABCD) according to developments of H.M.Gartley ( "Profits in the Stock Market" , 1935г). It projects D-point as a point in the perspective projection (specify ProjectionD_Mode = true in the settings). Does not redraw. When a bar of the working timeframe closes, if the identified pattern point has not moved during Patterns_Fractal_Bars bars, an arrow appears on the chart (in the direction of the expected price movement). From this moment on, the ar
300 USD
WORLD'S FIRST AUTO SCALED GANN PERCENTAGES CHANEL AND GANN GRID                                                                     W.D. Gann Grid With auto Scale & Percentage Change.. Gann Grid is unique concept to finding major turning points  and Support/resistance level Our tools has additional feature for Scale point input method and price percentage method to use any stock and commodities charts scale. Normally people are using fix grid for a
300 USD
本指标是实践实战交易完善的波浪自动分析的指标!  注:波浪分级用西方叫法不习惯,因 受到缠论(缠中说禅)命名方式习惯的影响,我是将基础波浪命名为 笔 , 将二级波段命名为 段 , 同时具有趋势方向的段命名为 主趋段 (以后笔记中都是这种命名方式,先告知大家),但是算法上和缠论关系不大切勿混淆.反映的是本人分析盘面总结的 千变万化纷繁复杂的运行规律 . 对波段进行了标准化定义,不再是不同人不同的浪 , 对人为干扰的画法进行了排除,在严格分析进场起到了关键的作用 . 使用这个指标,等于将交易界面提升美感,抛弃最原始的K线交易带你进入新的交易层次.如果不是为了交易,在宣传上也将使客户观感提升层次. 指标内容: 1. 基础波浪 (笔) : 首先我们找出了价格波动过程中的基础波动拐点,当然他的有序性还不算太强,为下一步的计算提供基础. 2. 二级波段( 段 ) :在基础波浪的基础上,通过算法分析得到层级更明显的二级波段,二级波段为波浪提供了分析基础 3. 波浪( 浪 ): 有着更清晰的趋势,更清晰直观的方向.分析一个波浪是否延续,需要看二级波段的形态,分析二级的构成,可以得出波浪后续的预
188 USD
Gartley Hunter Multi MT4
Siarhei Vashchylka
5 (2)
The Gartley Hunter Multi indicator is designed to search for Gartley patterns on a very large number of currency pairs (maximum 60) and on all standard time frames (m1, m5, m15, m30, H1, H4, D1, Wk, Mn) at the same time. The search is carried out automatically. After finding the pattern, the indicator will send an Alert or notification to the mobile phone. List of patterns At the moment, there are patterns in the indicator: Alternate bat Bat Butterfly Crab Cypher Deep crab Gartley Indicator cont
199 USD
NAM Order Blocks
NAM TECH GROUP, CORP.
5 (1)
MT4多時限訂單塊檢測指示器。 特徵 -在圖表控制面板上完全可自定義,提供完整的交互。 -隨時隨地隱藏和顯示控制面板。 -在多個時間範圍內檢測OB。 -選擇要顯示的OB數量。 -不同的OB用戶界面。 -OB上的不同過濾器。 -OB接近警報。 -ADR高低線。 -通知服務(屏幕警報|推送通知)。 概括 訂單塊是一種市場行為,它指示從金融機構和銀行收取訂單。著名的金融機構和中央銀行帶動了外匯市場。因此,交易者必須知道他們在市場上正在做什麼。當市場建立訂單塊時,它會像發生大多數投資決策的範圍一樣移動。 訂單建立完成後,市場將朝著上升和縮小的方向發展。訂單大宗交易策略的關鍵術語是它包括機構交易者正在做的事情。由於它們是主要的價格驅動因素,因此包括機構交易在內的任何策略都可以。 您將在任何時間範圍內實時看到訂單塊,使用我們的控制面板,您將能夠在所選的歷史記錄週期內檢測常規,拒收和未大寫的訂單塊。 現在您可以接收到訂單塊接近警報,我們在MT4上顯示屏幕通知,並將通知推送到您的手機!
200 USD
Quantum Volume Point of Control Indicator
QUANTUM TRADING SOFTWARE LIMITED
5 (1)
The Quantum VPOC indicator has been developed to expand the two dimensional study of volume and price, to a three dimensional one which embraces time. The volume/price/time relationship then provides real insight to the inner workings of the market and the heartbeat of sentiment and risk which drives the price action accordingly. The Quantum VPOC indicator displays several key pieces of information on the chart as follows: Volume Profile - this appears as a histogram of volume on the vertical pr
197 USD
XQ Forex Indicator MT4
Marzena Maria Szmit
The signal conditions are a combination of three indicators, and XQ Forex Indicators only display  medium and long-term trends . The indicator's efficacy has been improved with the addition of a filter that blocks out false signals. The XQ Forex Indicator can be used on FX pairs, CFDs, and Cryptocurrencies . There are two type of signals:  Buy or Sell and Big Long or Big Short It is possible to enable sending emails when a major trend-change signal is detected, as well as to display the alerts
199 USD
VTrende Pro mt4
Andrey Dyachenko
VTrende Pro MT4 - MTF indicator for trend trading with a display panel for MT5 *** Videos can be translated into any language using subtitles (video language - Russian) Although the signals of the VTrende Pro indicator can be used as signals of a full-fledged trading system, it is recommended to use them in conjunction with the Bill Williams TS. VTrende Pro  MT4 is an extended version of the VTrende indicator. Difference between Pro version and VTrende: - Time zones - Signal V - signal 1-
697 USD
If you've been trading for any time, you will almost certainly have come across the concept of support and resistance. This powerful and simple concept lies at the heart of technical analysis. It forms the cornerstone of price action trading. Strange to consider therefore, that such a key component of the traders chart has largely been ignored. Most Forex traders still draw their lines manually, leading to a crude interpretation of these key levels. Even those companies who have developed a trad
197 USD
Introduction Excessive Momentum Indicator is the momentum indicator to measure the excessive momentum directly from raw price series. Hence, this is an extended price action and pattern trading. Excessive Momentum Indicator was originally developed by Young Ho Seo. This indicator demonstrates the concept of Equilibrium Fractal Wave and Practical Application at the same time. Excessive Momentum detects the market anomaly. Excessive momentum will give us a lot of clue about potential reversal and
200 USD
Elliott Wave Trend MT4
Young Ho Seo
4 (7)
Elliott Wave Trend was designed for the scientific wave counting. This tool focuses to get rid of the vagueness of the classic Elliott Wave Counting using the guideline from the template and pattern approach. In doing so, firstly Elliott Wave Trend offers the template for your wave counting. Secondly, it offers Wave Structural Score to assist to identify accurate wave formation. It offers both impulse wave Structural Score and corrective wave Structure Score. Structural Score is the rating to sh
200 USD
Native Channels MT4
BeeXXI Corporation
5 (2)
This indicator recognizes all support and resistance levels. A number of unique high-performance techniques have been applied, which made the existence of this indicator possible. All formed channels are naturally visible: horizontal linear linear parabolic cubic (Polynomial 3 degrees - Wave) This is due to a bundle of approximating channels. The formed channels form "standing waves" in a hierarchical sequence. Thus, all support and resistance levels are visible. All parameter management is
177 USD
Introduction to X3 Chart Pattern Scanner X3 Cherart Pattern Scanner is the non-repainting and non-lagging indicator detecting X3 chart patterns including Harmonic pattern, Elliott Wave pattern, X3 patterns, and Japanese Candlestick patterns. Historical patterns match with signal patterns. Hence, you can readily develop the solid trading strategy in your chart. More importantly, this superb pattern scanner can detect the optimal pattern of its kind. In addition, you can switch on and off individu
250 USD
SMT Divergence
Divyansh Preet Lal
SMT DIVERGENCE *NEW UPDATE* ICT Highs/Lows and Fractals are now included in the indicator and can be adjusted in the indicator's settings. _________ This newly updated version of the SMT DIVERGENCE indicator now allows to you to see SMT that is occurring between 2 highly correlated pairs. It can function on   ALL PAIRS   by just inputting the correlated pair in the setting inputs. The indicator identifies ongoing and previously formed SMT between correlated pairs. It comes with an  alert system 
200 USD
作者的更多信息
Ultimate Supply Demand MT5
Ramon Sobrevals Arce
5 (2)
After working during many months, with the help of Neural Networks, we have perfected the ultimate tool you are going to need for identifying key price levels (Supports and Resistances) and Supply and Demand zones. Perfectly suitable to trigger your trades, set up your future actions, decide your Take Profit and Stop Loss levels, and confirm the market direction. Price will always move between those levels, bouncing or breaking; from one zone to another, all the remaining movements are just mark
79 USD
Ultimate Supply Demand
Ramon Sobrevals Arce
5 (4)
After working during many months, with the help of Neural Networks, we have perfected the ultimate tool you are going to need for identifying key price levels (Supports and Resistances) and Supply and Demand zones. Perfectly suitable to trigger your trades, set up your future actions, decide your Take Profit and Stop Loss levels, and confirm the market direction. Price will always move between those levels, bouncing or breaking; from one zone to another, all the remaining movements are just mark
79 USD
Harmonic Papallons
Ramon Sobrevals Arce
4.5 (2)
Automatically scans the chart to find Harmonic Patterns, and give you the chance to enter early in good operations. Also if selected, it will alert you in advance when future patterns appears, showing you a projection of a posible future pattern. The main goal  for this algorithm is to determine with high precision the moment when a trend ends and a new one begins. Giving  you the best price within a reversal.   We have added the "Golden Trade", we define it as the perfect order: For those orde
119 USD
Make Your Own TimeFrame
Ramon Sobrevals Arce
Would you like to set up the best time that fits your trading style? This indicator gives you this solution with ease. 1 minute, 2, 3, 10 or whatever you want, now you can have them all with a simple external window indicator. 5 seconds, 10, 30 or whatever seconds you want, now you can have those charts. You can visualize different timeframes when Backtesting strategies. The trading system is suitable for experienced traders and beginners. The charts can be used for manual trading (short-term o
30 USD
Trade Risk Management
Ramon Sobrevals Arce
5 (5)
This is a calculator that allows you to manage your trade risk in every trade. Decide in advance the risk you want to assume using Stop Loss or Take Profit; account percentage or specific amount of your currency.  You can also use this tool to can test faster your manual strategies, because Trade Risk Management can be perfectly used on backtesting    For new traders, this may become your favorite tool; allowing you to easily control the risk of your trades, and train your skills trading on B
39 USD
Marker Bands
Ramon Sobrevals Arce
4 (1)
This indicator consists in two different algorithms, in order to profit all fast movements created during noises of the market. First of all, it plots normalized trend bands to can filter the possible trades. The normalized trend bands are calcualted using an exclusive mathematical algorithm to has both the correct trend and the fast adaptability to the change of trends. With those bands you can know when you are inside the trend, or when you are outside. The second alhorithm uses a private
49 USD
Velas RENKO
Ramon Sobrevals Arce
Immediately plots renko bars in an external/indicator window.  One of the distinctive advantages Renko charts offer is the fact that they are not time dependent. Therefore, the new Renko blocks are only traced when the price moves higher or lower by the specified number of points.  For example, a 10 pip (100 points) Renko chart would plot the blocks when price moves 10 pips higher in an uptrend or 10 pips lower in a downtrend. Renko charts removes "noises" from the Market and i t helps to ident
30 USD
Tick Chart Window
Ramon Sobrevals Arce
Do you need precision? Tick charts show each change in the ask or bid; The chart updates whenever either price changes. Study the markets more deeply, with surgical precision. Tick Chart Window saves all the received ticks and shows them into a seperate window. Get the best entry price in the Market.               trade with precision trade good  Spread Register In the comment section you will see the highest spread, the lowest spread and the average spread since the indicator was loaded.
FREE
Strategy Improver
Ramon Sobrevals Arce
5 (3)
We are glad to introduce you to the tailor of the strategies and Ea. We have programmed this indicator to monitor the strategies you have selected. In other words, have you ever liked knowing what would happen if you chose “x” strategies? would you like to have the information of more than 50 strategies combinations to use it for further operations? If it so, you got the perfect tool. Strategy improver give you the answer. It provides you the information to filter your strategies to be the maxim
239 USD
Poseidon Advisor
Ramon Sobrevals Arce
3 (2)
Fully automated MT4 trades, not limit to currency pairs  Main Features: Low Risk (Stop loss established inside the EA and Maximum DrawDown in the inputs) No martingala, hedging or grids Lot manage programmed with an advanced Neuro networks. Works with all the markets and currency pairs. Not necesary to set up any input, all automatic Minimum recommended amount 1000 USD  Suitable for experienced traders and beginners! Recommendation: Use short Timeframes for better results. Maximum H1 timeframes
119 USD
Thor Advisor
Ramon Sobrevals Arce
5 (1)
Our Neuronal Network system has created this expert to make the best entries and exits in the market. It perfectly addapts to the pair and timeframe, you can use it everywhere! Unique combination created by our Artificial Intelligence. We build on the results. Great benefits, with excellent profit/risk ratio. This Expert Advisor is also able to run with high spreads. Check it out for yourself, download the demo and see the results!  Recomendations Backtesting on Every Tick or Control Points
199 USD
Marker Bands Pro MT5
Ramon Sobrevals Arce
This indicator is created by using an exclusive algorithm to indicate you Buy or Sell in an accurate way all the possibles reversals within a normalized trending bands. The main goal for this algorithm is to achieve fast profitable movements and aggressive retracement. Thanks to the normalized bands, using the noises of the market. We have added the "Golden Trade", we define it as the perfect order:   For those orders that had the perfect entry price. They were always in profit, or the final pr
49 USD
Automatically scans the chart to find Harmonic Patterns, and give you the chance to enter early in good operations. Also if selected, it will alert you in advance when future patterns appears, showing you a projection of a posible future pattern. The main goal  for this algorithm is to determine with high precision the moment when a trend ends and a new one begins. Giving  you the best price within a reversal.   We have added the "Golden Trade", we define it as the perfect order:   For those ord
119 USD
筛选:
geceler001
39
geceler001 2021.08.01 12:20 
 

I would like to thank Ramon at first, and then I would like to thank the Mathematic Trading team, this indicator changes the perspective of graphics. This system, which consists of 16 indicators' instant right-hand signals in one place, makes my work easier and keeps trend tracking strong. I hope that the updates will continue and I hope that this software will come to better places. <

ROBERT EDWARD BIRD
1165
ROBERT EDWARD BIRD 2021.05.18 06:17 
 

This is not a good indicator. More losses than gains trading with trend. Consistently changes not giving a good clear indication.

Ramon Sobrevals Arce
10951
来自开发人员的回复 Ramon Sobrevals Arce 2021.05.18 14:07
We are sad our indicator did not match your trading style, but you should befriend trends, correctly using them is the best way to make profits long term.
Meanwhile you don't like trends, maybe you should check our other indicators like Harmonic Papallons which trades on countertrend.
Farid Abdullah M Jarais
198
Farid Abdullah M Jarais 2021.04.22 04:44 
 

Good but needs add an alert

Ramon Sobrevals Arce
10951
来自开发人员的回复 Ramon Sobrevals Arce 2022.01.21 12:46
Thank you for your feedback. Alert has been added!
Richard Caughell
1463
Richard Caughell 2021.03.30 23:18 
 

用户没有留下任何评级信息

片山貴文
52
片山貴文 2020.12.16 18:53 
 

With this indicator, you can trade easily. It allows you to see what is happening without having to display multiple oscillators. However, I use oscillators when I trade, and I can trade in a dramatically shorter time. I heard that there are plans for future updates.

I expect it to be even more accurate than it is now.

If possible, I would like to see a future prediction function and a function to search for other currency pairs that have an advantage.

I know this is a luxury order.

jpenjerry
348
jpenjerry 2020.12.08 22:16 
 

good supporting tools

cam028
5066
cam028 2020.11.05 11:59 
 

good products it helps me find the trend

回复评论
版本 2.10 2022.06.27
- Big improvement on the trend calculation using all the indicators, working independently and working together.
- Individual Indicators signals = Buy / Neutral / Sell had been improved.
- Speedometer Calculation Improved
- Reduced the number of parameters and optimized the settings. (default does not need to be changed)
- Add Button for instant change Rectangular or Circular Speedometer.
- Improved the speed performance.
版本 1.16 2022.02.09
- Added alerts and notifications for Weakening: SELL/BUY, or Strong SELL/BUY.
版本 1.15 2021.07.31
- Added alerts and notifications for SELL/BUY, or Strong SELL/BUY.
版本 1.14 2020.10.12
Solved Demo bug
版本 1.13 2020.10.12
Solved minor visual bug.
版本 1.12 2020.10.09
Solved minor buy with buttons.
版本 1.1 2020.10.09
Solved minor bug with speedometer visuals.