KT Double Top Bottom MT4
- 指标
- 版本: 1.0
- 激活: 5

The double top bottom pattern is arguably one of the technical analysis's most popular chart patterns. These patterns are used to capitalize on recurring patterns and identify trend reversal patterns, thereby creating well-placed entry and exit levels.
The KT Double Top Bottom is based on these patterns and fine-tunes the trade signal development process for traders.
Features
- It's based on one of the most reliable trading patterns and brings some fine-tuning and automation to the process.
- Also features input line customizations to allow traders to extract the desired results.
- It can be used across all time frames and all financial markets.
- It can be combined with other indicators and trading strategies to yield better results.
The Double Top Pattern
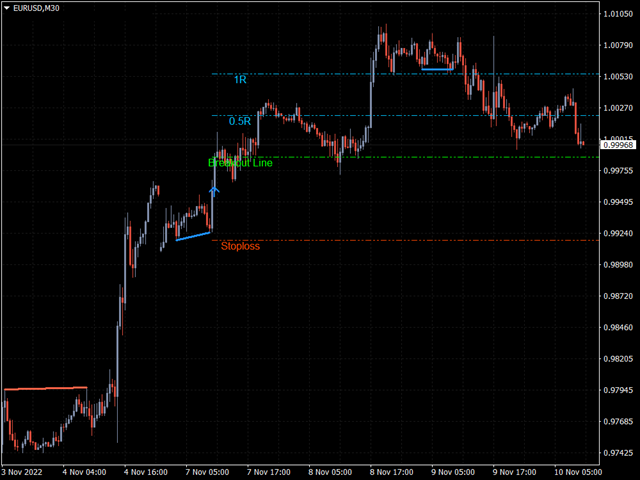
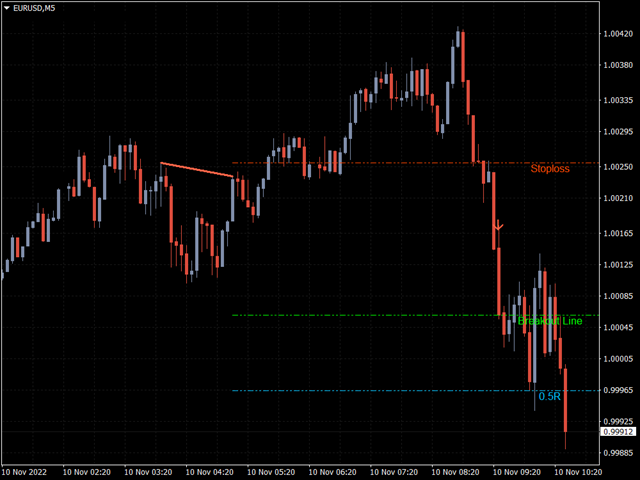
The double top pattern is a bearish pattern and highlights a sell signal. It shows that the price of an asset has rebounded twice but remains unable to sustain a bullish trend.
The double-top pattern almost always confirms a rapid price reversal drop in the making and is easy to identify.
This pattern has an “M” shape with two peaks and a “neckline” indicating a breakout. However, the M shape is not always perfect; a sighting of the double peaks is what matters.
To trade using the double-top pattern, launch a sell trade the instant the price move breaks below the pattern's neckline or begins on a pullback.
Only do this after the double peak has been confirmed and a protective stop-loss has been established.
The Double Bottom Pattern
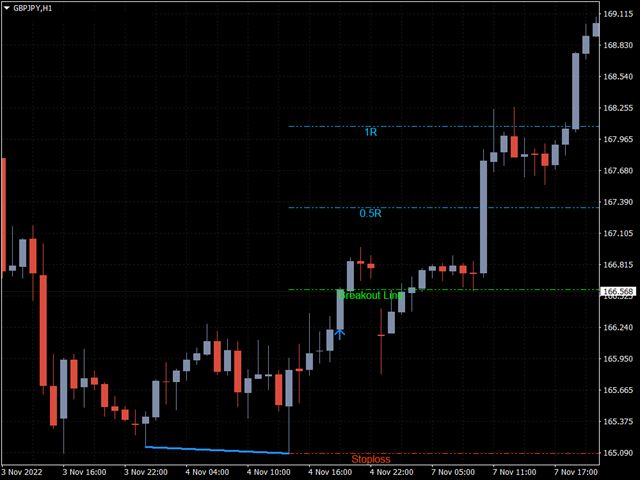
The double bottom is the opposite of the double top, indicating a bullish trading opportunity. It shows that the price has fallen to a particular mark on two occasions but has refused to break below it.
This pattern can be seen to take the “W” shape, with two bottoms and a neckline.
Once a double bottom is identified, it is almost certain that the underlying instrument's price will record a notable surge. Traders can execute a long position on confirmation of the pattern (breaking the neckline) and plot a stop-loss.