RegrReal
- 指标
-
Andriy Sydoruk
 https://www.mql5.com/ru/users/andreys/seller
Large selection of products for different tastes.
e-mail: andriisydoruk@gmail.com - 版本: 1.1
- 更新: 28 七月 2024
- 激活: 5
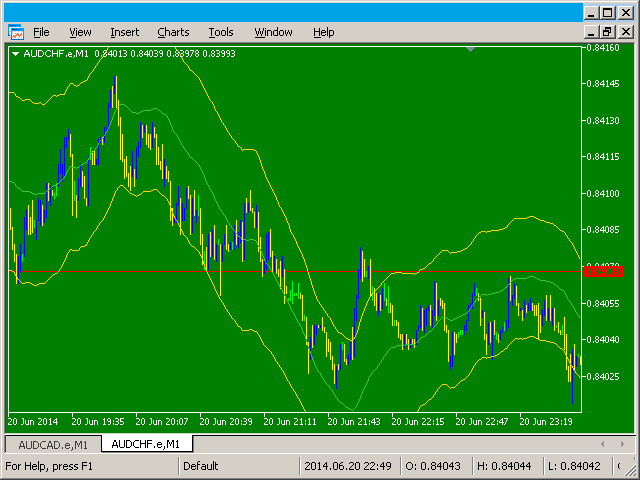
在 MetaTrader 5 中实现具有实时残差显示的回归通道
MetaTrader 5 中的回归通道由两条线组成,它们在回归趋势线的上方和下方等距。通道边界和回归线之间的距离由最高收盘价与回归线的偏差决定,这与最近的回归点相关。
问题和解决方案
通常,回归通道线会随着每个新条形图重新绘制,因此只有最新的点才相关。这会导致通道的历史准确性出现差异。为了解决这个问题并获得回归状态随时间变化的实时表示,有必要在每个时间点显示回归线而不重新绘制它们。这是该指标与常规回归通道之间的主要区别。
实施的主要好处
历史数据准确性:显示每个时间间隔的回归通道的实际状态使交易者能够看到通道随时间的变化,从而提高历史数据分析的准确性。
不重绘线:将回归线固定在每根柱线上,消除了不断重绘的问题,确保了分析的准确性和可靠性。
全面的趋势表示:保留通道的历史状态有助于更好地跟踪和了解长期趋势及其变化。
如何在 MetaTrader 5 中使用真实回归通道
指标安装:将真实回归通道指标添加到 MetaTrader 5 并根据您的需要配置其参数。
历史数据分析:使用真实回归线的显示来分析历史数据并识别一致的趋势。
交易策略优化:将指标纳入您的交易策略,以提高预测准确性和交易结果。
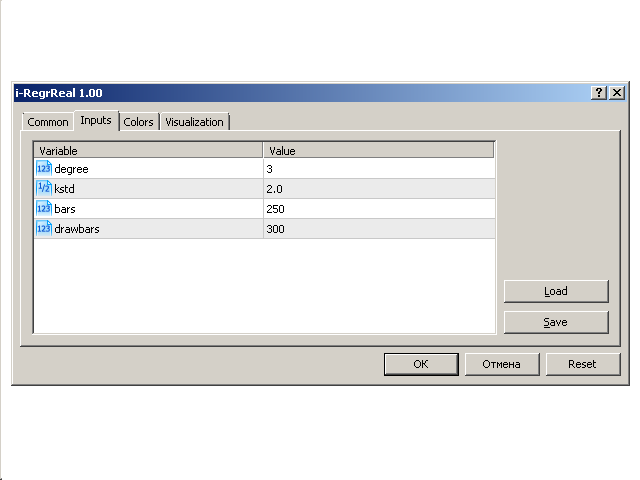
真实回归通道设置
ScalePips:所有价格参数的缩放。
MaximumDrawdown:关闭所有订单的回撤水平。
StopWorkingDrawdown:达到最大回撤后停止操作。
MaximumProfit:关闭所有订单的利润水平。
StopWorkingProfit:达到最大利润后停止操作。
Lot:固定交易量。
RiskOn:启用自动风险计算。
风险:风险水平。
点数正常修改风险:基于正常价格的风险水平调整。
止损修改风险:风险水平依赖于止损或止盈水平。
马丁捕捉逻辑:增加订单量的逻辑。
使用真实回归通道的优势
提高分析准确性:每根柱状图上实时显示回归线,为分析提供更准确的数据。
趋势预测:能够跟踪回归通道随时间的变化,有助于更好地预测市场趋势。
改进的交易策略:将指标整合到交易策略中可提高其效率和准确性。
历史可靠性:查看过去通道的真实状态可以进行更精确的历史分析。
结论
在 MetaTrader 5 中实现具有实时残差显示的回归通道为交易者提供了准确的市场趋势分析和改进交易策略的强大工具。这项创新消除了重绘线的问题,并确保了更精确和可靠的市场数据显示。在日常交易中使用此指标可以显著提高交易效率和盈利能力。