RegrReal

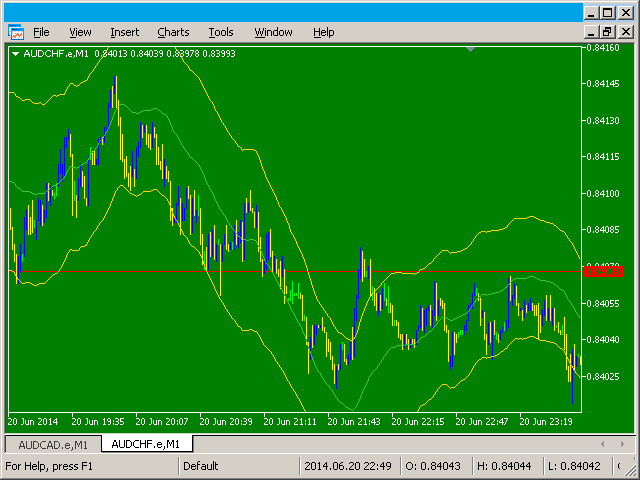
Implementation of Regression Channel in MetaTrader 5 with Real-Time Residual Display

The regression channel in MetaTrader 5 consists of two lines, equidistant above and below the regression trend line. The distance between the channel boundaries and the regression line is determined by the deviation of the highest closing price from the regression line, which is relevant for the most recent regression points.

Problem and Solution

Typically, regression channel lines are redrawn with each new bar, making only the latest points relevant. This leads to discrepancies in the historical accuracy of the channel. To address this issue and gain a real-time representation of the regression state over time, it's necessary to display the regression lines at each point in time without redrawing them. This is the key difference between this indicator and a regular regression channel.

Key Benefits of Implementation

  1. Historical Data Accuracy: Displaying the real state of the regression channel at each time interval allows traders to see how the channel changed over time, enhancing the accuracy of historical data analysis.

  2. Non-Redrawing Lines: Fixing the regression lines at each bar eliminates the issue of constant redrawing, ensuring analysis accuracy and reliability.

  3. Comprehensive Trend Representation: Preserving the historical state of the channel helps better track and understand long-term trends and their changes.

How to Use the Real Regression Channel in MetaTrader 5

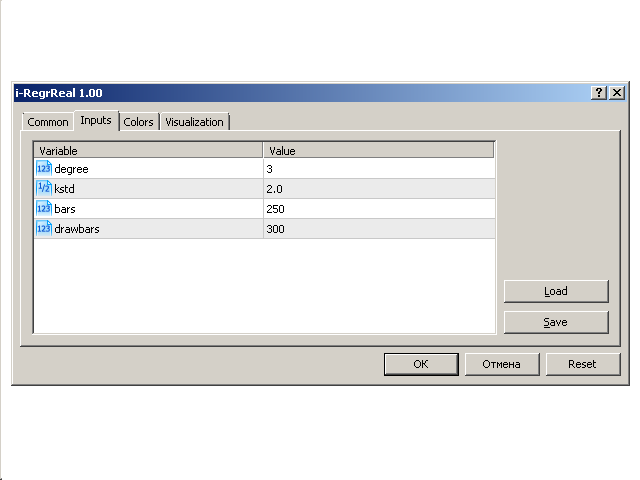
  1. Indicator Installation: Add the real regression channel indicator to MetaTrader 5 and configure its parameters according to your needs.

  2. Historical Data Analysis: Use the display of real regression lines to analyze historical data and identify consistent trends.

  3. Optimization of Trading Strategies: Incorporate the indicator into your trading strategy to improve forecast accuracy and trading results.

Real Regression Channel Settings

  • ScalePips: Scaling of all price parameters.
  • MaximumDrawdown: Drawdown level for closing all orders.
  • StopWorkingDrawdown: Stop operation after reaching maximum drawdown.
  • MaximumProfit: Profit level for closing all orders.
  • StopWorkingProfit: Stop operation after reaching maximum profit.
  • Lot: Fixed trade volume.
  • RiskOn: Enable automatic risk calculation.
  • Risk: Risk level.
  • PipsNormalModificationRisk: Risk level adjustment based on normal price.
  • StopsModificationRisk: Risk level dependence on Stop-Loss or Take-Profit levels.
  • MartinCatchingLogic: Logic for increasing order volume.

Advantages of Using the Real Regression Channel

  • Increased Analysis Accuracy: Real-time display of regression lines on each bar provides more accurate data for analysis.
  • Trend Prediction: Ability to track changes in the regression channel over time helps better predict market trends.
  • Improved Trading Strategies: Integrating the indicator into trading strategies enhances their efficiency and accuracy.
  • Historical Reliability: Seeing the real state of the channel in the past allows for more precise historical analysis.

Conclusion

The implementation of a regression channel with real-time residual display in MetaTrader 5 provides traders with a powerful tool for accurate market trend analysis and improved trading strategies. This innovation eliminates the problem of redrawing lines and ensures a more precise and reliable display of market data. Using this indicator in everyday trading can significantly enhance trading efficiency and profitability.


おすすめのプロダクト
TRI Visualizer Enhanced - 熱力学的市場分析の革命 概要 TRI(Thermal Range Indicator)Visualizer Enhanced は、従来のテクニカル分析を超越した、物理学の熱力学理論を応用した革新的なマーケット分析インジケーターです。市場の価格変動を「熱力学的エネルギー」として捉え、これまで見落とされていた市場の微細な変化を高精度で検出します。 革新的な仕組み 1. デュアル計算エンジン クラシックTRIモード 基本公式: |終値-始値| + (高値-安値) ローソク足の実体とヒゲを統合した純粋なボラティリティ測定 シンプルで直感的、あらゆる市場環境で安定動作 熱力学的TRIモード(独自開発) 価格加速度 :2次微分による価格変化の勢いを測定 出来高変化率 :相対的な出来高の変化を動的に評価 ポジションエネルギー :正規化された価格変動エネルギーを計算 熱力学的係数 :物理学の熱力学法則を市場分析に応用 2. 高度な平滑化システム SMA(単純移動平均) :基本的なノイズ除去 EMA(指数移動平均) :最新データ重視の平滑化
The Fractals indicator displays on the chart only fractals with the specified parameters in the indicator settings. This allows you to more accurately record a trend reversal, excluding false reversals. According to the classical definition of a fractal, it is a candlestick - an extremum on the chart, which was not crossed by the price of 2 candles before and 2 candles after the appearance of a fractal candle. This indicator provides the ability to adjust the number of candles before and after t
Terra Infinity is a flat indicator. This improved version of the CalcFlat indicator has three additional lines that significantly increase its effectiveness. Unlike its predecessor with two static levels, Terra Infinity adds three dynamic lines above the main histogram, which are interpreted as follows: base signal line, minimum signal line, maximum signal line. These lines are formed using the additional parameter Avg, which is the average value of the histogram. Averaging produces a line cl
サプライ/デマンドゾーン:過去に価格が何度も接近した観察可能な領域。 多機能ユーティリティ:  66+ 機能 ,このインジケーターを含む  |   質問があれば私に連絡  してください  |  MT4バージョン このインジケーターは、価格が再び反転する可能性のある場所を示します。 通常、価格がそのレベルで拒否された回数が多いほど、そのレベルは重要です。 入力設定で   調整できる項目: 弱いゾーン を有効または無効にします; ゾーンの説明 を表示または非表示にします; フォントサイズ;   基本色を設定:  サポートとレジスタンスごとに別々に: 選択した色は弱いゾーンでは薄くなり、チャートを視覚的に分析するのに役立ちます; ゾーン計算の時間枠; 需給ゾーン は、価格チャート上で過去に大きな買い(需要)または売り(供給)が発生した重要な領域です。これらのゾーンは、価格変動の 潜在的な反転または継続 を予測するのに役立ちます。需給トレードは、トレンドライン、移動平均線、オーダーフロー分析などの 他のツールと組み合わせる と最も効果的です。 需給ゾーンの特定方法: 需要ゾーン(買い圧力)
Professional MACD with 6 trading modes, divergence detection, adaptive periods,  and complete risk management system /SL,TP/ for all trader levels. Shows adaptive support and resistance! Shows the previous day: high , low and equilibrium price level! Providing trading suggestions! Choose your trading style and let the indicator configure itself automatically: - ** BEGINNER MODE** - Simple, safe signals with clear confirmations - ** INTERMEDIATE MODE** - Balanced approach for most traders 
MetaCOT 2 is a set of indicators and specialized utilities for the analysis of the U.S. Commodity Futures Trading Commission reports. Thanks to the reports issued by the Commission, it is possible to analyze the size and direction of the positions of the major market participants, which brings the long-term price prediction accuracy to a new higher-quality level, inaccessible to most traders. These indicators, related to the fundamental analysis, can also be used as an effective long-term filter
Boom and Crash Sniper Spike Detector - Boom 1000 The Boom and Crash Sniper Spike Detector is the ultimate tool for spike trading on Boom 1000, offering clear and reliable signals to help you capture high-probability trades. This advanced indicator is designed to enhance your trading strategy by simplifying spike detection and maximizing your profits. Key Features: Multi-Timeframe Compatibility : The indicator can be used on M1, M5, M15, M30, and H1 timeframes, but it works best on the M1 timefra
The Trend Detect indicator combines the features of both trend indicators and oscillators. This indicator is a convenient tool for detecting short-term market cycles and identifying overbought and oversold levels. A long position can be opened when the indicator starts leaving the oversold area and breaks the zero level from below. A short position can be opened when the indicator starts leaving the overbought area and breaks the zero level from above. An opposite signal of the indicator can b
Trendline Targets Dashboard MT5 Trendline Targets Dashboard MT5 は、MetaTrader 5 用のインジケーターで、完全なビジュアル・トレードプランを表示します。 シグナル 、 エントリー価格(Entry) 、 ストップロス(Stop Loss) 、および 利確目標(Take Profits) を、リスク比率 R に基づいて自動的に計算します。 このツールは注文を出すものではありません。トレードの分析と視覚的管理を目的としたツールであり、自動売買ロボット(EA)ではありません。 リリース記念特典: 購入者全員に、私の MQL5 プロフィールにあるお好きな インジケーターを1つ無料でプレゼント します。 ※ 注意: Market Structure Order Block Dashboard MT5 は特典対象外です。 特典を受け取るには、購入後に MQL5 メッセージ機能でご希望の製品名をお送りください。 主な機能 ネオンエフェクト付きトレンドライン(強気/弱気) ローソク足確定時のトレンド反転による BUY/SELL
The Market Matrix indicator is an effective tool for identifying trends in the Forex market. It serves as a reliable assistant for traders, helping to identify trend and flat zones. Below are the main characteristics and advantages of this indicator: Features of the Market Matrix indicator: Reliability and stability: The indicator does not redraw previous values, which ensures the stability of signals. Quick reaction to trend changes: The indicator algorithm allows you to quickly respond to tr
The RSI Divergence + FVG Signal indicator combines Relative Strength Index (RSI) Divergence with Fair Value Gap (FVG) detection to generate high-probability buy and sell signals based on both momentum shifts and institutional imbalance zones. Core Features: RSI Divergence Detection : Identifies both regular and hidden bullish/bearish divergences between price and RSI. Divergences indicate potential trend reversals or continuation. FVG Zone Recognition : Detects Fair Value Gaps (imbalances caused
Dual Confirmation PMAX-Supertrend Indicator: The Ultimate Trading Edge The Dual Confirmation PMAX-Supertrend Indicator represents a significant advancement in technical analysis tools for serious traders. This premium indicator combines two powerful trend-following systems into a single, streamlined solution that generates signals only when both systems agree, dramatically reducing false signals and improving trading precision. Superior Signal Accuracy Through Dual Confirmation Trading success d
STRICTLY FOR BOOM INDEX ONLY!!!!! Here I bring the Maximum Trend Arrows OT1.0 MT5 indicator. This indicator is made up of a combination of different trend indicators for entries and exits, for entries an orange arrow will paint on the chart below the current market and a red flag for closing of trades and it produces buy arrows only. When the orange arrow appears, it will appear along with it's sound to notify you. The 1H timeframe is recommended, don't use it anywhere else than on the 1H timefr
Hi Traders, MTF FVGs (Extend) – Smart Supply & Demand Zones. This indicator automatically identifies bullish (demand) and bearish (supply) FVG zones on your chart using multi-timeframe analysis . Zones are displayed as rectangles with optional midlines, helping you visualize key support and resistance levels more clearly. Key Features: Multi-timeframe support: detect zones on the current or higher timeframe Adjustable lookback period and minimum zone size Limit the number of visible bullish and
https://www.mql5.com/en/users/gedeegi/seller FIBO NOVA is an indicator based on EMA + ATR/StdDev , forming Fibonacci volatility bands (0.618 – 2.618) to detect trend direction (uptrend/downtrend) , Entry signals , Take Profit (Rejection) , and Bounce (trend continuation) . It comes with pop-up alerts & push notifications , and a clean visual display with trend-colored zones. Quick Usage Guide Identify Trend Only Lower Bands active (green) → uptrend, focus on buy setups. Only Upper Bands active
インジケーターは、可能な限り最小のラグで 再描画せず にチャートに高調波パターンを表示します。インディケータトップの検索は、価格分析の波動原理に基づいています。 詳細設定では、取引スタイルのパラメータを選択できます。ろうそく(バー)のオープニングで、新しいパターンが形成されると、価格変動の可能性のある方向の矢印が固定され、変更されません。 インジケーターは、次のパターンとその種類を認識します:ABCD、Gartley(Butterfly、Crab、Bat)、3Drives、5-0、Batman、SHS、One2One、Camel、Triangles、WXY、Fibo、Vibrations。デフォルトでは、ABCDとGartleyの数字のみが設定に表示されます。多くの追加の構成可能なパラメーター。 主なパラメータ: ShowUpDnArrows-予想される方向矢印を表示/非表示 ArrowUpCode-上矢印コード ArrowDnCode-下矢印コード Show old history patterns-古いパターンの表示を有効/無効にします Enable alert messages,
Trend Monitor MT5
Pavel Zamoshnikov
4.5 (2)
The indicator generates early signals basing on ADX reading data combined with elements of price patterns. Works on all symbols and timeframes. The indicator does not redraw its signals. You see the same things on history and in real time. For better visual perception signals are displayed as arrows (in order not to overload the chart). Features The best results are obtained when the indicator works on two timeframes. For example: M30 – the indicator shows the main trend; M5 – the indicator gen
MT4版  |  FAQ Owl Smart Levels Indicator は、 Bill Williams の高度なフラクタル、市場の正しい波構造を構築する Valable ZigZag、エントリの正確なレベルをマークする Fibonacci レベルなどの一般的な市場分析ツールを含む 1 つのインジケーター内の完全な取引システムです。 利益を得るために市場と場所に。 戦略の詳細な説明 インジケータを操作するための指示 顧問-取引助手 プライベートユーザーチャット ->購入後に私に書いて、私はプライベートチャットにあなたを追加し、あなたはそこにすべてのボーナスをダウンロードすることができます 力はシンプルさにあります! Owl Smart Levels 取引システムは非常に使いやすいので、専門家にも、市場を勉強し始めて自分で取引戦略を選択し始めたばかりの人にも適しています。 戦略と指標に秘密の数式や計算方法が隠されているわけではなく、すべての戦略指標は公開されています。 Owl Smart Levels を使用すると、取引を開始するためのシグナルをすばやく確認し、注文を出すための
Clever Parabolic RSI Parabolic SAR と RSI を組み合わせた、賢くて正確なオシレーター このオシレーターは、人気の高い2つのテクニカル指標 — Parabolic SAR と RSI — を融合させたインテリジェントなシステムで、 市場の状態 、 トレンドの強さ 、そして 売買のタイミング を明確に視覚化します。 仕組み: 緑の四角いドット が表示されたら、 上昇トレンドの開始 を示します 赤の四角いドット は、 下降トレンドの開始 を示します 最初のドットの後に 同じ方向のドットが3つ 続きます — 3つ目のドットの後にエントリー するのが基本戦略です スクリーンショットでは、 トレンド転換から3本のローソク足以内に正確なシグナル が出現している様子が確認できます 戦略と活用法: 5分足以上 のタイムフレームで優れたパフォーマンスを発揮 FX通貨ペア、商品、株価指数、暗号資産 など幅広く対応 スキャルピング、デイトレード、スイングトレード に最適 Clever Parabolic
Crypto_Forex MT5用インジケーター「ダイナミック売られ過ぎ/買われ過ぎゾーン付きCCI」(リペイント機能なし) - コモディティ・チャネル・インデックス(CCI)は、トレンド方向へのモメンタムトレードに最適です。 - ダイナミック買われ過ぎゾーンからの売りエントリー、およびダイナミック売られ過ぎゾーンからの買いエントリーを、主要トレンド方向へ行うのに最適です。 - このインジケーターは、プライスアクションエントリーと組み合わせるのも効果的です。 - ダイナミック買われ過ぎゾーン - 黄色線より上。 - ダイナミック売られ過ぎゾーン - 青線より下。 - CCIオシレーターは、現在価格と過去平均価格の差を測定します。 - PCおよびモバイルアラート機能付き。 高品質のトレーディングロボットとインジケーターをご覧になるにはここをクリックしてください! これは、このMQL5ウェブサイトでのみ提供されるオリジナル製品です。
Unlock the power of the trend with the Visual Trend Cascade Indicator, a meticulously crafted tool designed to identify high-probability trading opportunities by harmonizing multiple layers of market momentum. For just $30, this indicator offers a sophisticated yet intuitive approach to navigating the markets, helping you trade in alignment with the dominant trend. The Logic Behind the Visual Trend Cascade This indicator is built on a robust, multi-layered strategy that confirms trend direction,
The Riko Trend indicator is a revolutionary trend trading and filtering solution with all the important features of a trend tool built into one tool! The Riko Trend indicator is good for any trader, suitable for any trader for both forex and binary options. You don’t need to configure anything, everything is perfected by time and experience, it works great during a flat and in a trend. The Riko Trend indicator is a technical analysis tool for financial markets that reflects the current price f
2つのオシレーターを組み合わせたもの。 1 つ目はエントリーポイントを表示し、2 つ目は現在のトレンドを表示します。このインジケーターは、すべての高速オシレーター信号または現在のトレンドの方向のみの信号の 2 つのモードで、オシレーター信号を矢印で表示できます。マルチタイムフレームパネルと 3 種類のシグナル通知があります。 利点: デイトレードやスキャルピング取引に適しています トレンドフィルタリング シンプルかつ高感度なセットアップ マルチタイムフレームパネル アドバイザーへの統合に適しています。 あらゆるシンボルとあらゆるタイムフレームに対応 3種類の通知 MT4版→   こちら / 問題解決→   こちら 指標戦略 このインジケーターは 2 つの異なるオシレーターで構成されます。 遅いトレンド ライン (太い) - インジケーターの高レベルが上から下に交差する場合、それは下降トレンドのインジケーターであり、下側の水平レベル (インジケーターの低レベル) が下から上に交差する場合、それは下降トレンドのインジケーターです。上昇傾向。さらに、下のゾーンで遅い線が見つかった場合は、現
Trade history
Andriy Konovalov
5 (2)
The indicator plots charts of profit taken at the Close of candles for closed (or partially closed) long and short positions individually. The indicator allows to filter deals by the current symbol, specified expert ID (magic number) and the presence (absence) of a substring in a deal comment, to set the start time and the periodicity of profit reset (daily, weekly or monthly) to calculate the profit chart. The indicator also displays the floating (not fixed) profit of the opened positions at th
This trading indicator is non-repainting, non-redrawing, and non-lagging, making it an ideal choice for both manual and automated trading. It is a Price Action–based system that leverages price strength and momentum to give traders a real edge in the market. With advanced filtering techniques to eliminate noise and false signals, it enhances trading accuracy and potential. By combining multiple layers of sophisticated algorithms, the indicator scans the chart in real-time and translates comple
H4 Candles And OpenLine Sessions MT5 is a professional indicator for MetaTrader 5 that visualizes your trading sessions and key 4-hour candle ranges with clear, customizable boxes and stylish opening price lines. Highlight Asia , London , and New York market sessions plus up to 6 custom H4 candle ranges — each with fully adjustable colors, line styles, thickness, opacity, and labels. The powerful OpenLine feature marks the exact opening price for each session or H4 range, helping you instantly s
Order Flow Absorption (OFA) — Smart Footprint & Volume Panel Unlock true market intent. The Order Flow Absorption (OFA) indicator gives you an institutional view of market dynamics, highlighting aggressive buying/selling zones and footprint imbalances — with a clean, customizable dashboard. Key Features Buyer/Seller Footprint Panel Toggleable real-time panel shows current, previous, and total volume flow between buyers and sellers. Smart Absorption Detection Detects potential buyer or seller
Fit line supports to extrapolation next movement of market, support for buy/sell decision. Indicator using spline algorithm to extrapolation.  You can change number of spline with parameter "PointsNumber" and number of extrapolation point with "ExtrapolateBars". Eextrapolation points will be save into csv format, with prefix in parameter "PointsPrefix", and store in folder File of Data Folder.
Candle Fusion Pro — パターン認識 + トレンドフィルター + モメンタムフィルター(リペイントなし) 強力なローソク足パターンを検出し、リアルタイムのトレンドとモメンタム分析でその強さを確認しましょう。 Candle Fusion Pro は、 価格アクションの精度 、トレンド構造、 多層的な確認 を重視するトレーダーのための究極のビジュアルツールです。 主な機能 パターンベースのエントリー :10種類以上の高度な日本のローソク足パターンを検出します: 流れ星(レベル2、3、4) 強気/弱気の包み足(エンゴルフィング) モーニングスター/イブニングスター 十字線およびその派生形 ハンマー(レベル2、3、4) 差し込み線/黒い雲のカバー リペイントなし・遅延なし :矢印やパターンラベルはローソク足が確定した後にのみ表示されます。 見たままが真実です 。 リアルタイム確認 : トレンドフィルター (時間足に応じて自動調整) RSI強度ラベル :色で状態を表示(緑 <30、橙、赤 >70) ADXフィルター :トレンドの継続またはレンジを検出(しきい値は25): 強
ESS の戦略的シグナル このインジケーターは、フィルターが適用されたエンベロープ タイプのキャンドルを検出します。このフィルターは 3 つの戦略で構成されており、測定可能なパラメーター内で可能な最大の効果を識別することができます。 信号は方向ごとに上向き矢印と下向き矢印で示され、アラート、電子メール、モバイルへのプッシュ メッセージを有効または無効にすることもできます。 100% 効果的な指標はありません。そのため、テクニカル分析や他の指標の助けを借りて、独自の戦略の有効性を改善する必要があります。 ESS の戦略的シグナル このインジケーターは、フィルターが適用されたエンベロープ タイプのキャンドルを検出します。このフィルターは 3 つの戦略で構成されており、測定可能なパラメーター内で可能な最大の効果を識別することができます。 信号は方向ごとに上向き矢印と下向き矢印で示され、アラート、電子メール、モバイルへのプッシュ メッセージを有効または無効にすることもできます。 100% 効果的な指標はありません。そのため、テクニカル分析や他の指標の助けを借りて、独自の戦略の有効
このプロダクトを購入した人は以下も購入しています
このインジケーターを購入すると、プロ仕様のトレードマネージャーを無料で差し上げます。 まず第一に、このトレーディングシステムがノンリペイント、ノンリドロー、ノンラグのインジケーターであることを強調する価値がある。これにより、手動取引とロボット取引の両方に理想的なものになっています。 オンラインコース、マニュアル、プリセットのダウンロード。 「スマートトレンドトレーディングシステム MT5」は、新規および経験豊富なトレーダー向けにカスタマイズされた包括的なトレーディングソリューションです。10以上のプレミアムインジケーターを組み合わせ、7つ以上の堅実なトレーディング戦略を備えており、多様な市場状況に対応する多目的な選択肢となっています。 トレンドフォロー戦略:トレンドを効果的に乗り越えるための正確なエントリーとストップロス管理を提供します。 リバーサル戦略:潜在的なトレンドの反転を特定し、トレーダーがレンジ相場を活用できるようにします。 スキャルピング戦略:高速で正確なデイトレードおよび短期取引のために設計されています。 安定性:すべてのインジケーターはノンリペイント、ノンリドロー、ノ
Power Candles – あらゆる市場に対応した強度ベースのエントリーシグナル Power Candles は、Stein Investments が長年培ってきた強度分析を価格チャート上に直接反映します。価格だけに反応するのではなく、各ローソク足は実際の市場の強さに基づいて色分けされ、モメンタムの蓄積、強度の加速、明確なトレンド転換を瞬時に把握できます。 すべての市場に共通する単一ロジック Power Candles は すべての取引シンボル で自動的に動作します。現在のシンボルが Forex か非 Forex 市場かを自動判別し、内部で適切な強度モデルを適用します。 Forex および Gold :FX Power のデルタ値を使用(絶対値レンジ最大 100) 指数、暗号資産、CFD :IX Power の強度値を使用(絶対値レンジ最大 50) 必要な強度計算は Power Candles に直接組み込まれています。ローソク足のカラーリングやシグナルロジックに、追加のインジケーターは不要です。 価格ノイズではなく「強度状態」 各ローソク足は、以下の 9 つの明確に定義された強
このインジケーターを購入された方には、以下の特典を 無料 で提供しています: 各トレードを自動で管理し、ストップロスとテイクプロフィットを設定し、戦略ルールに基づいてポジションを決済する補助ツール 「Bomber Utility」 様々な銘柄に合わせたインジケーターの設定ファイル(セットファイル) 「最小リスク」、「バランスリスク」、「待機戦略」 の3つのモードで使用できる Bomber Utility 用の設定ファイル このトレーディング戦略をすぐに導入・設定・開始できる ステップバイステップのビデオマニュアル ご注意: 上記の特典を受け取るには、MQL5のプライベートメッセージシステムを通じて販売者にご連絡ください。 オリジナルのカスタムインジケーター 「Divergence Bomber(ダイバージェンス・ボンバー)」 をご紹介します。これは、MACDのダイバージェンス(乖離)戦略に基づいた 「オールインワン」型のトレーディングシステム です。 このテクニカルインジケーターの主な目的は、価格とMACDインジケーターの間に発生するダイバージェンスを検出 し、将来の価格の動きを示す
まず第一に、この取引インジケーターは再描画されず、再描画されず、遅延しないことを強調する価値があります。これにより、手動取引とロボット取引の両方に理想的なものになります。 ユーザーマニュアル:設定、入力、戦略。 アトミックアナリストは、価格の強さとモメンタムを利用して市場でより良いエッジを見つけるためのPA価格アクションインジケーターです。ノイズや誤ったシグナルを除去し、取引ポテンシャルを高めるための高度なフィルターを備えています。複雑なインジケーターの複数のレイヤーを使用して、アトミックアナリストはチャートをスキャンし、複雑な数学的計算をシンプルなシグナルと色に変換します。これにより、どのような初心者トレーダーでも理解して使用し、一貫した取引の決定を行うことができます。 「アトミックアナリスト」は、新規および経験豊富なトレーダー向けにカスタマイズされた包括的な取引ソリューションです。プレミアムインジケーターとトップノッチの機能を1つの取引戦略に組み合わせ、すべてのタイプのトレーダーにとって汎用性のある選択肢にします。 デイリートレーディングとスキャルピング戦略:高速で正確なデイ
SuperScalp Pro — 高度なマルチフィルター対応スキャルピングインジケーターシステム SuperScalp Pro は、クラシックな Supertrend と複数のインテリジェントな確認フィルターを組み合わせた高度なスキャルピング用インジケーターシステムです。M1〜H4 のすべての時間足で効率的に機能し、特に XAUUSD、BTCUSD、および主要なFX通貨ペアに適しています。単体のシステムとして、また既存の取引戦略へ柔軟に統合して使用できます。 本インジケーターは 11 以上のフィルターを統合しており、短期・長期の EMA、トレンド判定に用いる 3 本の EMA、EMA スロープ(EMA slope)、RSI、ADX、出来高、VWAP、ボリンジャーバンドのブレイクアウト、MACD ダイバージェンスフィルターなどを含みます。スマートキャンドルフィルターはローソク足の終値を確認して弱いシグナルを排除し、3 本の EMA と MACD ダイバージェンスを組み合わせたトレンド認識メカニズムにより勝率の高いシグナルの選別を支援します。 SuperScalp Pro は ATR に基
Entry In The Zone and SMC Multi Timeframe は、Smart Money Concepts(SMC)に基づいて開発された リアルタイム市場分析ツール です。 本システムは、トレーダーがマーケットストラクチャーを体系的に分析し、市場全体の方向性をより明確に把握できるよう設計されています。 システムは複数の時間軸にわたり、 反転ポイント(Reversal Points)・主要ゾーン(Key Zones)・マーケットストラクチャー を自動的に解析します。さらに、 POI(Point of Interest)・ノーリペイントシグナル・Auto Fibonacci Levels を表示し、プルバックや反転ポイントを高精度で検出します。 リアルタイムシグナルとアラートにより、価格が主要ゾーンに到達したときや、ゾーン内で反転シグナルが発生した際に、重要な機会を逃すことはありません。 また、本システムは インジケーター と シグナルシステム の両方の機能を兼ね備えた 2-in-1ツール であり、ゾーン分析とリアルタイムエントリーシグナルを一体化しています。 さらに
FX Power: 通貨の強弱を分析して、より賢い取引を実現 概要 FX Power は主要通貨と金の実際の強弱をあらゆる市場状況で理解するための必須ツールです。強い通貨を買い、弱い通貨を売ることで、 FX Power は取引の意思決定を簡素化し、高い確率の取引機会を見出します。トレンドを追従する場合でも、極端なデルタ値を使用して反転を予測する場合でも、このツールはあなたの取引スタイルに完全に適応します。ただ取引するだけではなく、 FX Power で賢く取引をしましょう。 1. なぜ FX Power がトレーダーにとって非常に有益なのか 通貨と金のリアルタイム強弱分析 • FX Power は主要通貨と金の相対的な強弱を計算し、マーケットダイナミクスに関する明確な洞察を提供します。 • どの資産がリードしているか、または後れを取っているかを監視して、取引するペアを賢く選びましょう。 マルチタイムフレームの包括的なビュー • 短期、中期、長期のタイムフレームで通貨と金の強弱を追跡し、マーケットトレンドに基づいて取引戦略を調整できます。 • スキャルピングからスイングトレード
Game Changerは、あらゆる金融商品で使用できる革新的なトレンドインジケーターです。メタトレーダーを強力なトレンドアナライザーへと変貌させます。このインジケーターは再描画や遅延がありません。あらゆる時間枠で動作し、トレンドの特定、反転の可能性のシグナル、トレーリングストップ機能、そして迅速な市場反応のためのリアルタイムアラートを提供します。経験豊富なプロ、あるいは優位性を求める初心者の方でも、このツールは自信と規律を持ち、トレンドの根底にあるダイナミクスを明確に理解した上で取引を行うための力となります。 購入後すぐにご連絡いただくと、個人ボーナスを進呈いたします!強力なサポートとトレンドスキャナーインジケーターの無料コピーもご用意しておりますので、お気軽にプライベートメッセージでご連絡くださ. 私のEAやスペシャルセットはTelegramでは販売しておりません。Mql5のみで販売しており、セットファイルはこちらのブログでのみ公開し ております 。詐欺師にはご注意ください。他の方からセットを購入しないでください。 設定 トレンド変化時のアラートを有効にする - True/Fals
Azimuth Pro
Ottaviano De Cicco
5 (1)
発売プロモーション Azimuth Proは先着100名様限定で 299ドル でご提供します。最終価格は 499ドル となります。 リテールとインスティテューショナルのエントリーの違いはインジケーターではなく、ロケーションにあります。 多くのトレーダーは、モメンタムを追いかけたり、遅行シグナルに反応して、任意の価格レベルでエントリーします。機関投資家は、需給が実際にシフトする構造的なレベルに価格が到達するのを待ちます。 Azimuth Proはこれらのレベルを自動的にマッピングします:スイングアンカーVWAP、マルチタイムフレーム構造ライン、高確率ロケーションにのみ出現するABCパターン。 Azimuth Proは、構造分析とインテリジェントな自動化の両方を求めるプロフェッショナルトレーダー向けに構築されています。 Azimuthが外科的精度で市場構造をマッピングする一方、Azimuth Proはインテリジェンスレイヤーを追加します:トレーディングスタイルの自動検出、スマート設定された移動平均線、20年のデータでバックテストされた最適化パラメータ。その結果、お使いの銘柄と
Super Signal – Skyblade Edition プロ仕様のノンリペイント / ノーラグ・トレンドシグナルシステム。卓越した勝率を実現 | MT4 / MT5 対応 1分足、5分足、15分足などの低い時間足で最も効果を発揮します。 主な特徴: Super Signal – Skyblade Edition は、トレンド取引に特化したスマートなシグナルシステムです。マルチレイヤーのフィルターロジックを用いて、明確な方向性と実際のモメンタムに支えられた強力なトレンドのみを検出します。 このシステムは 天井や底を予測するものではありません 。次の3つの条件がすべて満たされた場合にのみシグナルを発生させます: 明確なトレンド方向 モメンタムの増加 健全なボラティリティ構造 市場セッションに基づく流動性分析と組み合わせることで、シグナルの精度とタイミングがさらに向上します。 シグナルの特性: すべての矢印シグナルは 100% 非リペイント / 遅延なし 一度出現したシグナルは固定され、点滅・消失しません チャート上の矢印、情報パネル、ポップアップ通知、音声アラート、プッシュ通知
Smart Stop Indicator – チャート上で実現するインテリジェントなストップロス精度 概要 Smart Stop Indicator は、ストップロスを勘や感情ではなく、明確で体系的に設定したいトレーダーのために設計されています。本ツールは、クラシックなプライスアクション(高値更新・安値切り下げ)と最新のブレイクアウト認識ロジックを組み合わせ、次に来るべき論理的なストップレベルを正確に特定します。トレンド相場、レンジ、急速なブレイクアウト局面のいずれであっても、最適な SL ゾーンとその状態(“new”、“broken”、“valid”)をチャート上に直接表示します。さらに今回、SL 距離の %ADR 表示も新たに追加されています。 主な特徴 マーケット構造に基づく自動ストップ配置 • 市場構造とリアルタイムの値動きに基づき、意味のあるストップロスレベルを自動検出します。 スマートなブレイクアウト感知 • 急激な方向転換やブレイクアウトにも柔軟に対応し、早すぎるストップ調整を避けます。 SL %ADR の表示 • ストップロスまでの距離を ADR(Averag
トレンド スクリーナー インジケーターでトレンド取引の力を解き放ちます。ファジー ロジックと複数通貨システムを活用した究極のトレンド取引ソリューションです。 ファジー ロジックを活用した革新的なトレンド インジケーターである Trend Screener を使用して、トレンド取引を向上させます。 これは、13 を超えるプレミアム ツールと機能、および 3 つの取引戦略を組み合わせた強力なトレンド追跡インジケーターであり、Metatrader をトレンド アナライザーにする多用途の選択肢となります。 期間限定オファー : トレンド スクリーナー インジケーターは、わずか 100 ドルで生涯ご利用いただけます。 (元の価格 50$ ) (オファー延長) Trend Screener の 100% 非再描画精度の揺るぎない精度を体験して、取引の決定が過去の価格変動の影響を受けないようにしてください。 マルチタイムフレームおよびマルチ通貨機能の多用途性を解放し、比類のない自信を持って外国為替、商品、暗号通貨、インデックスの世界を取引できるようにします。 Trend Screener の包括的な
Berma Bands
Muhammad Elbermawi
5 (7)
Berma Bands (BBs) インジケーターは、市場のトレンドを特定して活用したいトレーダーにとって貴重なツールです。価格と BBs の関係を分析することで、トレーダーは市場がトレンド段階にあるか、レンジ段階にあるかを判断できます。 詳細については、[ Berma Home Blog ] をご覧ください。 バーマ バンドは、上部バーマ バンド、中部バーマ バンド、下部バーマ バンドの 3 つの異なる線で構成されています。これらの線は価格の周りにプロットされ、全体的な傾向に対する価格の動きを視覚的に表します。これらのバンド間の距離から、ボラティリティや潜在的な傾向の反転についての洞察を得ることができます。 バーマ バンドの線がそれぞれ離れると、市場が横ばいまたはレンジ相場の期間に入っていることを示すことがよくあります。これは、明確な方向性の偏りがないことを示しています。トレーダーは、これらの期間中にトレンドを特定するのが難しいと感じる可能性があり、より明確なトレンドが出現するまで待つ場合があります。 バーマ バンドの線が 1 本の線に収束すると、強いトレンド環境の兆候となること
まず第一に、この取引ツールはノンリペイント、ノンリドロー、ノンラグの指標であり、プロの取引に理想的ですことを強調する価値があります。 オンラインコース、ユーザーマニュアル、デモ。 スマートプライスアクションコンセプトインジケーターは、新米から経験豊富なトレーダーまで、非常 に強力なツールです。Inner Circle Trader AnalysisやSmart Money Concepts Trading Strategiesなど、20以上の有用な指標を1つに組み合わせています。このインジケーターはスマートマネーコンセプトに焦点を当て、大手機関の取引方法を提供し、彼らの動きを予測するのに役立ちます。 特に、流動性分析に優れており、機関がどのように取引しているかを理解しやすくしています。市場のトレンドを予測し、価格の動きを慎重に分析するのに優れています。機関の戦略とトレードを合わせることで、市場の動向についてより正確な予測ができます。このインジケーターは多目的であり、市場構造を分析し、重要な注文ブロックを特定し、さまざまなパターンを認識するのに優れています。 このインジケーター
FX Levels: あらゆる市場における非常に高精度なサポート&レジスタンス 概要 通貨ペア、株式指数、個別銘柄やコモディティなど、どのような市場でも信頼できるサポートとレジスタンスを特定したいですか? FX Levels は伝統的な “Lighthouse” メソッドと先進的な動的アプローチを融合し、ほぼ汎用的な精度を実現します。ブローカーの実務経験を活かし、自動化されたデイリー更新とリアルタイム更新を組み合わせることで、 FX Levels は反転ポイントを見つけ、利益目標を設定し、自信をもってトレードを管理するための手助けをします。今すぐ試してみて、サポート/レジスタンス分析の正確性がどれほどトレードを向上させるかを実感してください! 1. FX Levels がトレーダーにとって非常に有用な理由 非常に正確なサポート&レジスタンスゾーン • FX Levels は異なるブローカー環境でもほぼ同一のゾーンを生成するよう設計されており、データフィードの差異や時刻設定のずれによる不一致を解消します。 • つまり、どのブローカーを利用していても一貫したレベルが得られるため、戦
Gold Sniper Scalper Proは、MetaTrader 5向けのプロフェッショナルなindicatorで、トレーダーがエントリーポイントを特定し、リスクを効果的に管理するために設計されています。 このindicatorは、シグナル検出システム、Entry/SL/TPの自動管理、ボリューム分析、リアルタイムパフォーマンス統計を含む包括的な分析ツールセットを提供します。 システムを理解するためのユーザーガイド   |   他の言語のユーザーガイド 主な機能 シグナル検出システム このindicatorは、price actionと市場構造の分析に基づいて潜在的なエントリーポイントを自動検出します。トレード機会を検出すると: - BUY(青)またはSELL(赤)の矢印がchart上に表示されます - ローソク足が色付けされ、シグナルゾーンが識別されます - Entry/SL/TPレベルが自動計算されます シグナルは価格がEntryレベルに触れた時のみ発動し、市場に確認されていないシグナルをフィルタリングします。 インテリジェントなEntry/SL/TP管理 - Ent
優れたテクニカルインジケーター「Grabber」をご紹介します。これは、すぐに使える「オールインワン」トレーディング戦略として機能します。 ひとつのコードに、市場のテクニカル分析ツール、取引シグナル(矢印)、アラート機能、プッシュ通知が強力に統合されています。 このインジケーターを購入された方には、以下の特典を無料で提供します: Grabberユーティリティ:オープンポジションを自動で管理するツール ステップバイステップのビデオマニュアル:インジケーターのインストール、設定、取引方法を解説 カスタムセットファイル:インジケーターをすばやく自動設定し、最大限の成果を出すための設定ファイル 他の戦略はもう忘れてください!Grabberだけが、あなたを新たなトレードの高みへと導いてくれるのです。 Grabber戦略の主な特徴: 推奨タイムフレーム:M5〜H4 対応通貨ペア・資産:どれでも使用可能ですが、私が実際に検証した以下を推奨します(GBPUSD、GBPCAD、GBPCHF、AUDCAD、AUDUSD、AUDSGD、AUDCHF、NZDUSD、NZDCAD、EURCAD、EURUSD、E
現在33%オフ 初心者にもエキスパートトレーダーにも最適なソリューション このインジケーターは独自の機能と新しい公式を多数内蔵しており、ユニークで高品質かつ手頃な取引ツールです。このアップデートでは、2つの時間枠ゾーンを表示できるようになります。より長いTFだけでなく、チャートTFとより長いTF(ネストゾーンを表示)の両方を表示できます。すべてのSupply Demandトレーダーの皆さんのお気に召すはずです。:) 重要情報の公開 Advanced Supply Demandの可能性を最大化するには、 https://www.mql5.com/ja/blogs/post/720245 にアクセスしてください。   エントリーまたはターゲットの正確なトリガーポイントを正確に特定できれば取引がどのように改善されるか想像してみてください。新しい基盤となるアルゴリズムに基づいて構築されているため、買い手と売り手の間の潜在的な不均衡をさらに簡単に特定できます。これは、最も強い需要と供給のゾーンと、過去のパフォーマンス(古いゾーンを表示)がグラフィカルに表現されるためです。これらの機能は、最適な
The Trend Forecaster indicator utilizes a unique proprietary algorithm to determine entry points for a breakout trading strategy. The indicator identifies price clusters, analyzes price movement near levels, and provides a signal when the price breaks through a level. The Trend Forecaster indicator is suitable for all financial assets, including currencies (Forex), metals, stocks, indices, and cryptocurrencies. You can also adjust the indicator to work on any time frames, although it is recommen
TPSproTrend PRO は、市場が実際に方向転換する瞬間を識別し、動きの開始時にエントリー ポイントを形成します。 価格が動き始めた直後に市場に参入し、すでに動き出した後に参入してはいけません。 インジケーター   シグナルを再描画せず、エントリーポイント、ストップロス、テイクプロフィットを自動的に表示するため、取引が明確かつ視覚的かつ構造化されます。 説明書 RUS   -   MT4 バージョン 主な利点 再描画のない信号。 すべての信号は固定です。 矢印が表示された場合 -     もう変化したり消えたりすることはありません。 誤ったシグナルのリスクなしに、安定したデータに基づいて取引の決定を下すことができます。 既製の買い/売りエントリーポイント このインジケーターは、取引を開始するのに最適なタイミングを自動的に決定し、チャート上に矢印で表示します。 推測や主観的な分析は不要。明確なシグナルだけです。 自動ストップロスとテイクプロフィットゾーン 信号の直後に次のものが表示されます: エントリーポイント リスク制限ゾーン(ストップロス) 利益確定ゾーン これにより、
スイングトレーディング は、トレンドの方向のスイングと可能な反転スイングを検出するように設計された最初のインジケーターです。トレーディングの文献で広く説明されているベースラインスイングトレーディングアプローチを使用します。インディケータは、いくつかの価格と時間のベクトルを調査して、全体的なトレンドの方向を追跡し、市場が売られ過ぎまたは買われ過ぎて修正の準備ができている状況を検出します。 [ インストールガイド | 更新ガイド | トラブルシューティング | よくある質問 | すべての製品 ] むち打ちを起こさずに市場スイングの利益 インジケーターは常にトレンドの方向を表示します 色付きの価格帯は機会のベースラインを表します 色付きのダッシュは、可能な反転スイングを表します この指標は、独自の品質とパフォーマンスを分析します 複数時間枠のダッシュボードを実装します カスタマイズ可能なトレンドおよびスイング期間 電子メール/サウンド/プッシュアラートを実装します インジケータは再描画またはバックペインティングではありません Swing Tradingとは Swing Tradingは
これはほぼ間違いなく、MetaTraderプラットフォームで見つけることができる最も完全な調和価格形成自動認識インジケーターです。 19種類のパターンを検出し、フィボナッチプロジェクションをあなたと同じように真剣に受け止め、潜在的逆転ゾーン(PRZ)を表示し、適切なストップロスとテイクプロフィットレベルを見つけます。 [ インストールガイド | 更新ガイド | トラブルシューティング | よくある質問 | すべての製品 ] 19の異なる調和価格形成を検出します プライマリ、派生および補完フィボナッチ投影(PRZ)をプロットします 過去の価格行動を評価し、過去のすべてのパターンを表示します この指標は、独自の品質とパフォーマンスを分析します 適切なストップロスとテイクプロフィットのレベルを表示します ブレイクアウトを使用して適切な取引を通知します すべてのパターン比をグラフにプロットします 電子メール/音声/視覚アラートを実装します スコット・M・カーニーの本に着想を得て、この指標は最も純粋で急を要するトレーダーのニーズを満たすように設計されています。ただし、トレードを容易にする
無料の AUX インジケーターと EA サポ   直接ダウンロード — ここをクリック [ D.I.C.E ] The DICE Indicator Divergence in Chaos Environment は、エリオット波動理論とトレーディングカオス手法を組み合わせて使用するトレーダーのために設計された MT5 専用ツールです。価格変動の中の隠れたおよび通常のダイバージェンスを検出し、ビル・ウィリアムズが説明したカオス市場環境と同期します。 主な特徴 エリオット波動に対応したダイバージェンス検出:波動構造と調和した強気・弱気ダイバージェンスを識別。 カオス手法の統合:AO(オーサムオシレーター)と市場構造に整合。 マルチタイムフレームスキャン:異なる時間枠でダイバージェンスを分析し、トレンドの転換を確認。 視覚的アラートとオブジェクト:チャート上の矢印、ライン、マーカーで即座に識別。 市場適応読解:カオス的状況に自動適応し、ノイズを除去して有効なセットアップを維持。 ブレイクプルバックエントリー手法:シンプルなフィボナッチリトレースメントとピボットポイントを使用。 利点 ダイ
Trend Ai indicatorは、トレンドの識別と実用的なエントリポイントと反転アラートを組み合わせることで、トレーダーの市場分析を強化する優れたツールです。 この指標は、ユーザーが自信と正確さで外国為替市場の複雑さをナビゲートすることを可能にします トレンドAiインジケーターは、主要なシグナル以外にも、プルバックやリトレースメント中に発生するセカンダリエントリポイントを識別し、トレーダーが確立されたトレンド内の価格修正を活用できるようにします。 重要な利点: *MT4およびMT5の仕事 *明確な買いまたは売りシグナル *再描画しません ·すべての資産で動作します 私はeaやセットをtelegram it詐欺で販売しないように注意してください。 すべての設定はここでブログで無料です。  重要! 指示とボーナスを得るために購入後すぐに私に連絡してください! 私の他のプロダクトと同様、実質操作の監視はここに見つけることができます: https://www.mql5.com/en/users/mechanic/seller&nbsp ; 設定および入力: すべての
Golden Spike Premium
Kwaku Bondzie Ghartey
5 (1)
Golden Spikes Indicator Technical indicator for synthetic indices trading on M1 timeframe. Compatible with Boom/Crash indices on Deriv platform and Gain/Pain indices on Weltrade platform. send me A private  message to receive trade ASISTANT EA.. booklet guide:  https://drive.google.com/file/d/1knQJqGHZSP5eQN24ndRz2ayZVCst6XhN/view?usp=sharing Also check my premium spikes bot: https://www.mql5.com/en/market/product/142350 Features Uses Parabolic SAR, RSI, and Bollinger Bands analysis Three risk
Quantum Trend Sniper
Bogdan Ion Puscasu
4.74 (53)
ご紹介   クォンタム トレンド スナイパー インジケーターは 、トレンド反転を特定して取引する方法を変革する画期的な MQL5 インジケーターです。 13年以上の取引経験を持つ経験豊富なトレーダーのチームによって開発されました。     クォンタムトレンドスナイパーインジケーター   は、非常に高い精度でトレンドの反転を識別する革新的な方法で、あなたのトレーディングの旅を新たな高みに押し上げるように設計されています。 ***Quantum Trend Sniper Indicatorを購入すると、Quantum Breakout Indicatorを無料で入手できます!*** クォンタム ブレイクアウト インジケーターは、トレンドの反転を特定するとアラートを発し、矢印を示し、3 つのテイクプロフィットレベルを提案します。 初心者トレーダーにもプロのトレーダーにも適しています。 量子EAチャネル:       ここをクリック MT4のバージョン:       ここをクリック 推奨事項: 期間:すべての時間枠。最良の結果を得るには、M15、M30、H1 のタイムフ
Was: $299  Now: $99  Supply Demand uses previous price action to identify potential imbalances between buyers and sellers. The key is to identify the better odds zones, not just the untouched ones. Blahtech Supply Demand indicator delivers functionality previously unavailable on any trading platform. This 4-in-1 indicator not only highlights the higher probability zones using a multi-criteria strength engine, but also combines it with multi-timeframe trend analysis, previously confirmed swings a
IX Power MT5
Daniel Stein
4.92 (12)
IX Power: 指数、商品、暗号資産、外国為替市場の洞察を発見 概要 IX Power は、指数、商品、暗号資産、外国為替市場の強弱を分析するための多用途ツールです。 FX Power が全ての利用可能な通貨ペアデータを活用して外為ペアで最高の精度を提供する一方、 IX Power は基礎資産の市場データにのみ焦点を当てています。この特性により、 IX Power は非外為市場に最適であり、単純な外為分析にも信頼性の高いツールです。どのチャートでもスムーズに機能し、取引判断を向上させるための明確で実行可能な洞察を提供します。 1. IX Power がトレーダーにとって価値がある理由 複数市場での強弱分析 • IX Power は指数、商品、暗号資産、外為シンボルの強弱を計算し、それぞれの市場に合わせた洞察を提供します。 • US30、WTI、ゴールド、ビットコイン、または通貨ペアなどの資産を監視して取引機会を発見できます。 幅広い市場に適応 • 外為取引では、 FX Power が関連する全ての通貨ペアを分析することで比類のない精度を提供します。 • IX Power
ARIPoint
Temirlan Kdyrkhan
1 (1)
ARIPoint is a powerful trading companion designed to generate high-probability entry signals with dynamic TP/SL/DP levels based on volatility. Built-in performance tracking shows win/loss stats, PP1/PP2 hits, and success rates all updated live. Key Features: Buy/Sell signals with adaptive volatility bands Real-time TP/SL/DP levels based on ATR Built-in MA Filter with optional ATR/StdDev volatility Performance stats panel (Success, Profit/Loss, PP1/PP2) Alerts via popup, sound, push, or email Cu
- Real price is 80$ - 45% Discount (It is 45$ now) Contact me for extra bonus   indicator, instruction or any questions! - Lifetime update free - Non-repaint - Related product: Gann Gold EA - I just sell my products in Elif Kaya Profile, any other websites are stolen old versions, So no any new updates or support. Advantages of  M1 Scalper Pro  Profitability: M1 Scalper Pro is highly profitable with a strict exit strategy. Frequent Opportunities: M1 Scalper Pro  takes advantage of numerous smal
作者のその他のプロダクト
Fortune
Andriy Sydoruk
3 (2)
Advisor (Fortune): Your Reliable Tool for High-Frequency Forex Trading The Fortune advisor is designed to be used on any timeframe, any currency pair, and on any broker's server. Its unique trading system makes it a versatile tool for traders. For optimal performance, it is recommended to trade liquid forex pairs, maintain a low spread, and use a VPS. You can start with a $100 deposit and a lot size of 0.01. Key Features and Benefits High-Frequency Trading : Utilizes two trading options: with v
ForexTrendMT4 Indicator: A Reliable Tool for Market Tracking The ForexTrendMT4 indicator offers reliable market trend tracking, filtering out sudden fluctuations and market noise. This tool helps identify trends and signals favorable entry points into the market using arrows. It is suitable for both scalping on shorter timeframes and long-term trading strategies. Based on the principles of technical analysis, ForexTrendMT4 takes into account the cyclical nature of the market. Key Features and A
This is a professional Expert Advisor, which implements the strategy of trading using the Divergents and DivergentsPoint indicators, as wells as filters of the global trend on higher periods. Analyzing the indicators, the system enters the market with a limited martingale and the ability to open up to 8 orders in one direction. Each series of orders has mandatory TakeProfit and StopLoss levels. Also, a trailing stop based on the SAR indicator is activated for a series in breakeven. The robot aut
Indicator of divergences. It can help you identify the flat and trend areas. It can be applied as a trading filter. It has only one parameter - Period . The indicator does not show entry points, but only visualizes the information. Keep in mind that the approach to trading should be comprehensive, additional information is required for entering the market. Parameters Period - period of the indicator.
Trend indicator based on the price divergence. It can help you in finding the entry points during the analysis. It can be applied as a trading filter. It has two parameters: Period and Level . The Level parameter allows filtering out unnecessary signals. For example, the Level parameter can be set to 0.0001 for EURUSD. The indicator can work both as an entry point generator and as a filter. The indicator clearly visualizes the information. Keep in mind that the approach to trading should be comp
RaptorF4
Andriy Sydoruk
2.6 (5)
The Expert Advisor system works with ticks. Works with a deposit of $100! The elementary unit of analysis for an internal algorithm is a tick. Classical scalping trading method. The robot works well on any historic period with any currency pair. The key value is spread, with default settings can work with the spread up to 10. If the spread is greater than 10, you should use other parameter values. Testing was performed with the spread up to 10 on all ticks. Testing using open prices makes no sen
Carousel expert system compensates drawdowns. The main indicator is Divergents . The EA allows working in one direction (for example, sell order series), while another direction (for example, buy order series) is in drawdown (compensation mode). If series in both directions operate in normal mode, the system does not switch to compensation mode. If a drawdown is detected in one of the directions, the EA goes into the compensation mode and starts compensating the loss-making series by the profita
Versatile expert system follows the principle "stay in the market for as long as possible". The main indicators are Moving Average and Relative Strength Index. The EA supports working in two directions simultaneously both following a trend and against it depending on the settings. A limited number of orders LimitOrders is used for operation. The EA correctly handles errors and reliably works with a deposit 1000 USD and higher. M5 and higher timeframes are supported. The EA has very flexible sett
Экспертная система IdeaClassic создана для спокойной торговли на рынке. Основная ее задача - работа с одни ордером без увеличения лота с обязательными стопами, причем стоп-лосс и тейк-профит должны быть одного порядка. Также есть возможность использовать трейлинг-стоп. Для формирования входного сигнала используется индикатор IdeaTrend . Для анализа данного индикатора используется функция, которая может анализировать данные индикатора комплексно. Анализируется до десяти последних сигналов от инди
IdeaIlan
Andriy Sydoruk
5 (1)
IdeaIlan expert system applies IdeaTrend indicator. The EA applies the martingale principle. The EA allows trading in two directions simultaneously. It also has a full set of tools allowing the EA to follow a trend and add to a position if the trend moves in unfavorable direction. The EA correctly handles errors and reliably works with a deposit of 10 000 USD and higher. M5 and higher timeframes are supported. Stop levels and trailing stop are applied. Parameters Magic - magic number; Requotes
PowerFlash - Советник реализует известную торговую стратегию на основе сетки. Это автоматическая торговая система. Вся работа автоматизирована. Бот использует минимум настроек.  Бот работает следующим образом. Выставляется, одновременно, сетка отложенных ордеров в обе стороны от текущей цены на дистанции, указанной пользователем. Размер сетки регулируется от 1 до 100. После чего, куда бы ни пошел рынок, отложенные ордера будут переходить в рыночные. Если рыночные ордера зайдут в общий профит, то
A unique expert system that works as without optimization, with the same settings (although it can be optimized if desired, especially for some brokers). You can test as you like, all ticks, control points, opening prices. The figure has an example. The potential result when testing an average of 100-500% over 3 years. It is recommended to make a multi-currency, if you choose a balanced combination, you can get results up to 500-1000% per annum with potential testing. Verified by EURUSD. The bot
Prophet is a trend indicator. Shows the direction of turning points. Can be used with an optimal risk-to-profit ratio. The arrows indicate favorable moments and directions for entering the market. Uses one parameter for setting (adjust from 1 to 3). The probability of a successful trend is very high. In the course of work, the take-profit is much larger than the stop-loss! Works on all currency pairs and on all timeframes.
The Trendes indicator works on all currency pairs and on all timeframes. The arrows indicate favorable moments and directions for entering the market. The probability of a successful trend is very high. Trendes can be used for both small pits and long-term trading. The indicator determines the entry points according to the methods described in the book "How to play and win on the stock exchange". Options LengthA  - The number of bars for calculating the first function; LengthB - The number of b
The indicator Martingal works on all currency pairs and on all timeframes. The arrows indicate the optimal input points for the future Martingale averaging, even with a zero exponent. The indicator shows the signal to close the series only if all the previous signals can be closed in the profit. After closing the series in profit, you must immediately open the order in the direction of the signal. Thus, the signal for closing is simultaneously the point of reverse opening to the other side of th
If you do not yet have your trading strategy, you can take advantage of our ready-made trading strategy, which is most effective! The trend indicator Spin is created on the basis of price divergence. Will help in finding the entry points for analysis. Can be used as a filter in the trade. Has one Length parameter. The indicator can work for both entry points and filters. The indicator reflects information in a visual form. Do not forget that the approach to trading should be comprehensive, to en
Intelligent algorithm indicator Variator with accuracy generates input signals and output levels. If the average price is blue, you should look for entry points to open long positions when the market is not overbought, and if the average price is red, you should look for entry points to open short positions when the market is not oversold. The rules can be summarized as follows. You should buy during an uptrend when the price reaches the average or oversold, and sell during a downtrend when the
This indicator shows not just a line of the price balance, but also forecasts it for the specified number of bars ahead. That is, the level of the probable balance of the price reflects on the chart in the future. The level of balancing is set by the Balance parameter, that is, it can be drawn at any level. Forecasting the future with the Shift parameter. The indicator reflects information in a visual form. Do not forget that the approach to trading should be comprehensive, to enter the market r
The algorithm of the Tic Tac Toe indicator differs from the usual indicators on the price charts in that it completely ignores the flow of time and reflects only changes in the price. Instead of displaying the time intervals on the X axis, and the price value on the Y axis, the Tic Tac Toe indicator displays price changes on both axes. The indicator displays in red if prices rise by a certain base value (TicTacToe) and blue if prices fall on the same value. If prices fell / rose by less than a c
Indicator FiboZag - transfer the indicator to the chart and the Fibonacci levels will be built automatically on the last ZigZag turn. The main advantage lies in the correct construction of Fibonacci levels and markup of price levels. Simple, visual and effective use. The indicator is not redrawn and does not lag. Works on all currency pairs and on all timeframes.
Realization of trend movement indication with points for potential stops in the TrendCloud indicator. It can be easily used as an independent trading system. You can interpret this: the location of the course above or below the shadows show the presence of a trend. The transition to the shadow warns of a possible reversal. Entering the price inside the shadow speaks in a flat motion. The indicator tracks the market trend with unsurpassed reliability, ignoring sharp market fluctuations and noises
The Doonchian channel consists of two channel displays. Channel lines are determined by a simple and reliable algorithm. The channel is preferably used for trading inside the channel. The indicator does not redraw and does not lag; simple algorithms are the basis of the work. It works on all currency pairs and on all timeframes. As always a warning, we must not forget that the approach must be comprehensive, the indicator signals require additional information to enter the market.
The VictoryCPM (Currency Power Meter) indicator will show the strength of currency pairs. The indicator is created for those traders who prefer to trade several currency pairs at once. This tool is able to display on the trading chart data on the current strength of various currencies. The foreign exchange market has a dynamic structure, which is why different currencies affect each other. For this reason, in order to identify the optimal point for creating an order, it is necessary to familiari
The  Progressive  Expert System works using sharp tick movements. Works with a deposit of $ 100! The classic method of trading scalping. It is also worth noting that with the allowable spread level, the bot goes through any historical period on any currency pair. There is no point in testing at opening prices, either checkpoints or all tics. It is possible to work on accounts with a floating spread, entry into the market will occur only when the spread is lower than the level specified in the se
Экспертная система Element33 работает, на любых типах счетов. Работает как в 4-х так и с 5-значными котировками. Спрэд и реквоты не критичны, подойдет любой брокер. Экспертная система разбивает историю на 4 квартала, для оптимизации рекомендовано три года на периоде H1 или H4. Оптимизацию можно проводить по ценах открытия, результаты мало отличаются от тестирования по реальным тикам, поскольку бот работает по ценам открытия. Оптимизировать достаточно один раз в месяц! Для получения более хороших
A trend indicator that shows the direction of pivot points. It can be used with an optimal risk to reward ratio. The probability of a success trend is very high. The indicator uses arrows to show favorable time to enter the market and market entry directions. Uses only one adjustable parameter (a value from 1 to 3). Take profit is much larger than stop loss! The indicator works on all currency pairs and time frames.
The  WiseBW  indicator simplifies decision making by recognizing turns using the built-in algorithm, and then confirms signals at support / resistance levels. Thus, the indicator tracks the market trend with unsurpassed reliability, ignoring sharp market fluctuations and noise around the average price. The indicator can be used both for pipsing at small periods, and for long-term trading. Options: updown  - offset pips for indentation of icons; back  - how many bars to take into account; CountBa
The indicator bounds the price according to a cyclic wave dependency using moving averages. Thus, all the crossing points, in which the movement is changed considering the indicator period, are the optimal ones. The crossing points can be used as the potential market reversal points. However, do not forget about the complex approach: the indicator signals require additional data to enter the market.
ComplexPulse - pulse indicator or signal. Sensitive and responsive to price movements. The indicator shows the interdependence of various currency pairs, namely: USD, EUR, GBP, CHF, JPY. Currencies are measured in relative units, so in each unit of time the sum of all currencies will be equal to zero. Hence, one of the main elements of cluster indicators is the zero line, or the balance line (zero line). If a currency is below the balance line, then it is said that the currency is oversold rela
Индикатор RegressionXP рассчитывает два типа регрессии и вычисляет среднеквадратичную девиацию цены на данном диапазоне. Важна прямая золотая линия (регрессия первой степени), показывающая направление и состояние текущего тренда на выбранном таймфрейме. Чем больше угол с горизонталью, тем сильнее тренд. Таким образом, мы имеем возможность делать выводы относительно состояния валютной пары по текущему расположению цены относительно линии регрессии. На расстоянии от золотой линии проходят параллел
フィルタ:
レビューなし
レビューに返信